

Key Insights
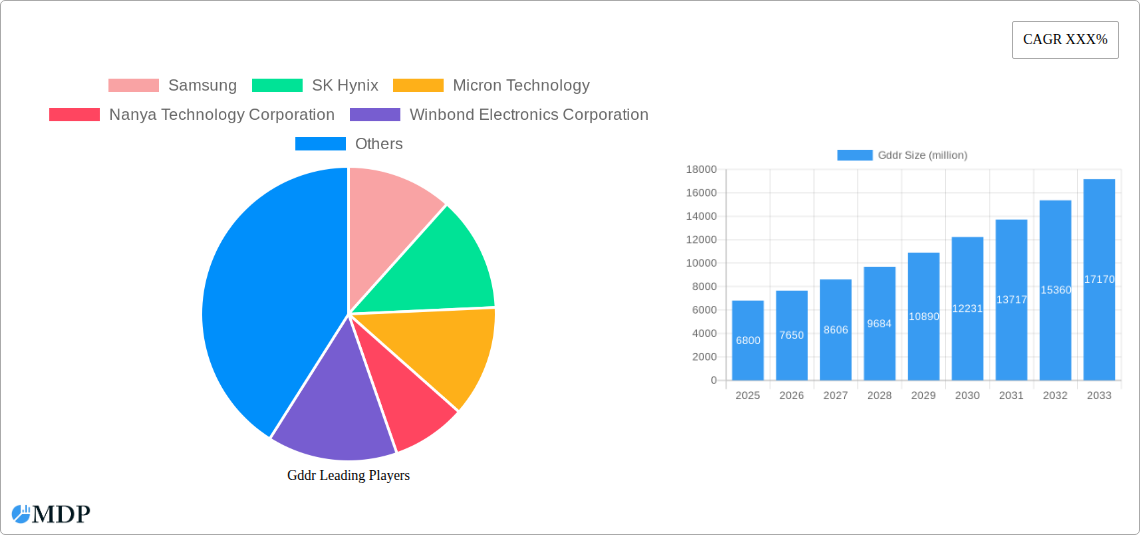
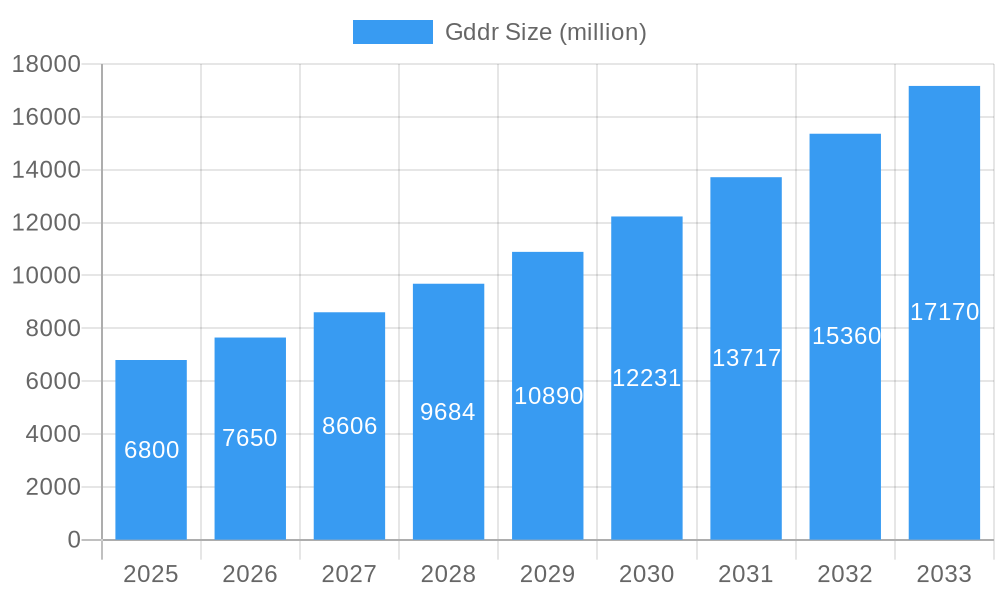
The global GDDR market is poised for significant expansion, projected to reach an estimated market size of USD 6,800 million by 2025, with a robust Compound Annual Growth Rate (CAGR) of 12.5% expected to drive it to over USD 15,000 million by 2033. This growth trajectory is primarily fueled by the escalating demand for high-performance graphics processing units (GPUs) across a spectrum of applications. The burgeoning gaming industry, with its increasing adoption of photorealistic graphics and immersive experiences, stands as a principal demand generator. Furthermore, the rapid advancement and widespread deployment of Artificial Intelligence (AI) and Machine Learning (ML) workloads necessitate powerful memory solutions like GDDR for efficient data processing and model training. The continuous evolution of high-resolution content creation, including professional video editing and virtual reality (VR) development, also contributes substantially to the market's upward trend. Emerging applications in areas such as autonomous driving and scientific simulations are further broadening the market's scope.
Gddr Market Size (In Billion)
The GDDR market is characterized by distinct segments, with the "PCs and Tablets" application segment holding a dominant share due to the enduring popularity of gaming and content creation on these platforms. However, the "Workstations" and "Servers" segments are anticipated to witness the highest growth rates, driven by the increasing computational demands of professional AI/ML research, data analytics, and cloud computing. From a technological perspective, Ball Grid Array (BGA) packages are expected to maintain their leading position due to their superior performance and integration capabilities. Emerging trends such as GDDR6X and future iterations are set to revolutionize memory speeds and bandwidth, enabling even more sophisticated applications. While the market exhibits strong growth, potential supply chain constraints and the high cost of advanced GDDR manufacturing could pose minor challenges. Key players like Samsung, SK Hynix, and Micron Technology are at the forefront of innovation, constantly pushing the boundaries of memory technology to meet the ever-increasing performance requirements of modern computing.
Gddr Company Market Share
Unveiling the GDDR Market: A Comprehensive Analysis of Growth, Innovation, and Leading Players (2019-2033)
This in-depth report provides an exhaustive analysis of the Graphics Double Data Rate (GDDR) market, offering critical insights for stakeholders across the semiconductor industry. Spanning a study period from 2019 to 2033, with a base and estimated year of 2025 and a forecast period of 2025–2033, this report meticulously dissects market dynamics, trends, leading segments, and future outlook. Leveraging high-traffic keywords such as "GDDR market," "graphics memory," "DRAM," "semiconductor industry," "high-speed memory," and "GPU memory," this report ensures maximum search visibility and engagement with industry professionals, investors, and technology decision-makers.
Gddr Market Dynamics & Concentration
The GDDR market, a vital component of high-performance computing, exhibits a moderate to high concentration driven by significant R&D investments and stringent manufacturing requirements. Leading manufacturers like Samsung, SK Hynix, and Micron Technology dominate market share, collectively accounting for over 80% of global production. Innovation in GDDR memory is primarily propelled by the relentless demand for enhanced graphics processing power in gaming, AI, and high-performance computing applications. Regulatory frameworks, while generally supportive of technological advancement, can introduce complexities related to intellectual property and international trade. Product substitutes, such as HBM (High Bandwidth Memory), present a competitive challenge, particularly in specialized, ultra-high-performance segments. End-user trends consistently point towards increased memory bandwidth and capacity requirements, driven by richer graphics and more complex computational workloads. Mergers and acquisition (M&A) activities, though less frequent in recent years due to market maturity, remain a strategic tool for consolidating market share and acquiring advanced technological capabilities. The number of significant M&A deals in the last five years has been approximately 5.
- Market Share Concentration: Top 3 players hold over 80% of the market.
- Innovation Drivers: Increasing demand for higher bandwidth and capacity.
- Regulatory Landscape: Focus on IP protection and international trade policies.
- Product Substitutes: HBM presents competition in high-end segments.
- End-User Trends: Growing demand for advanced graphics and computational power.
- M&A Activities: Strategic consolidation and technology acquisition remain key.
Gddr Industry Trends & Analysis
The GDDR industry is characterized by a robust growth trajectory, underpinned by transformative technological advancements and evolving consumer preferences. The Compound Annual Growth Rate (CAGR) of the GDDR market is projected to be approximately 15% during the forecast period (2025–2033). This impressive growth is fueled by the escalating adoption of high-performance computing across various sectors. Technological disruptions, such as the development of GDDR7 and beyond, are consistently pushing the boundaries of memory speed and efficiency. Consumer preferences are increasingly leaning towards immersive gaming experiences, advanced AI-driven applications, and seamless multitasking, all of which necessitate higher GDDR capacities and bandwidths. The competitive dynamics within the industry are intense, with key players continuously investing in R&D to outpace rivals in terms of performance, power efficiency, and cost-effectiveness. Market penetration of advanced GDDR technologies is expected to accelerate as manufacturers refine their production processes and bring down costs for newer generations. The increasing integration of GDDR memory in data centers for AI training and inference, along with its critical role in professional workstations and the burgeoning metaverse, are significant market penetration drivers. The transition towards higher memory densities and integrated solutions further solidifies the growth prospects. The evolving landscape of graphic processing units (GPUs) and their increasing reliance on specialized memory architectures ensure a consistent demand for GDDR innovations. The report forecasts the global GDDR market to reach over 10 million units sold annually by the end of the forecast period.
Leading Markets & Segments in Gddr
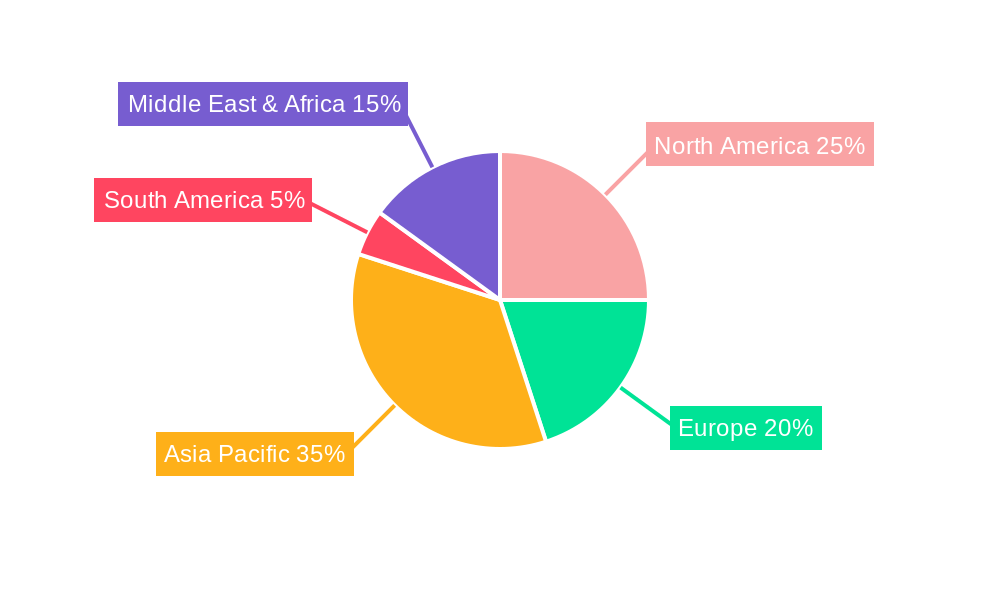
The global GDDR market showcases distinct regional dominance and segment leadership, driven by a confluence of economic policies, technological infrastructure, and consumer demand. Asia-Pacific is the leading region, primarily due to its robust manufacturing base and significant consumption of electronic devices. Within this region, South Korea and Taiwan are pivotal countries, home to major semiconductor manufacturers and a thriving electronics ecosystem. In terms of applications, Servers are emerging as the dominant segment, driven by the exponential growth of cloud computing, AI, and big data analytics. The demand for high-performance servers capable of handling massive datasets and complex computations directly translates to a higher requirement for advanced GDDR memory.
Dominant Region: Asia-Pacific
- Key Countries: South Korea, Taiwan.
- Drivers: Strong semiconductor manufacturing capabilities, high consumer electronics adoption, government support for technological innovation.
Dominant Application Segment: Servers
- Drivers:
- Cloud Computing Expansion: Increasing demand for data storage and processing power.
- AI and Machine Learning: Crucial for training and inference of complex models.
- Big Data Analytics: Processing and analyzing vast datasets.
- Virtualization: Enabling multiple operating systems on a single server.
- Dominance Analysis: The server segment's dominance is a direct consequence of the digital transformation sweeping across industries. Enterprises are increasingly relying on powerful server infrastructure for their core operations, research, and development. This necessitates high-bandwidth, high-capacity memory solutions that GDDR excels at providing, particularly for GPU acceleration within servers. The projected market size for GDDR in the server application segment is expected to exceed 7 million units annually by 2025, representing a substantial portion of the overall market.
- Drivers:
Dominant Type: BGA (Ball Grid Array) remains the dominant form factor, preferred for its high pin density and thermal performance, crucial for densely packed server motherboards and high-performance graphics cards.
- Drivers: High integration capabilities, superior thermal management, established manufacturing processes.
Gddr Product Developments
Recent product developments in GDDR memory are focused on achieving unprecedented speeds and capacities to meet the evolving demands of graphics-intensive applications. Innovations include the introduction of GDDR7, promising significantly higher bandwidth and improved power efficiency compared to its predecessors. These advancements are crucial for next-generation GPUs, enabling richer visual experiences in gaming, accelerating AI workloads, and powering complex scientific simulations. The competitive advantage lies in offering manufacturers the ability to design more powerful and energy-efficient systems, catering to both consumer and enterprise markets. The trend towards increased memory density and lower power consumption per bit continues to drive innovation, making GDDR a critical component for future technological leaps.
Key Drivers of Gddr Growth
The GDDR market's impressive growth is propelled by a synergistic interplay of technological, economic, and regulatory factors. Technologically, the insatiable demand for higher graphics performance in gaming, virtual reality, and professional visualization applications is a primary catalyst. The proliferation of AI and machine learning workloads, requiring massive parallel processing capabilities, further amplifies the need for high-bandwidth memory. Economically, the continued expansion of the global IT infrastructure, including cloud computing, data centers, and high-performance workstations, fuels sustained demand. Government initiatives promoting digital transformation and R&D in advanced technologies also contribute significantly. Furthermore, evolving consumer preferences towards more immersive and visually rich digital experiences ensure a constant push for better graphics capabilities.
- Technological Advancements: The relentless pursuit of higher frame rates, resolution, and complex visual effects.
- AI and Machine Learning Boom: The critical need for fast data processing in training and inference.
- Growth in Cloud Computing and Data Centers: Supporting massive data storage and processing demands.
- Government Support for Technology: Investments in R&D and digital infrastructure.
- Increasing Consumer Demand for Immersive Experiences: Driving the need for more powerful graphics.
Challenges in the Gddr Market
Despite its robust growth, the GDDR market faces several challenges that could temper its expansion. Supply chain disruptions, exacerbated by geopolitical tensions and component shortages, can lead to production delays and price volatility. Intense competitive pressure among manufacturers necessitates continuous R&D investment, leading to high development costs and a risk of commoditization for older technologies. Evolving manufacturing complexities for advanced nodes and specialized memory designs also present significant hurdles. Furthermore, the development and adoption of alternative high-bandwidth memory technologies, such as HBM, pose a competitive threat, particularly in niche, ultra-high-performance applications where cost is a secondary concern. The market for GDDR is projected to experience an estimated 5% slowdown in growth during periods of significant supply chain disruptions.
- Supply Chain Vulnerabilities: Susceptibility to global economic and geopolitical events.
- Intense Competition and High R&D Costs: Pressure to innovate while maintaining profitability.
- Manufacturing Complexity: The increasing difficulty and cost of producing advanced GDDR.
- Emergence of Alternative Memory Technologies: HBM as a significant competitor in specific segments.
Emerging Opportunities in Gddr
The GDDR market is brimming with emerging opportunities driven by technological breakthroughs and strategic market expansions. The burgeoning metaverse and the increasing demand for virtual and augmented reality (VR/AR) applications represent a significant growth catalyst, requiring unparalleled graphics rendering capabilities. The continuous advancement in AI hardware accelerators, beyond GPUs, will also necessitate specialized high-bandwidth memory solutions. Furthermore, strategic partnerships between memory manufacturers and GPU vendors can accelerate the adoption of new GDDR standards and foster co-development of optimized solutions. Expansion into emerging markets with growing demand for high-performance computing and gaming devices presents another avenue for growth. The potential for integrated memory solutions and novel packaging technologies also offers exciting prospects for enhanced performance and efficiency. The projected market for GDDR in VR/AR applications is estimated to grow by 20% annually.
Leading Players in the Gddr Sector
- Samsung
- SK Hynix
- Micron Technology
- Nanya Technology Corporation
- Winbond Electronics Corporation
- Powerchip Technology Corporation
- Intel Corporation
- Elite Semiconductor Memory Technology Inc
- Fujitsu
Key Milestones in Gddr Industry
- 2019: Introduction of GDDR6X, pushing bandwidth capabilities significantly.
- 2020: Increased demand for high-performance GPUs for gaming and professional workstations.
- 2021: Supply chain constraints impact production volumes and pricing.
- 2022: Growing adoption of GDDR6 in enterprise servers for AI acceleration.
- 2023: Advancements in GDDR7 development signal future performance leaps.
- 2024: Continued investment in R&D for next-generation GDDR technologies.
Strategic Outlook for Gddr Market
The strategic outlook for the GDDR market remains exceptionally positive, driven by sustained demand for high-performance graphics and computational power. The market is poised for continued growth, fueled by advancements in AI, the metaverse, and the ever-increasing fidelity of digital experiences. Key growth accelerators include the seamless integration of GDDR into next-generation computing architectures, the development of more power-efficient memory solutions, and strategic collaborations across the ecosystem. Manufacturers focusing on pushing the boundaries of bandwidth, capacity, and latency while optimizing for cost-effectiveness will likely capture significant market share. The strategic imperative for companies will be to maintain a strong R&D pipeline and adapt to the evolving needs of high-performance computing. The market is projected to reach a value of over 20 billion USD by 2033.
Gddr Segmentation
-
1. Application
- 1.1. PCs and Tablets
- 1.2. Smartphones
- 1.3. Workstations
- 1.4. Servers
-
2. Type
- 2.1. BGA
- 2.2. CSP
- 2.3. Others
Gddr Segmentation By Geography
-
1. North America
- 1.1. United States
- 1.2. Canada
- 1.3. Mexico
-
2. South America
- 2.1. Brazil
- 2.2. Argentina
- 2.3. Rest of South America
-
3. Europe
- 3.1. United Kingdom
- 3.2. Germany
- 3.3. France
- 3.4. Italy
- 3.5. Spain
- 3.6. Russia
- 3.7. Benelux
- 3.8. Nordics
- 3.9. Rest of Europe
-
4. Middle East & Africa
- 4.1. Turkey
- 4.2. Israel
- 4.3. GCC
- 4.4. North Africa
- 4.5. South Africa
- 4.6. Rest of Middle East & Africa
-
5. Asia Pacific
- 5.1. China
- 5.2. India
- 5.3. Japan
- 5.4. South Korea
- 5.5. ASEAN
- 5.6. Oceania
- 5.7. Rest of Asia Pacific
Gddr Regional Market Share
Geographic Coverage of Gddr
Gddr REPORT HIGHLIGHTS
| Aspects | Details |
|---|---|
| Study Period | 2020-2034 |
| Base Year | 2025 |
| Estimated Year | 2026 |
| Forecast Period | 2026-2034 |
| Historical Period | 2020-2025 |
| Growth Rate | CAGR of XXX% from 2020-2034 |
| Segmentation |
|
Table of Contents
- 1. Introduction
- 1.1. Research Scope
- 1.2. Market Segmentation
- 1.3. Research Methodology
- 1.4. Definitions and Assumptions
- 2. Executive Summary
- 2.1. Introduction
- 3. Market Dynamics
- 3.1. Introduction
- 3.2. Market Drivers
- 3.3. Market Restrains
- 3.4. Market Trends
- 4. Market Factor Analysis
- 4.1. Porters Five Forces
- 4.2. Supply/Value Chain
- 4.3. PESTEL analysis
- 4.4. Market Entropy
- 4.5. Patent/Trademark Analysis
- 5. Global Gddr Analysis, Insights and Forecast, 2020-2032
- 5.1. Market Analysis, Insights and Forecast - by Application
- 5.1.1. PCs and Tablets
- 5.1.2. Smartphones
- 5.1.3. Workstations
- 5.1.4. Servers
- 5.2. Market Analysis, Insights and Forecast - by Type
- 5.2.1. BGA
- 5.2.2. CSP
- 5.2.3. Others
- 5.3. Market Analysis, Insights and Forecast - by Region
- 5.3.1. North America
- 5.3.2. South America
- 5.3.3. Europe
- 5.3.4. Middle East & Africa
- 5.3.5. Asia Pacific
- 5.1. Market Analysis, Insights and Forecast - by Application
- 6. North America Gddr Analysis, Insights and Forecast, 2020-2032
- 6.1. Market Analysis, Insights and Forecast - by Application
- 6.1.1. PCs and Tablets
- 6.1.2. Smartphones
- 6.1.3. Workstations
- 6.1.4. Servers
- 6.2. Market Analysis, Insights and Forecast - by Type
- 6.2.1. BGA
- 6.2.2. CSP
- 6.2.3. Others
- 6.1. Market Analysis, Insights and Forecast - by Application
- 7. South America Gddr Analysis, Insights and Forecast, 2020-2032
- 7.1. Market Analysis, Insights and Forecast - by Application
- 7.1.1. PCs and Tablets
- 7.1.2. Smartphones
- 7.1.3. Workstations
- 7.1.4. Servers
- 7.2. Market Analysis, Insights and Forecast - by Type
- 7.2.1. BGA
- 7.2.2. CSP
- 7.2.3. Others
- 7.1. Market Analysis, Insights and Forecast - by Application
- 8. Europe Gddr Analysis, Insights and Forecast, 2020-2032
- 8.1. Market Analysis, Insights and Forecast - by Application
- 8.1.1. PCs and Tablets
- 8.1.2. Smartphones
- 8.1.3. Workstations
- 8.1.4. Servers
- 8.2. Market Analysis, Insights and Forecast - by Type
- 8.2.1. BGA
- 8.2.2. CSP
- 8.2.3. Others
- 8.1. Market Analysis, Insights and Forecast - by Application
- 9. Middle East & Africa Gddr Analysis, Insights and Forecast, 2020-2032
- 9.1. Market Analysis, Insights and Forecast - by Application
- 9.1.1. PCs and Tablets
- 9.1.2. Smartphones
- 9.1.3. Workstations
- 9.1.4. Servers
- 9.2. Market Analysis, Insights and Forecast - by Type
- 9.2.1. BGA
- 9.2.2. CSP
- 9.2.3. Others
- 9.1. Market Analysis, Insights and Forecast - by Application
- 10. Asia Pacific Gddr Analysis, Insights and Forecast, 2020-2032
- 10.1. Market Analysis, Insights and Forecast - by Application
- 10.1.1. PCs and Tablets
- 10.1.2. Smartphones
- 10.1.3. Workstations
- 10.1.4. Servers
- 10.2. Market Analysis, Insights and Forecast - by Type
- 10.2.1. BGA
- 10.2.2. CSP
- 10.2.3. Others
- 10.1. Market Analysis, Insights and Forecast - by Application
- 11. Competitive Analysis
- 11.1. Global Market Share Analysis 2025
- 11.2. Company Profiles
- 11.2.1 Samsung
- 11.2.1.1. Overview
- 11.2.1.2. Products
- 11.2.1.3. SWOT Analysis
- 11.2.1.4. Recent Developments
- 11.2.1.5. Financials (Based on Availability)
- 11.2.2 SK Hynix
- 11.2.2.1. Overview
- 11.2.2.2. Products
- 11.2.2.3. SWOT Analysis
- 11.2.2.4. Recent Developments
- 11.2.2.5. Financials (Based on Availability)
- 11.2.3 Micron Technology
- 11.2.3.1. Overview
- 11.2.3.2. Products
- 11.2.3.3. SWOT Analysis
- 11.2.3.4. Recent Developments
- 11.2.3.5. Financials (Based on Availability)
- 11.2.4 Nanya Technology Corporation
- 11.2.4.1. Overview
- 11.2.4.2. Products
- 11.2.4.3. SWOT Analysis
- 11.2.4.4. Recent Developments
- 11.2.4.5. Financials (Based on Availability)
- 11.2.5 Winbond Electronics Corporation
- 11.2.5.1. Overview
- 11.2.5.2. Products
- 11.2.5.3. SWOT Analysis
- 11.2.5.4. Recent Developments
- 11.2.5.5. Financials (Based on Availability)
- 11.2.6 Powerchip Technology Corporation
- 11.2.6.1. Overview
- 11.2.6.2. Products
- 11.2.6.3. SWOT Analysis
- 11.2.6.4. Recent Developments
- 11.2.6.5. Financials (Based on Availability)
- 11.2.7 Intel Corporation
- 11.2.7.1. Overview
- 11.2.7.2. Products
- 11.2.7.3. SWOT Analysis
- 11.2.7.4. Recent Developments
- 11.2.7.5. Financials (Based on Availability)
- 11.2.8 Elite Semiconductor Memory Technology Inc
- 11.2.8.1. Overview
- 11.2.8.2. Products
- 11.2.8.3. SWOT Analysis
- 11.2.8.4. Recent Developments
- 11.2.8.5. Financials (Based on Availability)
- 11.2.9 Fujitsu
- 11.2.9.1. Overview
- 11.2.9.2. Products
- 11.2.9.3. SWOT Analysis
- 11.2.9.4. Recent Developments
- 11.2.9.5. Financials (Based on Availability)
- 11.2.1 Samsung
List of Figures
- Figure 1: Global Gddr Revenue Breakdown (million, %) by Region 2025 & 2033
- Figure 2: North America Gddr Revenue (million), by Application 2025 & 2033
- Figure 3: North America Gddr Revenue Share (%), by Application 2025 & 2033
- Figure 4: North America Gddr Revenue (million), by Type 2025 & 2033
- Figure 5: North America Gddr Revenue Share (%), by Type 2025 & 2033
- Figure 6: North America Gddr Revenue (million), by Country 2025 & 2033
- Figure 7: North America Gddr Revenue Share (%), by Country 2025 & 2033
- Figure 8: South America Gddr Revenue (million), by Application 2025 & 2033
- Figure 9: South America Gddr Revenue Share (%), by Application 2025 & 2033
- Figure 10: South America Gddr Revenue (million), by Type 2025 & 2033
- Figure 11: South America Gddr Revenue Share (%), by Type 2025 & 2033
- Figure 12: South America Gddr Revenue (million), by Country 2025 & 2033
- Figure 13: South America Gddr Revenue Share (%), by Country 2025 & 2033
- Figure 14: Europe Gddr Revenue (million), by Application 2025 & 2033
- Figure 15: Europe Gddr Revenue Share (%), by Application 2025 & 2033
- Figure 16: Europe Gddr Revenue (million), by Type 2025 & 2033
- Figure 17: Europe Gddr Revenue Share (%), by Type 2025 & 2033
- Figure 18: Europe Gddr Revenue (million), by Country 2025 & 2033
- Figure 19: Europe Gddr Revenue Share (%), by Country 2025 & 2033
- Figure 20: Middle East & Africa Gddr Revenue (million), by Application 2025 & 2033
- Figure 21: Middle East & Africa Gddr Revenue Share (%), by Application 2025 & 2033
- Figure 22: Middle East & Africa Gddr Revenue (million), by Type 2025 & 2033
- Figure 23: Middle East & Africa Gddr Revenue Share (%), by Type 2025 & 2033
- Figure 24: Middle East & Africa Gddr Revenue (million), by Country 2025 & 2033
- Figure 25: Middle East & Africa Gddr Revenue Share (%), by Country 2025 & 2033
- Figure 26: Asia Pacific Gddr Revenue (million), by Application 2025 & 2033
- Figure 27: Asia Pacific Gddr Revenue Share (%), by Application 2025 & 2033
- Figure 28: Asia Pacific Gddr Revenue (million), by Type 2025 & 2033
- Figure 29: Asia Pacific Gddr Revenue Share (%), by Type 2025 & 2033
- Figure 30: Asia Pacific Gddr Revenue (million), by Country 2025 & 2033
- Figure 31: Asia Pacific Gddr Revenue Share (%), by Country 2025 & 2033
List of Tables
- Table 1: Global Gddr Revenue million Forecast, by Application 2020 & 2033
- Table 2: Global Gddr Revenue million Forecast, by Type 2020 & 2033
- Table 3: Global Gddr Revenue million Forecast, by Region 2020 & 2033
- Table 4: Global Gddr Revenue million Forecast, by Application 2020 & 2033
- Table 5: Global Gddr Revenue million Forecast, by Type 2020 & 2033
- Table 6: Global Gddr Revenue million Forecast, by Country 2020 & 2033
- Table 7: United States Gddr Revenue (million) Forecast, by Application 2020 & 2033
- Table 8: Canada Gddr Revenue (million) Forecast, by Application 2020 & 2033
- Table 9: Mexico Gddr Revenue (million) Forecast, by Application 2020 & 2033
- Table 10: Global Gddr Revenue million Forecast, by Application 2020 & 2033
- Table 11: Global Gddr Revenue million Forecast, by Type 2020 & 2033
- Table 12: Global Gddr Revenue million Forecast, by Country 2020 & 2033
- Table 13: Brazil Gddr Revenue (million) Forecast, by Application 2020 & 2033
- Table 14: Argentina Gddr Revenue (million) Forecast, by Application 2020 & 2033
- Table 15: Rest of South America Gddr Revenue (million) Forecast, by Application 2020 & 2033
- Table 16: Global Gddr Revenue million Forecast, by Application 2020 & 2033
- Table 17: Global Gddr Revenue million Forecast, by Type 2020 & 2033
- Table 18: Global Gddr Revenue million Forecast, by Country 2020 & 2033
- Table 19: United Kingdom Gddr Revenue (million) Forecast, by Application 2020 & 2033
- Table 20: Germany Gddr Revenue (million) Forecast, by Application 2020 & 2033
- Table 21: France Gddr Revenue (million) Forecast, by Application 2020 & 2033
- Table 22: Italy Gddr Revenue (million) Forecast, by Application 2020 & 2033
- Table 23: Spain Gddr Revenue (million) Forecast, by Application 2020 & 2033
- Table 24: Russia Gddr Revenue (million) Forecast, by Application 2020 & 2033
- Table 25: Benelux Gddr Revenue (million) Forecast, by Application 2020 & 2033
- Table 26: Nordics Gddr Revenue (million) Forecast, by Application 2020 & 2033
- Table 27: Rest of Europe Gddr Revenue (million) Forecast, by Application 2020 & 2033
- Table 28: Global Gddr Revenue million Forecast, by Application 2020 & 2033
- Table 29: Global Gddr Revenue million Forecast, by Type 2020 & 2033
- Table 30: Global Gddr Revenue million Forecast, by Country 2020 & 2033
- Table 31: Turkey Gddr Revenue (million) Forecast, by Application 2020 & 2033
- Table 32: Israel Gddr Revenue (million) Forecast, by Application 2020 & 2033
- Table 33: GCC Gddr Revenue (million) Forecast, by Application 2020 & 2033
- Table 34: North Africa Gddr Revenue (million) Forecast, by Application 2020 & 2033
- Table 35: South Africa Gddr Revenue (million) Forecast, by Application 2020 & 2033
- Table 36: Rest of Middle East & Africa Gddr Revenue (million) Forecast, by Application 2020 & 2033
- Table 37: Global Gddr Revenue million Forecast, by Application 2020 & 2033
- Table 38: Global Gddr Revenue million Forecast, by Type 2020 & 2033
- Table 39: Global Gddr Revenue million Forecast, by Country 2020 & 2033
- Table 40: China Gddr Revenue (million) Forecast, by Application 2020 & 2033
- Table 41: India Gddr Revenue (million) Forecast, by Application 2020 & 2033
- Table 42: Japan Gddr Revenue (million) Forecast, by Application 2020 & 2033
- Table 43: South Korea Gddr Revenue (million) Forecast, by Application 2020 & 2033
- Table 44: ASEAN Gddr Revenue (million) Forecast, by Application 2020 & 2033
- Table 45: Oceania Gddr Revenue (million) Forecast, by Application 2020 & 2033
- Table 46: Rest of Asia Pacific Gddr Revenue (million) Forecast, by Application 2020 & 2033
Frequently Asked Questions
1. What is the projected Compound Annual Growth Rate (CAGR) of the Gddr?
The projected CAGR is approximately XXX%.
2. Which companies are prominent players in the Gddr?
Key companies in the market include Samsung, SK Hynix, Micron Technology, Nanya Technology Corporation, Winbond Electronics Corporation, Powerchip Technology Corporation, Intel Corporation, Elite Semiconductor Memory Technology Inc, Fujitsu.
3. What are the main segments of the Gddr?
The market segments include Application, Type.
4. Can you provide details about the market size?
The market size is estimated to be USD XXX million as of 2022.
5. What are some drivers contributing to market growth?
N/A
6. What are the notable trends driving market growth?
N/A
7. Are there any restraints impacting market growth?
N/A
8. Can you provide examples of recent developments in the market?
N/A
9. What pricing options are available for accessing the report?
Pricing options include single-user, multi-user, and enterprise licenses priced at USD 2900.00, USD 4350.00, and USD 5800.00 respectively.
10. Is the market size provided in terms of value or volume?
The market size is provided in terms of value, measured in million.
11. Are there any specific market keywords associated with the report?
Yes, the market keyword associated with the report is "Gddr," which aids in identifying and referencing the specific market segment covered.
12. How do I determine which pricing option suits my needs best?
The pricing options vary based on user requirements and access needs. Individual users may opt for single-user licenses, while businesses requiring broader access may choose multi-user or enterprise licenses for cost-effective access to the report.
13. Are there any additional resources or data provided in the Gddr report?
While the report offers comprehensive insights, it's advisable to review the specific contents or supplementary materials provided to ascertain if additional resources or data are available.
14. How can I stay updated on further developments or reports in the Gddr?
To stay informed about further developments, trends, and reports in the Gddr, consider subscribing to industry newsletters, following relevant companies and organizations, or regularly checking reputable industry news sources and publications.
Methodology
Step 1 - Identification of Relevant Samples Size from Population Database


Step 2 - Approaches for Defining Global Market Size (Value, Volume* & Price*)

Note*: In applicable scenarios
Step 3 - Data Sources
Primary Research
- Web Analytics
- Survey Reports
- Research Institute
- Latest Research Reports
- Opinion Leaders
Secondary Research
- Annual Reports
- White Paper
- Latest Press Release
- Industry Association
- Paid Database
- Investor Presentations

Step 4 - Data Triangulation
Involves using different sources of information in order to increase the validity of a study
These sources are likely to be stakeholders in a program - participants, other researchers, program staff, other community members, and so on.
Then we put all data in single framework & apply various statistical tools to find out the dynamic on the market.
During the analysis stage, feedback from the stakeholder groups would be compared to determine areas of agreement as well as areas of divergence