

Key Insights
The global market for flavor masking agents in food and beverages is experiencing robust growth, driven by increasing consumer demand for healthier, more palatable food and beverage products. The rising prevalence of health concerns related to sugar and salt intake is fueling innovation in this sector, with manufacturers seeking effective solutions to reduce these ingredients without compromising taste. This has led to significant investment in research and development of novel masking agents that effectively neutralize undesirable flavors, such as bitterness in functional foods or off-flavors in processed foods. Furthermore, the growing popularity of functional foods and beverages, incorporating ingredients like probiotics and vitamins, often necessitates masking agents to overcome unpleasant tastes associated with these beneficial additions. The market is segmented by type (e.g., natural vs. synthetic), application (e.g., dairy, confectionery, beverages), and geography. Key players like Synergy Flavor, Firmenich International, and Kerry Group are driving innovation and expanding their market share through strategic partnerships, acquisitions, and new product launches. The market's future growth trajectory suggests continued expansion driven by evolving consumer preferences and ongoing technological advancements.
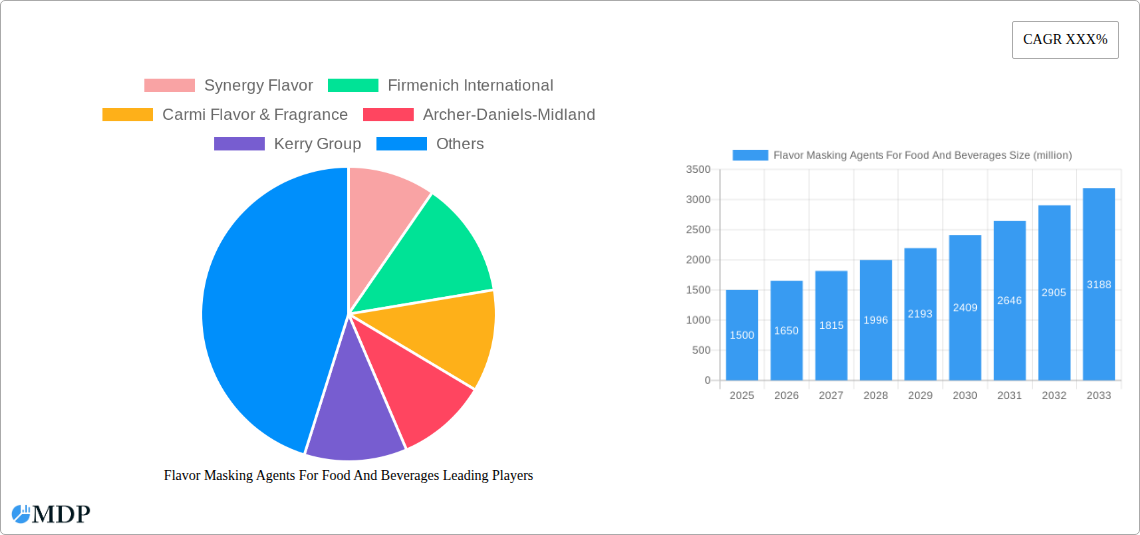
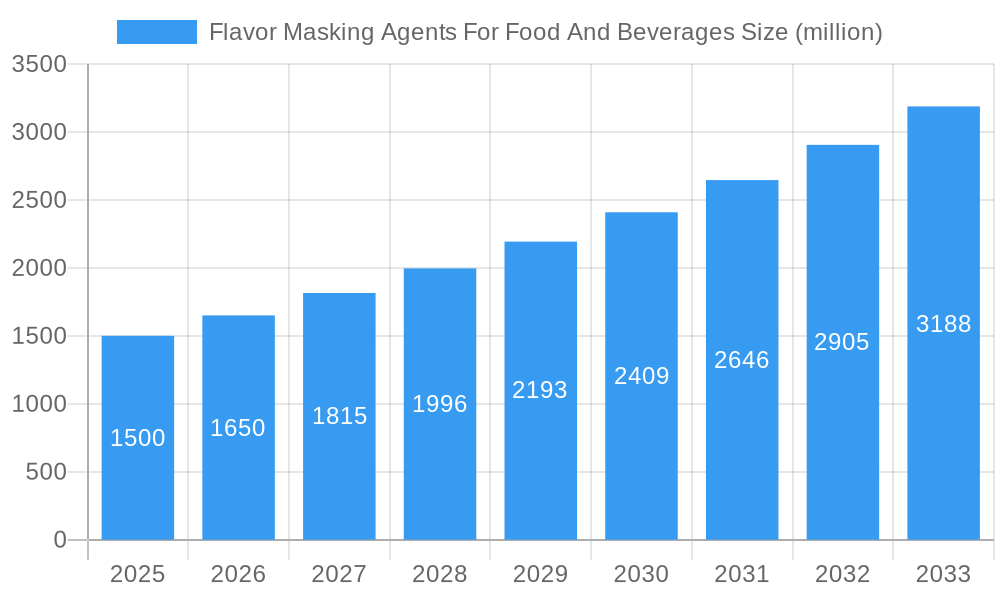
Flavor Masking Agents For Food And Beverages Market Size (In Billion)
Projected growth in the flavor masking agents market is substantial, fueled by the aforementioned factors. The increase in demand for convenient, ready-to-eat meals often requires masking agents to improve the overall taste experience. In addition, the rise of personalized nutrition and customized dietary solutions has presented an opportunity for flavor masking agents to tailor the taste profiles of specific products. This customization demands advanced solutions, further pushing the need for research and development, impacting market dynamics positively. While potential regulatory hurdles and the fluctuating prices of raw materials pose challenges, the overall market outlook for flavor masking agents in food and beverages remains optimistic, with a strong forecast for continued expansion. Market leaders are actively exploring sustainable and natural masking agents, catering to the growing consumer demand for clean-label products.
Flavor Masking Agents For Food And Beverages Company Market Share
Flavor Masking Agents For Food and Beverages Market Report: 2019-2033
Uncover the lucrative opportunities and challenges shaping the multi-million dollar Flavor Masking Agents market for food and beverages. This comprehensive report provides an in-depth analysis of market dynamics, industry trends, leading players, and future growth prospects, covering the period 2019-2033. Benefit from actionable insights to inform your strategic decision-making in this rapidly evolving sector. The report's meticulous research draws on extensive data analysis, covering historical performance (2019-2024), current estimates (2025), and future projections (2025-2033).
Flavor Masking Agents For Food And Beverages Market Dynamics & Concentration
This section analyzes the competitive landscape of the flavor masking agents market for food and beverages, focusing on market concentration, innovation drivers, regulatory landscapes, product substitutes, end-user trends, and mergers and acquisitions (M&A) activity. The global market size is estimated at $XX million in 2025. Market concentration is moderate, with several key players holding significant shares.
Market Share: The top 5 companies hold an estimated xx% of the market share in 2025, with a projected increase to xx% by 2033. This concentration is driven by economies of scale and strong R&D capabilities.
Innovation Drivers: Ongoing innovation in masking technologies, particularly bio-based and sustainable solutions, is driving market growth. Demand for clean-label products is fueling the development of natural and organic masking agents.
Regulatory Frameworks: Stringent food safety regulations across various regions impact the adoption of masking agents. Compliance costs and evolving regulations represent both challenges and opportunities for innovation.
Product Substitutes: While natural flavor masking agents are gaining traction, the market faces some level of competition from other flavor modification techniques. The adoption of alternative techniques varies across different food and beverage sectors based on their properties and cost effectiveness.
End-User Trends: Growing health consciousness among consumers is driving demand for healthier food and beverages, consequently impacting the demand for masking agents to cover the taste and odor of functional ingredients.
M&A Activity: The number of M&A deals in the sector during 2019-2024 was approximately xx. Consolidation is expected to continue, driven by the pursuit of economies of scale and enhanced product portfolios.
Flavor Masking Agents For Food And Beverages Industry Trends & Analysis
This section delves into the key trends shaping the flavor masking agents market for food and beverages, including market growth drivers, technological advancements, shifting consumer preferences, and competitive dynamics. The market is projected to experience a CAGR of xx% during the forecast period (2025-2033). Market penetration in specific segments (e.g., dairy, beverages) will vary, with higher penetration rates anticipated in segments with strong demand for healthier and more palatable products.
The increased demand for customized taste profiles is a key driving force behind the growth. Technological advancements, such as the development of more effective and sustainable masking agents, are further augmenting market growth. Consumer preference for natural and clean-label products presents both challenges and opportunities, accelerating the development of naturally derived masking solutions. The competitive landscape is characterized by both intense competition among established players and the emergence of innovative startups. These dynamics collectively shape the market trajectory and provide both opportunities and risks for stakeholders.
Leading Markets & Segments in Flavor Masking Agents For Food And Beverages
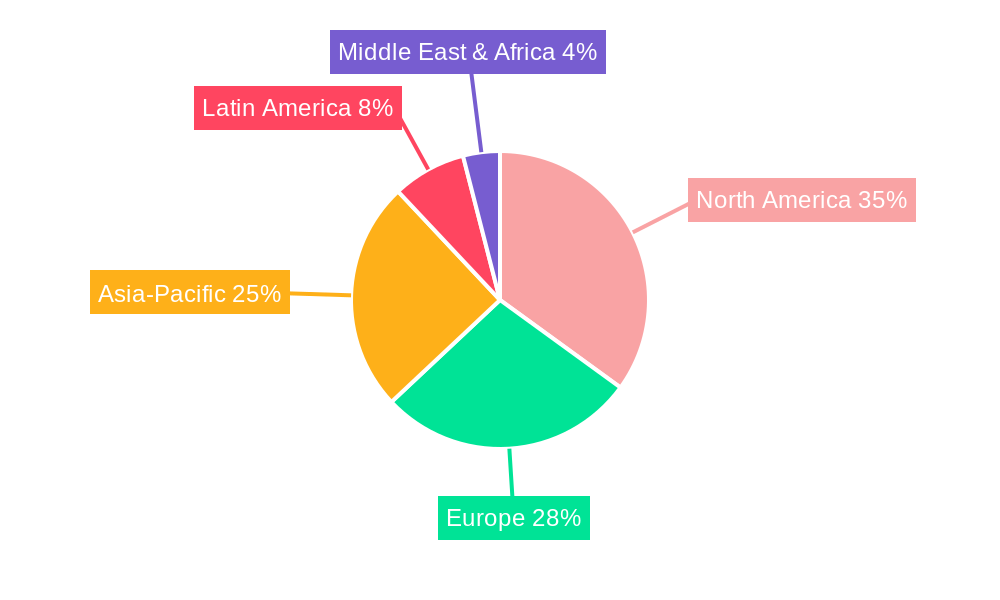
This section identifies the dominant regions and segments within the flavor masking agents market for food and beverages. While precise regional market share data are unavailable, North America and Europe are anticipated to hold significant shares due to high consumer demand for processed foods and beverages. Asia-Pacific is also experiencing rapid growth, driven by rising disposable incomes and changing consumer preferences.
Key Drivers for Dominance:
North America & Europe: Established food and beverage industries, strong regulatory frameworks, and high consumer spending contribute to market dominance.
Asia-Pacific: Rapid economic growth, rising disposable incomes, and increasing demand for processed foods are fueling significant market expansion.
Segment-Specific Drivers: The dairy and beverage segments are projected to show particularly robust growth, driven by the need to mask the taste of functional ingredients and improve product palatability.
Flavor Masking Agents For Food And Beverages Product Developments
Recent product innovations focus on natural, sustainable, and highly effective masking agents. Technological advancements have led to the development of tailored solutions for various food and beverage applications, addressing specific taste and odor challenges. These innovations provide competitive advantages by offering improved masking efficacy, enhanced product quality, and cost-effectiveness. The market is seeing a shift toward personalized flavor profiles, requiring more specialized masking agent formulations tailored to specific consumer preferences.
Key Drivers of Flavor Masking Agents For Food And Beverages Growth
The growth of the flavor masking agents market is propelled by several factors. The rising demand for healthier and more palatable food and beverages is a significant driver. Technological advancements resulting in more effective and sustainable masking agents are also accelerating growth. Furthermore, the increasing demand for clean-label products is driving the development of natural and organic alternatives to synthetic masking agents. Finally, stringent regulatory requirements are pushing innovation towards safer and more compliant solutions.
Challenges in the Flavor Masking Agents For Food And Beverages Market
Several challenges hinder the growth of the flavor masking agents market. The high cost of research and development for new, natural masking agents remains a barrier for many companies. Strict regulatory hurdles in several countries can slow the approval process of new products. Furthermore, supply chain complexities and potential volatility in raw material prices impact the profitability of masking agent manufacturers. Finally, intense competition among both established players and new entrants is creating pressure on pricing and margins.
Emerging Opportunities in Flavor Masking Agents For Food And Beverages
The flavor masking agents market presents significant long-term growth opportunities. The development of innovative, sustainable, and natural masking agents is opening up new application possibilities. Strategic partnerships among masking agent manufacturers, food and beverage companies, and ingredient suppliers can accelerate innovation and market penetration. Expanding into new geographical markets with growing demand for processed foods and beverages represents a promising avenue for growth. The focus on clean label and personalized nutrition will fuel the demand for advanced masking solutions.
Leading Players in the Flavor Masking Agents For Food And Beverages Sector
- Synergy Flavor
- Firmenich International
- Carmi Flavor & Fragrance
- Archer-Daniels-Midland
- Kerry Group
- Tate & Lyle
- Virginia Dare Extract
- Sensient Technologies
- GEO Specialty Chemicals
- Koninklijke
- ADM
- Cargill, Incorporated
- Keva Flavours Pvt. Ltd
- Roquette Freres
Key Milestones in Flavor Masking Agents For Food And Beverages Industry
- 2020: Launch of a new line of natural masking agents by Kerry Group.
- 2021: Acquisition of a smaller flavor company by Firmenich International.
- 2022: Introduction of a novel masking technology by Sensient Technologies.
- 2023: Increased regulatory scrutiny regarding the use of certain masking agents in food products.
- 2024: Significant investment in R&D by ADM focused on sustainable flavor masking.
Strategic Outlook for Flavor Masking Agents For Food And Beverages Market
The flavor masking agents market holds substantial potential for growth in the coming years. Innovation in natural and sustainable solutions will remain a key driver. Strategic partnerships and collaborations will facilitate the development of targeted masking solutions for various food and beverage applications. The demand for clean-label and functional foods is expected to further drive the market’s evolution. Expanding into emerging markets and tapping into niche segments will provide significant growth opportunities for industry stakeholders.
Flavor Masking Agents For Food And Beverages Segmentation
-
1. Application
- 1.1. Commercial
- 1.2. Residential
-
2. Type
- 2.1. Salt Flavor
- 2.2. Fat Flavor
- 2.3. Bitter Flavor
- 2.4. Others
Flavor Masking Agents For Food And Beverages Segmentation By Geography
-
1. North America
- 1.1. United States
- 1.2. Canada
- 1.3. Mexico
-
2. South America
- 2.1. Brazil
- 2.2. Argentina
- 2.3. Rest of South America
-
3. Europe
- 3.1. United Kingdom
- 3.2. Germany
- 3.3. France
- 3.4. Italy
- 3.5. Spain
- 3.6. Russia
- 3.7. Benelux
- 3.8. Nordics
- 3.9. Rest of Europe
-
4. Middle East & Africa
- 4.1. Turkey
- 4.2. Israel
- 4.3. GCC
- 4.4. North Africa
- 4.5. South Africa
- 4.6. Rest of Middle East & Africa
-
5. Asia Pacific
- 5.1. China
- 5.2. India
- 5.3. Japan
- 5.4. South Korea
- 5.5. ASEAN
- 5.6. Oceania
- 5.7. Rest of Asia Pacific
Flavor Masking Agents For Food And Beverages Regional Market Share
Geographic Coverage of Flavor Masking Agents For Food And Beverages
Flavor Masking Agents For Food And Beverages REPORT HIGHLIGHTS
| Aspects | Details |
|---|---|
| Study Period | 2020-2034 |
| Base Year | 2025 |
| Estimated Year | 2026 |
| Forecast Period | 2026-2034 |
| Historical Period | 2020-2025 |
| Growth Rate | CAGR of XXX% from 2020-2034 |
| Segmentation |
|
Table of Contents
- 1. Introduction
- 1.1. Research Scope
- 1.2. Market Segmentation
- 1.3. Research Methodology
- 1.4. Definitions and Assumptions
- 2. Executive Summary
- 2.1. Introduction
- 3. Market Dynamics
- 3.1. Introduction
- 3.2. Market Drivers
- 3.3. Market Restrains
- 3.4. Market Trends
- 4. Market Factor Analysis
- 4.1. Porters Five Forces
- 4.2. Supply/Value Chain
- 4.3. PESTEL analysis
- 4.4. Market Entropy
- 4.5. Patent/Trademark Analysis
- 5. Global Flavor Masking Agents For Food And Beverages Analysis, Insights and Forecast, 2020-2032
- 5.1. Market Analysis, Insights and Forecast - by Application
- 5.1.1. Commercial
- 5.1.2. Residential
- 5.2. Market Analysis, Insights and Forecast - by Type
- 5.2.1. Salt Flavor
- 5.2.2. Fat Flavor
- 5.2.3. Bitter Flavor
- 5.2.4. Others
- 5.3. Market Analysis, Insights and Forecast - by Region
- 5.3.1. North America
- 5.3.2. South America
- 5.3.3. Europe
- 5.3.4. Middle East & Africa
- 5.3.5. Asia Pacific
- 5.1. Market Analysis, Insights and Forecast - by Application
- 6. North America Flavor Masking Agents For Food And Beverages Analysis, Insights and Forecast, 2020-2032
- 6.1. Market Analysis, Insights and Forecast - by Application
- 6.1.1. Commercial
- 6.1.2. Residential
- 6.2. Market Analysis, Insights and Forecast - by Type
- 6.2.1. Salt Flavor
- 6.2.2. Fat Flavor
- 6.2.3. Bitter Flavor
- 6.2.4. Others
- 6.1. Market Analysis, Insights and Forecast - by Application
- 7. South America Flavor Masking Agents For Food And Beverages Analysis, Insights and Forecast, 2020-2032
- 7.1. Market Analysis, Insights and Forecast - by Application
- 7.1.1. Commercial
- 7.1.2. Residential
- 7.2. Market Analysis, Insights and Forecast - by Type
- 7.2.1. Salt Flavor
- 7.2.2. Fat Flavor
- 7.2.3. Bitter Flavor
- 7.2.4. Others
- 7.1. Market Analysis, Insights and Forecast - by Application
- 8. Europe Flavor Masking Agents For Food And Beverages Analysis, Insights and Forecast, 2020-2032
- 8.1. Market Analysis, Insights and Forecast - by Application
- 8.1.1. Commercial
- 8.1.2. Residential
- 8.2. Market Analysis, Insights and Forecast - by Type
- 8.2.1. Salt Flavor
- 8.2.2. Fat Flavor
- 8.2.3. Bitter Flavor
- 8.2.4. Others
- 8.1. Market Analysis, Insights and Forecast - by Application
- 9. Middle East & Africa Flavor Masking Agents For Food And Beverages Analysis, Insights and Forecast, 2020-2032
- 9.1. Market Analysis, Insights and Forecast - by Application
- 9.1.1. Commercial
- 9.1.2. Residential
- 9.2. Market Analysis, Insights and Forecast - by Type
- 9.2.1. Salt Flavor
- 9.2.2. Fat Flavor
- 9.2.3. Bitter Flavor
- 9.2.4. Others
- 9.1. Market Analysis, Insights and Forecast - by Application
- 10. Asia Pacific Flavor Masking Agents For Food And Beverages Analysis, Insights and Forecast, 2020-2032
- 10.1. Market Analysis, Insights and Forecast - by Application
- 10.1.1. Commercial
- 10.1.2. Residential
- 10.2. Market Analysis, Insights and Forecast - by Type
- 10.2.1. Salt Flavor
- 10.2.2. Fat Flavor
- 10.2.3. Bitter Flavor
- 10.2.4. Others
- 10.1. Market Analysis, Insights and Forecast - by Application
- 11. Competitive Analysis
- 11.1. Global Market Share Analysis 2025
- 11.2. Company Profiles
- 11.2.1 Synergy Flavor
- 11.2.1.1. Overview
- 11.2.1.2. Products
- 11.2.1.3. SWOT Analysis
- 11.2.1.4. Recent Developments
- 11.2.1.5. Financials (Based on Availability)
- 11.2.2 Firmenich International
- 11.2.2.1. Overview
- 11.2.2.2. Products
- 11.2.2.3. SWOT Analysis
- 11.2.2.4. Recent Developments
- 11.2.2.5. Financials (Based on Availability)
- 11.2.3 Carmi Flavor & Fragrance
- 11.2.3.1. Overview
- 11.2.3.2. Products
- 11.2.3.3. SWOT Analysis
- 11.2.3.4. Recent Developments
- 11.2.3.5. Financials (Based on Availability)
- 11.2.4 Archer-Daniels-Midland
- 11.2.4.1. Overview
- 11.2.4.2. Products
- 11.2.4.3. SWOT Analysis
- 11.2.4.4. Recent Developments
- 11.2.4.5. Financials (Based on Availability)
- 11.2.5 Kerry Group
- 11.2.5.1. Overview
- 11.2.5.2. Products
- 11.2.5.3. SWOT Analysis
- 11.2.5.4. Recent Developments
- 11.2.5.5. Financials (Based on Availability)
- 11.2.6 Tate & Lyle
- 11.2.6.1. Overview
- 11.2.6.2. Products
- 11.2.6.3. SWOT Analysis
- 11.2.6.4. Recent Developments
- 11.2.6.5. Financials (Based on Availability)
- 11.2.7 Virginia Dare Extract
- 11.2.7.1. Overview
- 11.2.7.2. Products
- 11.2.7.3. SWOT Analysis
- 11.2.7.4. Recent Developments
- 11.2.7.5. Financials (Based on Availability)
- 11.2.8 Sensient Technologies
- 11.2.8.1. Overview
- 11.2.8.2. Products
- 11.2.8.3. SWOT Analysis
- 11.2.8.4. Recent Developments
- 11.2.8.5. Financials (Based on Availability)
- 11.2.9 GEO Specialty Chemicals
- 11.2.9.1. Overview
- 11.2.9.2. Products
- 11.2.9.3. SWOT Analysis
- 11.2.9.4. Recent Developments
- 11.2.9.5. Financials (Based on Availability)
- 11.2.10 Koninklijke
- 11.2.10.1. Overview
- 11.2.10.2. Products
- 11.2.10.3. SWOT Analysis
- 11.2.10.4. Recent Developments
- 11.2.10.5. Financials (Based on Availability)
- 11.2.11 ADM
- 11.2.11.1. Overview
- 11.2.11.2. Products
- 11.2.11.3. SWOT Analysis
- 11.2.11.4. Recent Developments
- 11.2.11.5. Financials (Based on Availability)
- 11.2.12 Cargill
- 11.2.12.1. Overview
- 11.2.12.2. Products
- 11.2.12.3. SWOT Analysis
- 11.2.12.4. Recent Developments
- 11.2.12.5. Financials (Based on Availability)
- 11.2.13 Incorporated
- 11.2.13.1. Overview
- 11.2.13.2. Products
- 11.2.13.3. SWOT Analysis
- 11.2.13.4. Recent Developments
- 11.2.13.5. Financials (Based on Availability)
- 11.2.14 Keva Flavours Pvt. Ltd
- 11.2.14.1. Overview
- 11.2.14.2. Products
- 11.2.14.3. SWOT Analysis
- 11.2.14.4. Recent Developments
- 11.2.14.5. Financials (Based on Availability)
- 11.2.15 Roquette Freres
- 11.2.15.1. Overview
- 11.2.15.2. Products
- 11.2.15.3. SWOT Analysis
- 11.2.15.4. Recent Developments
- 11.2.15.5. Financials (Based on Availability)
- 11.2.1 Synergy Flavor
List of Figures
- Figure 1: Global Flavor Masking Agents For Food And Beverages Revenue Breakdown (million, %) by Region 2025 & 2033
- Figure 2: Global Flavor Masking Agents For Food And Beverages Volume Breakdown (K, %) by Region 2025 & 2033
- Figure 3: North America Flavor Masking Agents For Food And Beverages Revenue (million), by Application 2025 & 2033
- Figure 4: North America Flavor Masking Agents For Food And Beverages Volume (K), by Application 2025 & 2033
- Figure 5: North America Flavor Masking Agents For Food And Beverages Revenue Share (%), by Application 2025 & 2033
- Figure 6: North America Flavor Masking Agents For Food And Beverages Volume Share (%), by Application 2025 & 2033
- Figure 7: North America Flavor Masking Agents For Food And Beverages Revenue (million), by Type 2025 & 2033
- Figure 8: North America Flavor Masking Agents For Food And Beverages Volume (K), by Type 2025 & 2033
- Figure 9: North America Flavor Masking Agents For Food And Beverages Revenue Share (%), by Type 2025 & 2033
- Figure 10: North America Flavor Masking Agents For Food And Beverages Volume Share (%), by Type 2025 & 2033
- Figure 11: North America Flavor Masking Agents For Food And Beverages Revenue (million), by Country 2025 & 2033
- Figure 12: North America Flavor Masking Agents For Food And Beverages Volume (K), by Country 2025 & 2033
- Figure 13: North America Flavor Masking Agents For Food And Beverages Revenue Share (%), by Country 2025 & 2033
- Figure 14: North America Flavor Masking Agents For Food And Beverages Volume Share (%), by Country 2025 & 2033
- Figure 15: South America Flavor Masking Agents For Food And Beverages Revenue (million), by Application 2025 & 2033
- Figure 16: South America Flavor Masking Agents For Food And Beverages Volume (K), by Application 2025 & 2033
- Figure 17: South America Flavor Masking Agents For Food And Beverages Revenue Share (%), by Application 2025 & 2033
- Figure 18: South America Flavor Masking Agents For Food And Beverages Volume Share (%), by Application 2025 & 2033
- Figure 19: South America Flavor Masking Agents For Food And Beverages Revenue (million), by Type 2025 & 2033
- Figure 20: South America Flavor Masking Agents For Food And Beverages Volume (K), by Type 2025 & 2033
- Figure 21: South America Flavor Masking Agents For Food And Beverages Revenue Share (%), by Type 2025 & 2033
- Figure 22: South America Flavor Masking Agents For Food And Beverages Volume Share (%), by Type 2025 & 2033
- Figure 23: South America Flavor Masking Agents For Food And Beverages Revenue (million), by Country 2025 & 2033
- Figure 24: South America Flavor Masking Agents For Food And Beverages Volume (K), by Country 2025 & 2033
- Figure 25: South America Flavor Masking Agents For Food And Beverages Revenue Share (%), by Country 2025 & 2033
- Figure 26: South America Flavor Masking Agents For Food And Beverages Volume Share (%), by Country 2025 & 2033
- Figure 27: Europe Flavor Masking Agents For Food And Beverages Revenue (million), by Application 2025 & 2033
- Figure 28: Europe Flavor Masking Agents For Food And Beverages Volume (K), by Application 2025 & 2033
- Figure 29: Europe Flavor Masking Agents For Food And Beverages Revenue Share (%), by Application 2025 & 2033
- Figure 30: Europe Flavor Masking Agents For Food And Beverages Volume Share (%), by Application 2025 & 2033
- Figure 31: Europe Flavor Masking Agents For Food And Beverages Revenue (million), by Type 2025 & 2033
- Figure 32: Europe Flavor Masking Agents For Food And Beverages Volume (K), by Type 2025 & 2033
- Figure 33: Europe Flavor Masking Agents For Food And Beverages Revenue Share (%), by Type 2025 & 2033
- Figure 34: Europe Flavor Masking Agents For Food And Beverages Volume Share (%), by Type 2025 & 2033
- Figure 35: Europe Flavor Masking Agents For Food And Beverages Revenue (million), by Country 2025 & 2033
- Figure 36: Europe Flavor Masking Agents For Food And Beverages Volume (K), by Country 2025 & 2033
- Figure 37: Europe Flavor Masking Agents For Food And Beverages Revenue Share (%), by Country 2025 & 2033
- Figure 38: Europe Flavor Masking Agents For Food And Beverages Volume Share (%), by Country 2025 & 2033
- Figure 39: Middle East & Africa Flavor Masking Agents For Food And Beverages Revenue (million), by Application 2025 & 2033
- Figure 40: Middle East & Africa Flavor Masking Agents For Food And Beverages Volume (K), by Application 2025 & 2033
- Figure 41: Middle East & Africa Flavor Masking Agents For Food And Beverages Revenue Share (%), by Application 2025 & 2033
- Figure 42: Middle East & Africa Flavor Masking Agents For Food And Beverages Volume Share (%), by Application 2025 & 2033
- Figure 43: Middle East & Africa Flavor Masking Agents For Food And Beverages Revenue (million), by Type 2025 & 2033
- Figure 44: Middle East & Africa Flavor Masking Agents For Food And Beverages Volume (K), by Type 2025 & 2033
- Figure 45: Middle East & Africa Flavor Masking Agents For Food And Beverages Revenue Share (%), by Type 2025 & 2033
- Figure 46: Middle East & Africa Flavor Masking Agents For Food And Beverages Volume Share (%), by Type 2025 & 2033
- Figure 47: Middle East & Africa Flavor Masking Agents For Food And Beverages Revenue (million), by Country 2025 & 2033
- Figure 48: Middle East & Africa Flavor Masking Agents For Food And Beverages Volume (K), by Country 2025 & 2033
- Figure 49: Middle East & Africa Flavor Masking Agents For Food And Beverages Revenue Share (%), by Country 2025 & 2033
- Figure 50: Middle East & Africa Flavor Masking Agents For Food And Beverages Volume Share (%), by Country 2025 & 2033
- Figure 51: Asia Pacific Flavor Masking Agents For Food And Beverages Revenue (million), by Application 2025 & 2033
- Figure 52: Asia Pacific Flavor Masking Agents For Food And Beverages Volume (K), by Application 2025 & 2033
- Figure 53: Asia Pacific Flavor Masking Agents For Food And Beverages Revenue Share (%), by Application 2025 & 2033
- Figure 54: Asia Pacific Flavor Masking Agents For Food And Beverages Volume Share (%), by Application 2025 & 2033
- Figure 55: Asia Pacific Flavor Masking Agents For Food And Beverages Revenue (million), by Type 2025 & 2033
- Figure 56: Asia Pacific Flavor Masking Agents For Food And Beverages Volume (K), by Type 2025 & 2033
- Figure 57: Asia Pacific Flavor Masking Agents For Food And Beverages Revenue Share (%), by Type 2025 & 2033
- Figure 58: Asia Pacific Flavor Masking Agents For Food And Beverages Volume Share (%), by Type 2025 & 2033
- Figure 59: Asia Pacific Flavor Masking Agents For Food And Beverages Revenue (million), by Country 2025 & 2033
- Figure 60: Asia Pacific Flavor Masking Agents For Food And Beverages Volume (K), by Country 2025 & 2033
- Figure 61: Asia Pacific Flavor Masking Agents For Food And Beverages Revenue Share (%), by Country 2025 & 2033
- Figure 62: Asia Pacific Flavor Masking Agents For Food And Beverages Volume Share (%), by Country 2025 & 2033
List of Tables
- Table 1: Global Flavor Masking Agents For Food And Beverages Revenue million Forecast, by Application 2020 & 2033
- Table 2: Global Flavor Masking Agents For Food And Beverages Volume K Forecast, by Application 2020 & 2033
- Table 3: Global Flavor Masking Agents For Food And Beverages Revenue million Forecast, by Type 2020 & 2033
- Table 4: Global Flavor Masking Agents For Food And Beverages Volume K Forecast, by Type 2020 & 2033
- Table 5: Global Flavor Masking Agents For Food And Beverages Revenue million Forecast, by Region 2020 & 2033
- Table 6: Global Flavor Masking Agents For Food And Beverages Volume K Forecast, by Region 2020 & 2033
- Table 7: Global Flavor Masking Agents For Food And Beverages Revenue million Forecast, by Application 2020 & 2033
- Table 8: Global Flavor Masking Agents For Food And Beverages Volume K Forecast, by Application 2020 & 2033
- Table 9: Global Flavor Masking Agents For Food And Beverages Revenue million Forecast, by Type 2020 & 2033
- Table 10: Global Flavor Masking Agents For Food And Beverages Volume K Forecast, by Type 2020 & 2033
- Table 11: Global Flavor Masking Agents For Food And Beverages Revenue million Forecast, by Country 2020 & 2033
- Table 12: Global Flavor Masking Agents For Food And Beverages Volume K Forecast, by Country 2020 & 2033
- Table 13: United States Flavor Masking Agents For Food And Beverages Revenue (million) Forecast, by Application 2020 & 2033
- Table 14: United States Flavor Masking Agents For Food And Beverages Volume (K) Forecast, by Application 2020 & 2033
- Table 15: Canada Flavor Masking Agents For Food And Beverages Revenue (million) Forecast, by Application 2020 & 2033
- Table 16: Canada Flavor Masking Agents For Food And Beverages Volume (K) Forecast, by Application 2020 & 2033
- Table 17: Mexico Flavor Masking Agents For Food And Beverages Revenue (million) Forecast, by Application 2020 & 2033
- Table 18: Mexico Flavor Masking Agents For Food And Beverages Volume (K) Forecast, by Application 2020 & 2033
- Table 19: Global Flavor Masking Agents For Food And Beverages Revenue million Forecast, by Application 2020 & 2033
- Table 20: Global Flavor Masking Agents For Food And Beverages Volume K Forecast, by Application 2020 & 2033
- Table 21: Global Flavor Masking Agents For Food And Beverages Revenue million Forecast, by Type 2020 & 2033
- Table 22: Global Flavor Masking Agents For Food And Beverages Volume K Forecast, by Type 2020 & 2033
- Table 23: Global Flavor Masking Agents For Food And Beverages Revenue million Forecast, by Country 2020 & 2033
- Table 24: Global Flavor Masking Agents For Food And Beverages Volume K Forecast, by Country 2020 & 2033
- Table 25: Brazil Flavor Masking Agents For Food And Beverages Revenue (million) Forecast, by Application 2020 & 2033
- Table 26: Brazil Flavor Masking Agents For Food And Beverages Volume (K) Forecast, by Application 2020 & 2033
- Table 27: Argentina Flavor Masking Agents For Food And Beverages Revenue (million) Forecast, by Application 2020 & 2033
- Table 28: Argentina Flavor Masking Agents For Food And Beverages Volume (K) Forecast, by Application 2020 & 2033
- Table 29: Rest of South America Flavor Masking Agents For Food And Beverages Revenue (million) Forecast, by Application 2020 & 2033
- Table 30: Rest of South America Flavor Masking Agents For Food And Beverages Volume (K) Forecast, by Application 2020 & 2033
- Table 31: Global Flavor Masking Agents For Food And Beverages Revenue million Forecast, by Application 2020 & 2033
- Table 32: Global Flavor Masking Agents For Food And Beverages Volume K Forecast, by Application 2020 & 2033
- Table 33: Global Flavor Masking Agents For Food And Beverages Revenue million Forecast, by Type 2020 & 2033
- Table 34: Global Flavor Masking Agents For Food And Beverages Volume K Forecast, by Type 2020 & 2033
- Table 35: Global Flavor Masking Agents For Food And Beverages Revenue million Forecast, by Country 2020 & 2033
- Table 36: Global Flavor Masking Agents For Food And Beverages Volume K Forecast, by Country 2020 & 2033
- Table 37: United Kingdom Flavor Masking Agents For Food And Beverages Revenue (million) Forecast, by Application 2020 & 2033
- Table 38: United Kingdom Flavor Masking Agents For Food And Beverages Volume (K) Forecast, by Application 2020 & 2033
- Table 39: Germany Flavor Masking Agents For Food And Beverages Revenue (million) Forecast, by Application 2020 & 2033
- Table 40: Germany Flavor Masking Agents For Food And Beverages Volume (K) Forecast, by Application 2020 & 2033
- Table 41: France Flavor Masking Agents For Food And Beverages Revenue (million) Forecast, by Application 2020 & 2033
- Table 42: France Flavor Masking Agents For Food And Beverages Volume (K) Forecast, by Application 2020 & 2033
- Table 43: Italy Flavor Masking Agents For Food And Beverages Revenue (million) Forecast, by Application 2020 & 2033
- Table 44: Italy Flavor Masking Agents For Food And Beverages Volume (K) Forecast, by Application 2020 & 2033
- Table 45: Spain Flavor Masking Agents For Food And Beverages Revenue (million) Forecast, by Application 2020 & 2033
- Table 46: Spain Flavor Masking Agents For Food And Beverages Volume (K) Forecast, by Application 2020 & 2033
- Table 47: Russia Flavor Masking Agents For Food And Beverages Revenue (million) Forecast, by Application 2020 & 2033
- Table 48: Russia Flavor Masking Agents For Food And Beverages Volume (K) Forecast, by Application 2020 & 2033
- Table 49: Benelux Flavor Masking Agents For Food And Beverages Revenue (million) Forecast, by Application 2020 & 2033
- Table 50: Benelux Flavor Masking Agents For Food And Beverages Volume (K) Forecast, by Application 2020 & 2033
- Table 51: Nordics Flavor Masking Agents For Food And Beverages Revenue (million) Forecast, by Application 2020 & 2033
- Table 52: Nordics Flavor Masking Agents For Food And Beverages Volume (K) Forecast, by Application 2020 & 2033
- Table 53: Rest of Europe Flavor Masking Agents For Food And Beverages Revenue (million) Forecast, by Application 2020 & 2033
- Table 54: Rest of Europe Flavor Masking Agents For Food And Beverages Volume (K) Forecast, by Application 2020 & 2033
- Table 55: Global Flavor Masking Agents For Food And Beverages Revenue million Forecast, by Application 2020 & 2033
- Table 56: Global Flavor Masking Agents For Food And Beverages Volume K Forecast, by Application 2020 & 2033
- Table 57: Global Flavor Masking Agents For Food And Beverages Revenue million Forecast, by Type 2020 & 2033
- Table 58: Global Flavor Masking Agents For Food And Beverages Volume K Forecast, by Type 2020 & 2033
- Table 59: Global Flavor Masking Agents For Food And Beverages Revenue million Forecast, by Country 2020 & 2033
- Table 60: Global Flavor Masking Agents For Food And Beverages Volume K Forecast, by Country 2020 & 2033
- Table 61: Turkey Flavor Masking Agents For Food And Beverages Revenue (million) Forecast, by Application 2020 & 2033
- Table 62: Turkey Flavor Masking Agents For Food And Beverages Volume (K) Forecast, by Application 2020 & 2033
- Table 63: Israel Flavor Masking Agents For Food And Beverages Revenue (million) Forecast, by Application 2020 & 2033
- Table 64: Israel Flavor Masking Agents For Food And Beverages Volume (K) Forecast, by Application 2020 & 2033
- Table 65: GCC Flavor Masking Agents For Food And Beverages Revenue (million) Forecast, by Application 2020 & 2033
- Table 66: GCC Flavor Masking Agents For Food And Beverages Volume (K) Forecast, by Application 2020 & 2033
- Table 67: North Africa Flavor Masking Agents For Food And Beverages Revenue (million) Forecast, by Application 2020 & 2033
- Table 68: North Africa Flavor Masking Agents For Food And Beverages Volume (K) Forecast, by Application 2020 & 2033
- Table 69: South Africa Flavor Masking Agents For Food And Beverages Revenue (million) Forecast, by Application 2020 & 2033
- Table 70: South Africa Flavor Masking Agents For Food And Beverages Volume (K) Forecast, by Application 2020 & 2033
- Table 71: Rest of Middle East & Africa Flavor Masking Agents For Food And Beverages Revenue (million) Forecast, by Application 2020 & 2033
- Table 72: Rest of Middle East & Africa Flavor Masking Agents For Food And Beverages Volume (K) Forecast, by Application 2020 & 2033
- Table 73: Global Flavor Masking Agents For Food And Beverages Revenue million Forecast, by Application 2020 & 2033
- Table 74: Global Flavor Masking Agents For Food And Beverages Volume K Forecast, by Application 2020 & 2033
- Table 75: Global Flavor Masking Agents For Food And Beverages Revenue million Forecast, by Type 2020 & 2033
- Table 76: Global Flavor Masking Agents For Food And Beverages Volume K Forecast, by Type 2020 & 2033
- Table 77: Global Flavor Masking Agents For Food And Beverages Revenue million Forecast, by Country 2020 & 2033
- Table 78: Global Flavor Masking Agents For Food And Beverages Volume K Forecast, by Country 2020 & 2033
- Table 79: China Flavor Masking Agents For Food And Beverages Revenue (million) Forecast, by Application 2020 & 2033
- Table 80: China Flavor Masking Agents For Food And Beverages Volume (K) Forecast, by Application 2020 & 2033
- Table 81: India Flavor Masking Agents For Food And Beverages Revenue (million) Forecast, by Application 2020 & 2033
- Table 82: India Flavor Masking Agents For Food And Beverages Volume (K) Forecast, by Application 2020 & 2033
- Table 83: Japan Flavor Masking Agents For Food And Beverages Revenue (million) Forecast, by Application 2020 & 2033
- Table 84: Japan Flavor Masking Agents For Food And Beverages Volume (K) Forecast, by Application 2020 & 2033
- Table 85: South Korea Flavor Masking Agents For Food And Beverages Revenue (million) Forecast, by Application 2020 & 2033
- Table 86: South Korea Flavor Masking Agents For Food And Beverages Volume (K) Forecast, by Application 2020 & 2033
- Table 87: ASEAN Flavor Masking Agents For Food And Beverages Revenue (million) Forecast, by Application 2020 & 2033
- Table 88: ASEAN Flavor Masking Agents For Food And Beverages Volume (K) Forecast, by Application 2020 & 2033
- Table 89: Oceania Flavor Masking Agents For Food And Beverages Revenue (million) Forecast, by Application 2020 & 2033
- Table 90: Oceania Flavor Masking Agents For Food And Beverages Volume (K) Forecast, by Application 2020 & 2033
- Table 91: Rest of Asia Pacific Flavor Masking Agents For Food And Beverages Revenue (million) Forecast, by Application 2020 & 2033
- Table 92: Rest of Asia Pacific Flavor Masking Agents For Food And Beverages Volume (K) Forecast, by Application 2020 & 2033
Frequently Asked Questions
1. What is the projected Compound Annual Growth Rate (CAGR) of the Flavor Masking Agents For Food And Beverages?
The projected CAGR is approximately XXX%.
2. Which companies are prominent players in the Flavor Masking Agents For Food And Beverages?
Key companies in the market include Synergy Flavor, Firmenich International, Carmi Flavor & Fragrance, Archer-Daniels-Midland, Kerry Group, Tate & Lyle, Virginia Dare Extract, Sensient Technologies, GEO Specialty Chemicals, Koninklijke, ADM, Cargill, Incorporated, Keva Flavours Pvt. Ltd, Roquette Freres.
3. What are the main segments of the Flavor Masking Agents For Food And Beverages?
The market segments include Application, Type.
4. Can you provide details about the market size?
The market size is estimated to be USD XXX million as of 2022.
5. What are some drivers contributing to market growth?
N/A
6. What are the notable trends driving market growth?
N/A
7. Are there any restraints impacting market growth?
N/A
8. Can you provide examples of recent developments in the market?
N/A
9. What pricing options are available for accessing the report?
Pricing options include single-user, multi-user, and enterprise licenses priced at USD 3950.00, USD 5925.00, and USD 7900.00 respectively.
10. Is the market size provided in terms of value or volume?
The market size is provided in terms of value, measured in million and volume, measured in K.
11. Are there any specific market keywords associated with the report?
Yes, the market keyword associated with the report is "Flavor Masking Agents For Food And Beverages," which aids in identifying and referencing the specific market segment covered.
12. How do I determine which pricing option suits my needs best?
The pricing options vary based on user requirements and access needs. Individual users may opt for single-user licenses, while businesses requiring broader access may choose multi-user or enterprise licenses for cost-effective access to the report.
13. Are there any additional resources or data provided in the Flavor Masking Agents For Food And Beverages report?
While the report offers comprehensive insights, it's advisable to review the specific contents or supplementary materials provided to ascertain if additional resources or data are available.
14. How can I stay updated on further developments or reports in the Flavor Masking Agents For Food And Beverages?
To stay informed about further developments, trends, and reports in the Flavor Masking Agents For Food And Beverages, consider subscribing to industry newsletters, following relevant companies and organizations, or regularly checking reputable industry news sources and publications.
Methodology
Step 1 - Identification of Relevant Samples Size from Population Database


Step 2 - Approaches for Defining Global Market Size (Value, Volume* & Price*)

Note*: In applicable scenarios
Step 3 - Data Sources
Primary Research
- Web Analytics
- Survey Reports
- Research Institute
- Latest Research Reports
- Opinion Leaders
Secondary Research
- Annual Reports
- White Paper
- Latest Press Release
- Industry Association
- Paid Database
- Investor Presentations

Step 4 - Data Triangulation
Involves using different sources of information in order to increase the validity of a study
These sources are likely to be stakeholders in a program - participants, other researchers, program staff, other community members, and so on.
Then we put all data in single framework & apply various statistical tools to find out the dynamic on the market.
During the analysis stage, feedback from the stakeholder groups would be compared to determine areas of agreement as well as areas of divergence