

Key Insights
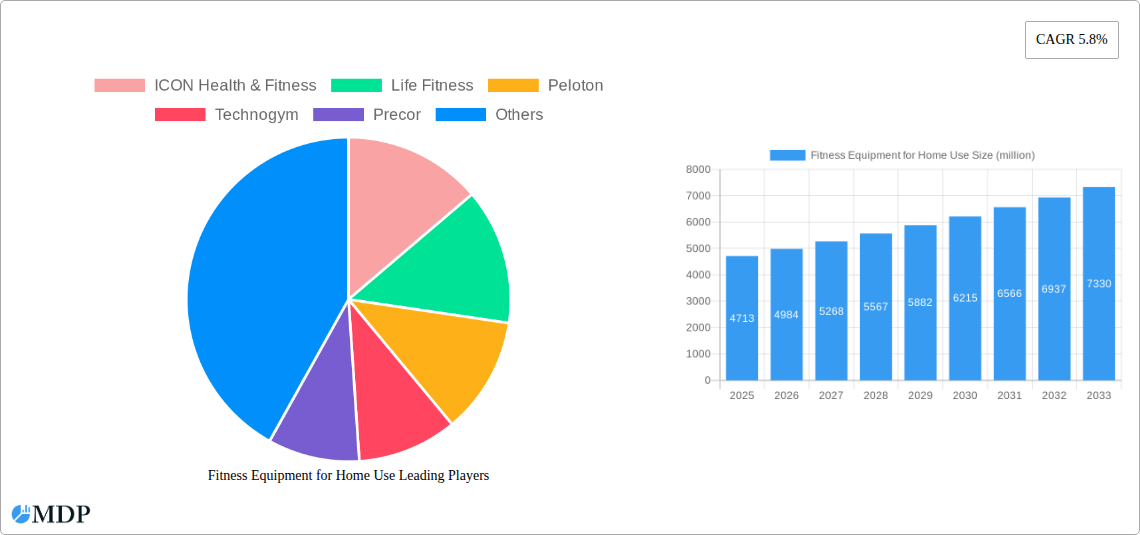
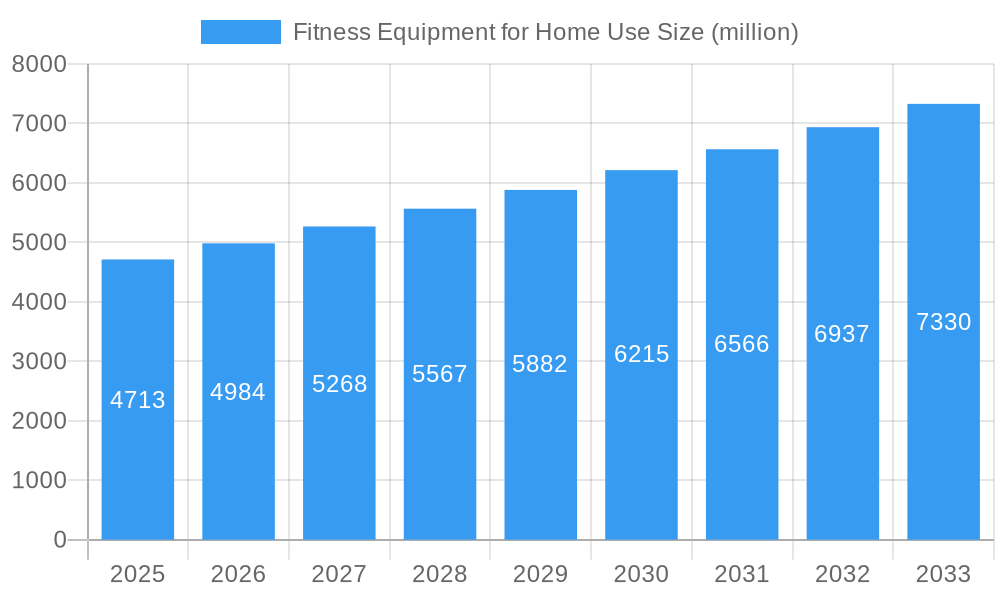
The global market for fitness equipment for home use is poised for significant expansion, currently valued at approximately $4.71 billion in 2025 and projected to grow at a robust Compound Annual Growth Rate (CAGR) of 5.8% through 2033. This impressive trajectory is fueled by a confluence of evolving consumer lifestyles and a growing emphasis on personal well-being. Key drivers include the increasing adoption of health-conscious habits, a desire for convenience and privacy in fitness routines, and the surge in popularity of connected fitness solutions. The COVID-19 pandemic acted as a significant catalyst, permanently shifting consumer preferences towards home-based workouts and leading to sustained demand for a diverse range of fitness equipment. Technological advancements, such as smart connectivity, personalized training programs, and interactive features, are further enhancing user engagement and driving market growth. The market encompasses a broad spectrum of applications, with "Private Use" dominating due to its widespread appeal to individuals seeking flexible fitness options. "Community Use," while smaller, represents an emerging segment as communal living spaces and recreational centers invest in shared fitness facilities.
Fitness Equipment for Home Use Market Size (In Billion)
The diverse product landscape within the home fitness equipment market is characterized by a variety of popular types, each catering to different fitness needs and preferences. Treadmills and exercise bikes remain perennial favorites, offering effective cardiovascular training, while elliptical trainers provide a low-impact full-body workout. Rowing machines are gaining traction for their comprehensive muscle engagement, and strength training equipment is essential for building muscle mass and improving overall physical conditioning. The "Others" category, encompassing a wide array of specialized equipment, also contributes to market dynamism. Geographically, North America currently holds a leading position, driven by high disposable incomes and a deeply ingrained fitness culture. However, the Asia Pacific region is expected to witness the fastest growth, propelled by rising urbanization, increasing health awareness, and a burgeoning middle class. Companies like ICON Health & Fitness, Life Fitness, and Peloton are at the forefront of this market, innovating with connected devices and premium experiences that resonate with consumers. While the market exhibits strong growth potential, potential restraints such as high initial costs for some advanced equipment and limited living spaces in certain urban areas need to be carefully navigated by manufacturers and marketers.
Fitness Equipment for Home Use Company Market Share
Unlocking Home Fitness: A Comprehensive Market Report 2019-2033
This in-depth report provides a definitive analysis of the global Fitness Equipment for Home Use Market, offering unparalleled insights into market dynamics, growth drivers, and future trajectory. With a comprehensive study period spanning 2019-2033, a base year of 2025, and an extensive forecast period from 2025-2033, this report equips industry stakeholders, investors, and strategic planners with the actionable intelligence needed to thrive in this rapidly evolving sector. The report meticulously examines key segments such as Private Use and Community Use, and product categories including Treadmill, Exercise Bike, Elliptical, Rower, Strength Equipment, and Others. Discover the latest Industry Developments that are reshaping the home fitness landscape.
Fitness Equipment for Home Use Market Dynamics & Concentration
The Fitness Equipment for Home Use Market exhibits a moderate to high concentration, with a significant portion of the market share held by a few key players. Leading companies like ICON Health & Fitness, Life Fitness, Peloton, Technogym, Precor, and Nautilus are at the forefront of innovation and market penetration. M&A activities have played a crucial role in shaping this landscape, with an estimated XX deal counts observed during the historical period. For instance, the acquisition of XX by XX in 20XX significantly altered market dynamics. Innovation drivers are primarily fueled by increasing consumer demand for convenient and accessible fitness solutions, coupled with advancements in smart technology and connected fitness experiences. Regulatory frameworks, while generally supportive of health and wellness, can influence product safety standards and material sourcing. Product substitutes, such as outdoor activities and digital fitness apps, present a continuous challenge, though the demand for dedicated home equipment remains robust. End-user trends are strongly influenced by a growing awareness of personal health, the desire for customizable workout routines, and the increasing prevalence of remote work, which necessitates effective home-based fitness solutions.
Fitness Equipment for Home Use Industry Trends & Analysis
The Fitness Equipment for Home Use Market is poised for significant expansion, driven by a confluence of powerful trends. The projected Compound Annual Growth Rate (CAGR) for the forecast period (2025–2033) is estimated at XX%, indicating robust and sustained growth. Market penetration is steadily increasing, particularly in developed economies where disposable incomes are higher and health consciousness is paramount. Technological disruptions are a defining characteristic of this market. The integration of smart features, AI-powered coaching, virtual reality (VR) and augmented reality (AR) integrated workouts, and seamless connectivity are transforming traditional exercise equipment into immersive, personalized fitness hubs. Companies like Peloton have revolutionized the market with their connected fitness ecosystem, fostering a sense of community and engagement among users. Consumer preferences are shifting towards aesthetically pleasing, space-saving, and multi-functional equipment that can adapt to diverse home environments. There's also a growing demand for equipment that offers advanced data tracking and performance analytics, allowing users to monitor progress and optimize their training. The competitive dynamics are intensifying, with both established giants and agile startups vying for market share. This fierce competition is spurring continuous product development and innovation, leading to more advanced and user-centric offerings. The rise of direct-to-consumer (DTC) sales models has further democratized access to premium fitness equipment, expanding the market's reach. Furthermore, the increasing emphasis on preventive healthcare and the long-term benefits of regular exercise are solidifying the demand for home fitness solutions. The post-pandemic era has cemented the importance of home-based fitness, with many consumers continuing to prioritize convenience and control over their workout routines. This sustained demand, coupled with ongoing technological advancements and evolving consumer needs, paints a highly optimistic picture for the Fitness Equipment for Home Use Market.
Leading Markets & Segments in Fitness Equipment for Home Use
The Private Use segment currently dominates the Fitness Equipment for Home Use Market, driven by increasing disposable incomes and a growing emphasis on personal health and wellness among individuals and households globally. This segment is projected to maintain its leadership throughout the forecast period. Within product types, the Treadmill segment is a consistent high-performer, followed closely by Exercise Bikes and Ellipticals. The Strength Equipment segment is also experiencing significant growth, fueled by consumer interest in building muscle mass and improving overall physical conditioning.
- Dominant Region: North America, particularly the United States, stands as the leading market for fitness equipment for home use. This dominance is attributable to a high adoption rate of advanced fitness technologies, strong purchasing power, and a deeply ingrained health and fitness culture. Economic policies that support consumer spending and robust e-commerce infrastructure further bolster this leadership.
- Key Drivers for Private Use:
- Health Consciousness: A heightened awareness of health benefits and disease prevention.
- Convenience: The desire for flexible workout schedules and the elimination of commute times to gyms.
- Technological Integration: Demand for smart, connected fitness equipment offering personalized experiences.
- Productivity Gains: The rise of remote work has created more opportunities and a need for home-based fitness solutions.
- Dominance of Treadmills: Treadmills remain a staple due to their comprehensive cardiovascular workout capabilities and the ability to simulate outdoor running environments. Their market presence is further strengthened by continuous innovation in features like incline, speed control, and integrated entertainment systems.
- Growth in Strength Equipment: The increasing popularity of strength training for both aesthetic and functional fitness goals is driving significant growth in the strength equipment segment. This includes advancements in smart weight machines and versatile home gym systems.
- Emerging Markets: While North America leads, the Asia Pacific region, particularly China and India, is emerging as a significant growth area due to a rapidly expanding middle class and increasing health awareness.
Fitness Equipment for Home Use Product Developments
Product developments in the Fitness Equipment for Home Use Market are heavily skewed towards smart and connected technologies. Innovations include AI-powered personalized training programs, real-time performance feedback through advanced sensors, and immersive VR/AR experiences that transform workouts into engaging virtual journeys. Manufacturers are focusing on creating aesthetically pleasing, space-saving, and multi-functional equipment that seamlessly integrates into modern homes. The competitive advantage lies in offering unique user experiences, comprehensive data analytics, and seamless integration with popular fitness apps and platforms, catering to the evolving demands of health-conscious consumers.
Key Drivers of Fitness Equipment for Home Use Growth
The Fitness Equipment for Home Use Market is propelled by several key drivers. Technologically, the integration of smart features, AI, and connectivity is creating more engaging and personalized workout experiences. Economically, rising disposable incomes and a growing middle class in emerging economies are expanding the consumer base. Regulatory factors, such as government initiatives promoting public health and wellness, also contribute indirectly by fostering a culture of fitness. Furthermore, the increasing prevalence of chronic lifestyle diseases is driving individuals to adopt proactive health measures, including regular home exercise.
Challenges in the Fitness Equipment for Home Use Market
Despite robust growth, the Fitness Equipment for Home Use Market faces several challenges. High upfront costs for premium equipment can be a barrier for some consumers. Intense competition from both established brands and new entrants necessitates continuous innovation, which can be resource-intensive. Supply chain disruptions, as witnessed globally in recent years, can impact manufacturing and delivery timelines. Regulatory hurdles related to product safety standards and data privacy for connected devices also require careful navigation. Market saturation in certain product categories in developed regions can also present a challenge, requiring strategic differentiation.
Emerging Opportunities in Fitness Equipment for Home Use
Emerging opportunities in the Fitness Equipment for Home Use Market are abundant. The continued growth of the digital fitness ecosystem presents significant potential for integrated hardware and software solutions. Strategic partnerships between equipment manufacturers, content providers, and health insurance companies can create lucrative bundled offerings. Market expansion into underserved regions with rising disposable incomes and increasing health consciousness offers substantial long-term growth. Furthermore, the development of sustainable and eco-friendly fitness equipment is an emerging trend that can capture a niche but growing market segment.
Leading Players in the Fitness Equipment for Home Use Sector
- ICON Health & Fitness
- Life Fitness
- Peloton
- Technogym
- Precor
- Nautilus
- Johnson Health Tech
- Dyaco
- Impulse
- Shuhua Sports
- True Fitness
- Shanxi Orient
- WaterRower
- WNQ Fitness
- BH Fitness
- Concept2
- Landice
Key Milestones in Fitness Equipment for Home Use Industry
- 2019: Increased adoption of AI-powered personalized workout plans.
- 2020: Surge in demand for home fitness equipment due to global lockdowns.
- 2021: Significant growth in connected fitness subscriptions and virtual classes.
- 2022: Introduction of advanced VR/AR integrated fitness experiences.
- 2023: Focus on space-saving and multi-functional home gym solutions.
- 2024: Growing emphasis on sustainability and eco-friendly materials in manufacturing.
Strategic Outlook for Fitness Equipment for Home Use Market
The strategic outlook for the Fitness Equipment for Home Use Market is exceptionally positive, characterized by sustained growth accelerators. The increasing integration of advanced technologies like AI, VR, and AR will continue to drive innovation and user engagement. The expanding global middle class, coupled with a persistent focus on health and wellness, provides a fertile ground for market penetration. Strategic partnerships and the development of comprehensive connected fitness ecosystems will be crucial for capturing and retaining market share. Companies that prioritize user experience, data-driven insights, and adaptable product offerings will be best positioned to capitalize on the significant future market potential.
Fitness Equipment for Home Use Segmentation
-
1. Application
- 1.1. Private Use
- 1.2. Community Use
-
2. Types
- 2.1. Treadmill
- 2.2. Exercise Bike
- 2.3. Elliptical
- 2.4. Rower
- 2.5. Strength Equipment
- 2.6. Others
Fitness Equipment for Home Use Segmentation By Geography
-
1. North America
- 1.1. United States
- 1.2. Canada
- 1.3. Mexico
-
2. South America
- 2.1. Brazil
- 2.2. Argentina
- 2.3. Rest of South America
-
3. Europe
- 3.1. United Kingdom
- 3.2. Germany
- 3.3. France
- 3.4. Italy
- 3.5. Spain
- 3.6. Russia
- 3.7. Benelux
- 3.8. Nordics
- 3.9. Rest of Europe
-
4. Middle East & Africa
- 4.1. Turkey
- 4.2. Israel
- 4.3. GCC
- 4.4. North Africa
- 4.5. South Africa
- 4.6. Rest of Middle East & Africa
-
5. Asia Pacific
- 5.1. China
- 5.2. India
- 5.3. Japan
- 5.4. South Korea
- 5.5. ASEAN
- 5.6. Oceania
- 5.7. Rest of Asia Pacific
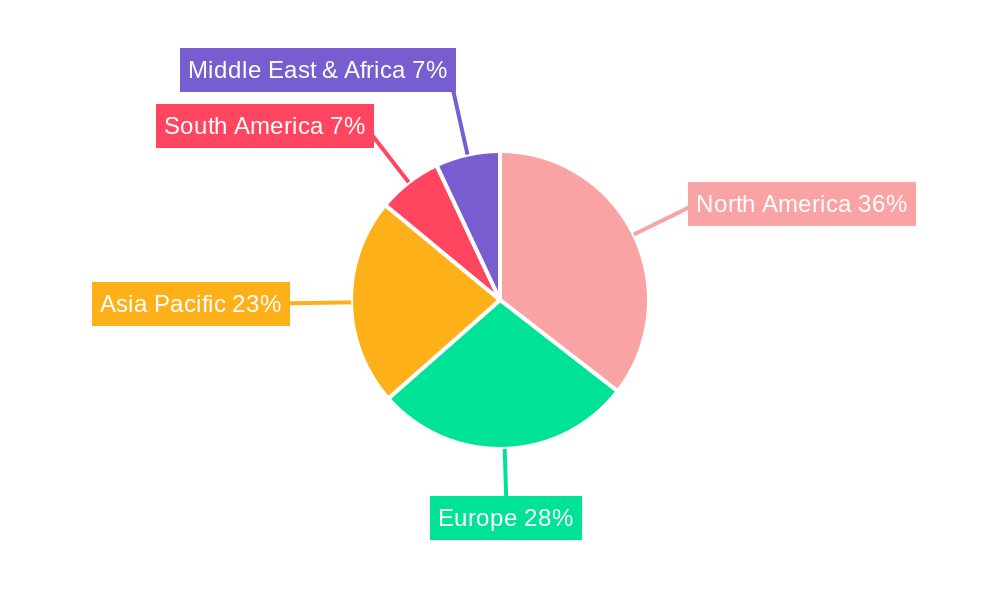
Fitness Equipment for Home Use Regional Market Share
Geographic Coverage of Fitness Equipment for Home Use
Fitness Equipment for Home Use REPORT HIGHLIGHTS
| Aspects | Details |
|---|---|
| Study Period | 2020-2034 |
| Base Year | 2025 |
| Estimated Year | 2026 |
| Forecast Period | 2026-2034 |
| Historical Period | 2020-2025 |
| Growth Rate | CAGR of 5.8% from 2020-2034 |
| Segmentation |
|
Table of Contents
- 1. Introduction
- 1.1. Research Scope
- 1.2. Market Segmentation
- 1.3. Research Methodology
- 1.4. Definitions and Assumptions
- 2. Executive Summary
- 2.1. Introduction
- 3. Market Dynamics
- 3.1. Introduction
- 3.2. Market Drivers
- 3.3. Market Restrains
- 3.4. Market Trends
- 4. Market Factor Analysis
- 4.1. Porters Five Forces
- 4.2. Supply/Value Chain
- 4.3. PESTEL analysis
- 4.4. Market Entropy
- 4.5. Patent/Trademark Analysis
- 5. Global Fitness Equipment for Home Use Analysis, Insights and Forecast, 2020-2032
- 5.1. Market Analysis, Insights and Forecast - by Application
- 5.1.1. Private Use
- 5.1.2. Community Use
- 5.2. Market Analysis, Insights and Forecast - by Types
- 5.2.1. Treadmill
- 5.2.2. Exercise Bike
- 5.2.3. Elliptical
- 5.2.4. Rower
- 5.2.5. Strength Equipment
- 5.2.6. Others
- 5.3. Market Analysis, Insights and Forecast - by Region
- 5.3.1. North America
- 5.3.2. South America
- 5.3.3. Europe
- 5.3.4. Middle East & Africa
- 5.3.5. Asia Pacific
- 5.1. Market Analysis, Insights and Forecast - by Application
- 6. North America Fitness Equipment for Home Use Analysis, Insights and Forecast, 2020-2032
- 6.1. Market Analysis, Insights and Forecast - by Application
- 6.1.1. Private Use
- 6.1.2. Community Use
- 6.2. Market Analysis, Insights and Forecast - by Types
- 6.2.1. Treadmill
- 6.2.2. Exercise Bike
- 6.2.3. Elliptical
- 6.2.4. Rower
- 6.2.5. Strength Equipment
- 6.2.6. Others
- 6.1. Market Analysis, Insights and Forecast - by Application
- 7. South America Fitness Equipment for Home Use Analysis, Insights and Forecast, 2020-2032
- 7.1. Market Analysis, Insights and Forecast - by Application
- 7.1.1. Private Use
- 7.1.2. Community Use
- 7.2. Market Analysis, Insights and Forecast - by Types
- 7.2.1. Treadmill
- 7.2.2. Exercise Bike
- 7.2.3. Elliptical
- 7.2.4. Rower
- 7.2.5. Strength Equipment
- 7.2.6. Others
- 7.1. Market Analysis, Insights and Forecast - by Application
- 8. Europe Fitness Equipment for Home Use Analysis, Insights and Forecast, 2020-2032
- 8.1. Market Analysis, Insights and Forecast - by Application
- 8.1.1. Private Use
- 8.1.2. Community Use
- 8.2. Market Analysis, Insights and Forecast - by Types
- 8.2.1. Treadmill
- 8.2.2. Exercise Bike
- 8.2.3. Elliptical
- 8.2.4. Rower
- 8.2.5. Strength Equipment
- 8.2.6. Others
- 8.1. Market Analysis, Insights and Forecast - by Application
- 9. Middle East & Africa Fitness Equipment for Home Use Analysis, Insights and Forecast, 2020-2032
- 9.1. Market Analysis, Insights and Forecast - by Application
- 9.1.1. Private Use
- 9.1.2. Community Use
- 9.2. Market Analysis, Insights and Forecast - by Types
- 9.2.1. Treadmill
- 9.2.2. Exercise Bike
- 9.2.3. Elliptical
- 9.2.4. Rower
- 9.2.5. Strength Equipment
- 9.2.6. Others
- 9.1. Market Analysis, Insights and Forecast - by Application
- 10. Asia Pacific Fitness Equipment for Home Use Analysis, Insights and Forecast, 2020-2032
- 10.1. Market Analysis, Insights and Forecast - by Application
- 10.1.1. Private Use
- 10.1.2. Community Use
- 10.2. Market Analysis, Insights and Forecast - by Types
- 10.2.1. Treadmill
- 10.2.2. Exercise Bike
- 10.2.3. Elliptical
- 10.2.4. Rower
- 10.2.5. Strength Equipment
- 10.2.6. Others
- 10.1. Market Analysis, Insights and Forecast - by Application
- 11. Competitive Analysis
- 11.1. Global Market Share Analysis 2025
- 11.2. Company Profiles
- 11.2.1 ICON Health & Fitness
- 11.2.1.1. Overview
- 11.2.1.2. Products
- 11.2.1.3. SWOT Analysis
- 11.2.1.4. Recent Developments
- 11.2.1.5. Financials (Based on Availability)
- 11.2.2 Life Fitness
- 11.2.2.1. Overview
- 11.2.2.2. Products
- 11.2.2.3. SWOT Analysis
- 11.2.2.4. Recent Developments
- 11.2.2.5. Financials (Based on Availability)
- 11.2.3 Peloton
- 11.2.3.1. Overview
- 11.2.3.2. Products
- 11.2.3.3. SWOT Analysis
- 11.2.3.4. Recent Developments
- 11.2.3.5. Financials (Based on Availability)
- 11.2.4 Technogym
- 11.2.4.1. Overview
- 11.2.4.2. Products
- 11.2.4.3. SWOT Analysis
- 11.2.4.4. Recent Developments
- 11.2.4.5. Financials (Based on Availability)
- 11.2.5 Precor
- 11.2.5.1. Overview
- 11.2.5.2. Products
- 11.2.5.3. SWOT Analysis
- 11.2.5.4. Recent Developments
- 11.2.5.5. Financials (Based on Availability)
- 11.2.6 Nautilus
- 11.2.6.1. Overview
- 11.2.6.2. Products
- 11.2.6.3. SWOT Analysis
- 11.2.6.4. Recent Developments
- 11.2.6.5. Financials (Based on Availability)
- 11.2.7 Johnson Health Tech
- 11.2.7.1. Overview
- 11.2.7.2. Products
- 11.2.7.3. SWOT Analysis
- 11.2.7.4. Recent Developments
- 11.2.7.5. Financials (Based on Availability)
- 11.2.8 Dyaco
- 11.2.8.1. Overview
- 11.2.8.2. Products
- 11.2.8.3. SWOT Analysis
- 11.2.8.4. Recent Developments
- 11.2.8.5. Financials (Based on Availability)
- 11.2.9 Impulse
- 11.2.9.1. Overview
- 11.2.9.2. Products
- 11.2.9.3. SWOT Analysis
- 11.2.9.4. Recent Developments
- 11.2.9.5. Financials (Based on Availability)
- 11.2.10 Shuhua Sports
- 11.2.10.1. Overview
- 11.2.10.2. Products
- 11.2.10.3. SWOT Analysis
- 11.2.10.4. Recent Developments
- 11.2.10.5. Financials (Based on Availability)
- 11.2.11 True Fitness
- 11.2.11.1. Overview
- 11.2.11.2. Products
- 11.2.11.3. SWOT Analysis
- 11.2.11.4. Recent Developments
- 11.2.11.5. Financials (Based on Availability)
- 11.2.12 Shanxi Orient
- 11.2.12.1. Overview
- 11.2.12.2. Products
- 11.2.12.3. SWOT Analysis
- 11.2.12.4. Recent Developments
- 11.2.12.5. Financials (Based on Availability)
- 11.2.13 WaterRower
- 11.2.13.1. Overview
- 11.2.13.2. Products
- 11.2.13.3. SWOT Analysis
- 11.2.13.4. Recent Developments
- 11.2.13.5. Financials (Based on Availability)
- 11.2.14 WNQ Fitness
- 11.2.14.1. Overview
- 11.2.14.2. Products
- 11.2.14.3. SWOT Analysis
- 11.2.14.4. Recent Developments
- 11.2.14.5. Financials (Based on Availability)
- 11.2.15 BH Fitness
- 11.2.15.1. Overview
- 11.2.15.2. Products
- 11.2.15.3. SWOT Analysis
- 11.2.15.4. Recent Developments
- 11.2.15.5. Financials (Based on Availability)
- 11.2.16 Concept2
- 11.2.16.1. Overview
- 11.2.16.2. Products
- 11.2.16.3. SWOT Analysis
- 11.2.16.4. Recent Developments
- 11.2.16.5. Financials (Based on Availability)
- 11.2.17 Landice
- 11.2.17.1. Overview
- 11.2.17.2. Products
- 11.2.17.3. SWOT Analysis
- 11.2.17.4. Recent Developments
- 11.2.17.5. Financials (Based on Availability)
- 11.2.1 ICON Health & Fitness
List of Figures
- Figure 1: Global Fitness Equipment for Home Use Revenue Breakdown (million, %) by Region 2025 & 2033
- Figure 2: North America Fitness Equipment for Home Use Revenue (million), by Application 2025 & 2033
- Figure 3: North America Fitness Equipment for Home Use Revenue Share (%), by Application 2025 & 2033
- Figure 4: North America Fitness Equipment for Home Use Revenue (million), by Types 2025 & 2033
- Figure 5: North America Fitness Equipment for Home Use Revenue Share (%), by Types 2025 & 2033
- Figure 6: North America Fitness Equipment for Home Use Revenue (million), by Country 2025 & 2033
- Figure 7: North America Fitness Equipment for Home Use Revenue Share (%), by Country 2025 & 2033
- Figure 8: South America Fitness Equipment for Home Use Revenue (million), by Application 2025 & 2033
- Figure 9: South America Fitness Equipment for Home Use Revenue Share (%), by Application 2025 & 2033
- Figure 10: South America Fitness Equipment for Home Use Revenue (million), by Types 2025 & 2033
- Figure 11: South America Fitness Equipment for Home Use Revenue Share (%), by Types 2025 & 2033
- Figure 12: South America Fitness Equipment for Home Use Revenue (million), by Country 2025 & 2033
- Figure 13: South America Fitness Equipment for Home Use Revenue Share (%), by Country 2025 & 2033
- Figure 14: Europe Fitness Equipment for Home Use Revenue (million), by Application 2025 & 2033
- Figure 15: Europe Fitness Equipment for Home Use Revenue Share (%), by Application 2025 & 2033
- Figure 16: Europe Fitness Equipment for Home Use Revenue (million), by Types 2025 & 2033
- Figure 17: Europe Fitness Equipment for Home Use Revenue Share (%), by Types 2025 & 2033
- Figure 18: Europe Fitness Equipment for Home Use Revenue (million), by Country 2025 & 2033
- Figure 19: Europe Fitness Equipment for Home Use Revenue Share (%), by Country 2025 & 2033
- Figure 20: Middle East & Africa Fitness Equipment for Home Use Revenue (million), by Application 2025 & 2033
- Figure 21: Middle East & Africa Fitness Equipment for Home Use Revenue Share (%), by Application 2025 & 2033
- Figure 22: Middle East & Africa Fitness Equipment for Home Use Revenue (million), by Types 2025 & 2033
- Figure 23: Middle East & Africa Fitness Equipment for Home Use Revenue Share (%), by Types 2025 & 2033
- Figure 24: Middle East & Africa Fitness Equipment for Home Use Revenue (million), by Country 2025 & 2033
- Figure 25: Middle East & Africa Fitness Equipment for Home Use Revenue Share (%), by Country 2025 & 2033
- Figure 26: Asia Pacific Fitness Equipment for Home Use Revenue (million), by Application 2025 & 2033
- Figure 27: Asia Pacific Fitness Equipment for Home Use Revenue Share (%), by Application 2025 & 2033
- Figure 28: Asia Pacific Fitness Equipment for Home Use Revenue (million), by Types 2025 & 2033
- Figure 29: Asia Pacific Fitness Equipment for Home Use Revenue Share (%), by Types 2025 & 2033
- Figure 30: Asia Pacific Fitness Equipment for Home Use Revenue (million), by Country 2025 & 2033
- Figure 31: Asia Pacific Fitness Equipment for Home Use Revenue Share (%), by Country 2025 & 2033
List of Tables
- Table 1: Global Fitness Equipment for Home Use Revenue million Forecast, by Application 2020 & 2033
- Table 2: Global Fitness Equipment for Home Use Revenue million Forecast, by Types 2020 & 2033
- Table 3: Global Fitness Equipment for Home Use Revenue million Forecast, by Region 2020 & 2033
- Table 4: Global Fitness Equipment for Home Use Revenue million Forecast, by Application 2020 & 2033
- Table 5: Global Fitness Equipment for Home Use Revenue million Forecast, by Types 2020 & 2033
- Table 6: Global Fitness Equipment for Home Use Revenue million Forecast, by Country 2020 & 2033
- Table 7: United States Fitness Equipment for Home Use Revenue (million) Forecast, by Application 2020 & 2033
- Table 8: Canada Fitness Equipment for Home Use Revenue (million) Forecast, by Application 2020 & 2033
- Table 9: Mexico Fitness Equipment for Home Use Revenue (million) Forecast, by Application 2020 & 2033
- Table 10: Global Fitness Equipment for Home Use Revenue million Forecast, by Application 2020 & 2033
- Table 11: Global Fitness Equipment for Home Use Revenue million Forecast, by Types 2020 & 2033
- Table 12: Global Fitness Equipment for Home Use Revenue million Forecast, by Country 2020 & 2033
- Table 13: Brazil Fitness Equipment for Home Use Revenue (million) Forecast, by Application 2020 & 2033
- Table 14: Argentina Fitness Equipment for Home Use Revenue (million) Forecast, by Application 2020 & 2033
- Table 15: Rest of South America Fitness Equipment for Home Use Revenue (million) Forecast, by Application 2020 & 2033
- Table 16: Global Fitness Equipment for Home Use Revenue million Forecast, by Application 2020 & 2033
- Table 17: Global Fitness Equipment for Home Use Revenue million Forecast, by Types 2020 & 2033
- Table 18: Global Fitness Equipment for Home Use Revenue million Forecast, by Country 2020 & 2033
- Table 19: United Kingdom Fitness Equipment for Home Use Revenue (million) Forecast, by Application 2020 & 2033
- Table 20: Germany Fitness Equipment for Home Use Revenue (million) Forecast, by Application 2020 & 2033
- Table 21: France Fitness Equipment for Home Use Revenue (million) Forecast, by Application 2020 & 2033
- Table 22: Italy Fitness Equipment for Home Use Revenue (million) Forecast, by Application 2020 & 2033
- Table 23: Spain Fitness Equipment for Home Use Revenue (million) Forecast, by Application 2020 & 2033
- Table 24: Russia Fitness Equipment for Home Use Revenue (million) Forecast, by Application 2020 & 2033
- Table 25: Benelux Fitness Equipment for Home Use Revenue (million) Forecast, by Application 2020 & 2033
- Table 26: Nordics Fitness Equipment for Home Use Revenue (million) Forecast, by Application 2020 & 2033
- Table 27: Rest of Europe Fitness Equipment for Home Use Revenue (million) Forecast, by Application 2020 & 2033
- Table 28: Global Fitness Equipment for Home Use Revenue million Forecast, by Application 2020 & 2033
- Table 29: Global Fitness Equipment for Home Use Revenue million Forecast, by Types 2020 & 2033
- Table 30: Global Fitness Equipment for Home Use Revenue million Forecast, by Country 2020 & 2033
- Table 31: Turkey Fitness Equipment for Home Use Revenue (million) Forecast, by Application 2020 & 2033
- Table 32: Israel Fitness Equipment for Home Use Revenue (million) Forecast, by Application 2020 & 2033
- Table 33: GCC Fitness Equipment for Home Use Revenue (million) Forecast, by Application 2020 & 2033
- Table 34: North Africa Fitness Equipment for Home Use Revenue (million) Forecast, by Application 2020 & 2033
- Table 35: South Africa Fitness Equipment for Home Use Revenue (million) Forecast, by Application 2020 & 2033
- Table 36: Rest of Middle East & Africa Fitness Equipment for Home Use Revenue (million) Forecast, by Application 2020 & 2033
- Table 37: Global Fitness Equipment for Home Use Revenue million Forecast, by Application 2020 & 2033
- Table 38: Global Fitness Equipment for Home Use Revenue million Forecast, by Types 2020 & 2033
- Table 39: Global Fitness Equipment for Home Use Revenue million Forecast, by Country 2020 & 2033
- Table 40: China Fitness Equipment for Home Use Revenue (million) Forecast, by Application 2020 & 2033
- Table 41: India Fitness Equipment for Home Use Revenue (million) Forecast, by Application 2020 & 2033
- Table 42: Japan Fitness Equipment for Home Use Revenue (million) Forecast, by Application 2020 & 2033
- Table 43: South Korea Fitness Equipment for Home Use Revenue (million) Forecast, by Application 2020 & 2033
- Table 44: ASEAN Fitness Equipment for Home Use Revenue (million) Forecast, by Application 2020 & 2033
- Table 45: Oceania Fitness Equipment for Home Use Revenue (million) Forecast, by Application 2020 & 2033
- Table 46: Rest of Asia Pacific Fitness Equipment for Home Use Revenue (million) Forecast, by Application 2020 & 2033
Frequently Asked Questions
1. What is the projected Compound Annual Growth Rate (CAGR) of the Fitness Equipment for Home Use?
The projected CAGR is approximately 5.8%.
2. Which companies are prominent players in the Fitness Equipment for Home Use?
Key companies in the market include ICON Health & Fitness, Life Fitness, Peloton, Technogym, Precor, Nautilus, Johnson Health Tech, Dyaco, Impulse, Shuhua Sports, True Fitness, Shanxi Orient, WaterRower, WNQ Fitness, BH Fitness, Concept2, Landice.
3. What are the main segments of the Fitness Equipment for Home Use?
The market segments include Application, Types.
4. Can you provide details about the market size?
The market size is estimated to be USD 4713 million as of 2022.
5. What are some drivers contributing to market growth?
N/A
6. What are the notable trends driving market growth?
N/A
7. Are there any restraints impacting market growth?
N/A
8. Can you provide examples of recent developments in the market?
N/A
9. What pricing options are available for accessing the report?
Pricing options include single-user, multi-user, and enterprise licenses priced at USD 4900.00, USD 7350.00, and USD 9800.00 respectively.
10. Is the market size provided in terms of value or volume?
The market size is provided in terms of value, measured in million.
11. Are there any specific market keywords associated with the report?
Yes, the market keyword associated with the report is "Fitness Equipment for Home Use," which aids in identifying and referencing the specific market segment covered.
12. How do I determine which pricing option suits my needs best?
The pricing options vary based on user requirements and access needs. Individual users may opt for single-user licenses, while businesses requiring broader access may choose multi-user or enterprise licenses for cost-effective access to the report.
13. Are there any additional resources or data provided in the Fitness Equipment for Home Use report?
While the report offers comprehensive insights, it's advisable to review the specific contents or supplementary materials provided to ascertain if additional resources or data are available.
14. How can I stay updated on further developments or reports in the Fitness Equipment for Home Use?
To stay informed about further developments, trends, and reports in the Fitness Equipment for Home Use, consider subscribing to industry newsletters, following relevant companies and organizations, or regularly checking reputable industry news sources and publications.
Methodology
Step 1 - Identification of Relevant Samples Size from Population Database


Step 2 - Approaches for Defining Global Market Size (Value, Volume* & Price*)

Note*: In applicable scenarios
Step 3 - Data Sources
Primary Research
- Web Analytics
- Survey Reports
- Research Institute
- Latest Research Reports
- Opinion Leaders
Secondary Research
- Annual Reports
- White Paper
- Latest Press Release
- Industry Association
- Paid Database
- Investor Presentations

Step 4 - Data Triangulation
Involves using different sources of information in order to increase the validity of a study
These sources are likely to be stakeholders in a program - participants, other researchers, program staff, other community members, and so on.
Then we put all data in single framework & apply various statistical tools to find out the dynamic on the market.
During the analysis stage, feedback from the stakeholder groups would be compared to determine areas of agreement as well as areas of divergence