

Key Insights
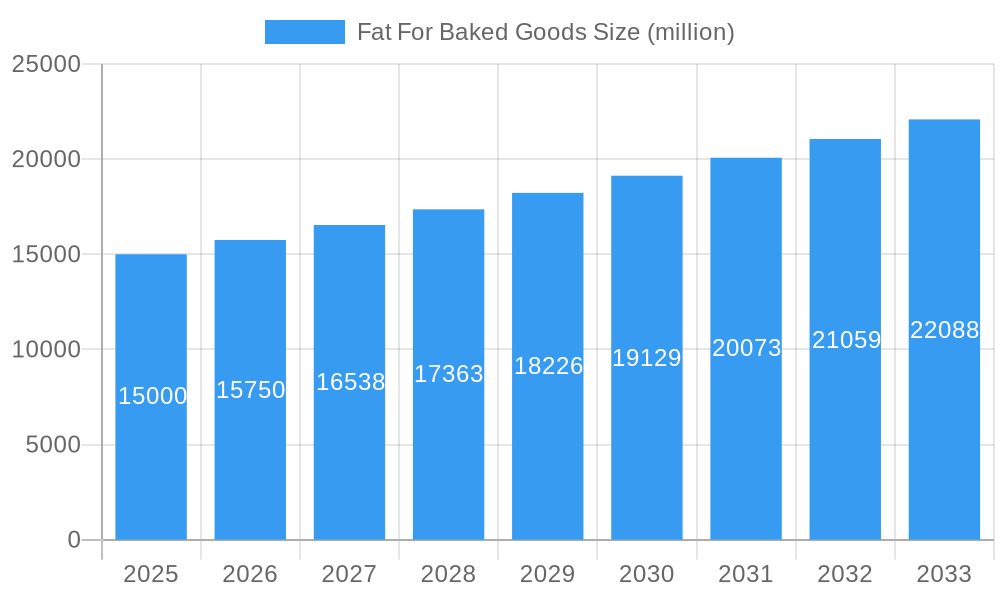
The global market for fats for baked goods is experiencing robust growth, driven by increasing consumer demand for convenient and indulgent baked products. The market, estimated at $15 billion in 2025, is projected to exhibit a compound annual growth rate (CAGR) of 5% from 2025 to 2033, reaching approximately $23 billion by 2033. This growth is fueled by several key factors. Firstly, the rising popularity of bakery and confectionery items across diverse demographics contributes significantly to increased demand. Secondly, the evolving preferences for healthier and more functional baked goods are leading to the innovation of fats with improved nutritional profiles, such as those enriched with omega-3 fatty acids or reduced in saturated fat. This trend is creating opportunities for manufacturers to cater to health-conscious consumers while maintaining product quality and taste. Finally, the growth of the food service industry, including cafes, restaurants, and quick-service establishments, further boosts the demand for fats used in commercially produced baked goods. Major players like Upfield, Bunge, and Cargill are actively involved in expanding their product portfolios to cater to this growing market.
Fat For Baked Goods Market Size (In Billion)
However, the market faces certain challenges. Fluctuations in raw material prices, particularly for vegetable oils, pose a risk to profitability. Furthermore, increasing consumer awareness of the health implications associated with high fat intake may slightly restrain market growth, necessitating continued innovation in healthier fat alternatives. Despite these challenges, the market's strong fundamentals, driven by global population growth, increasing disposable incomes, and the enduring appeal of baked goods, are expected to propel its continued expansion throughout the forecast period. Segmentation within the market is likely driven by fat type (e.g., butter, margarine, shortenings), application (e.g., cakes, bread, pastries), and geographical region, with developed economies showing slightly slower growth compared to emerging markets with rising consumption rates.
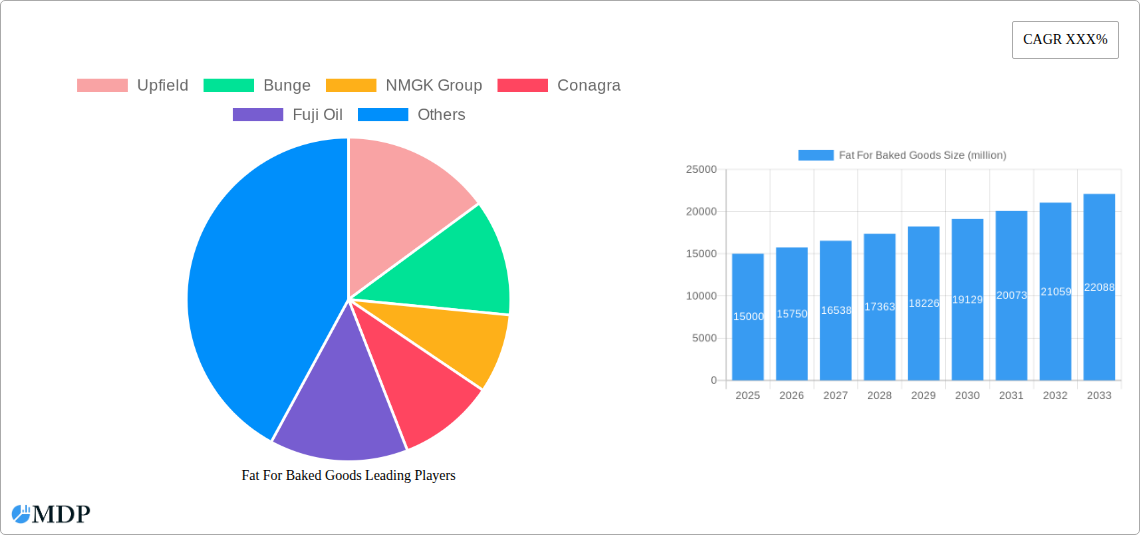
Fat For Baked Goods Company Market Share
Fat For Baked Goods Market Report: 2019-2033 - A Comprehensive Analysis
Unlock the secrets to success in the multi-billion dollar Fat For Baked Goods market with this in-depth report. Covering the period from 2019 to 2033, with a focus on 2025, this comprehensive study provides invaluable insights into market dynamics, leading players, and future opportunities. This report is essential for industry stakeholders, investors, and anyone seeking a competitive edge in this dynamic sector. Expect detailed analysis across key segments, regions, and companies including Upfield, Bunge, NMGK Group, and more. Prepare to make informed decisions based on robust data and expert analysis.
Fat For Baked Goods Market Dynamics & Concentration
This section delves into the competitive landscape of the Fat For Baked Goods market, analyzing market concentration, innovation, regulatory factors, and market activities.
Market Concentration: The global Fat For Baked Goods market exhibits a moderately concentrated structure. While precise market share figures for individual players vary, leading companies such as Upfield, Bunge, and Cargill collectively hold an estimated xx% market share in 2025. This concentration is attributed to the significant capital investment required for production and distribution, as well as established brand recognition.
Innovation Drivers: Continuous innovation in fat formulations, driven by consumer demand for healthier options (e.g., reduced saturated fat, trans-fat free products), fuels market growth. Furthermore, the development of sustainable and ethically sourced fats is a significant innovation driver.
Regulatory Frameworks: Government regulations concerning fat content, labeling requirements, and food safety standards play a crucial role in shaping market dynamics. Compliance costs and evolving regulations present both challenges and opportunities for market players.
Product Substitutes: The market faces competition from alternative ingredients, such as fruit purees, nut butters, and plant-based alternatives. The rise of vegan and vegetarian diets is driving demand for such substitutes, impacting the market share of traditional fats.
End-User Trends: Growing health consciousness among consumers is leading to a shift towards healthier baked goods, influencing the demand for specific types of fats. The increasing preference for convenience foods also contributes to the market's growth trajectory.
M&A Activities: The Fat For Baked Goods sector has witnessed xx M&A deals in the historical period (2019-2024), reflecting strategic consolidation within the industry. These mergers and acquisitions primarily aim to expand market reach, gain access to new technologies, and improve operational efficiency.
Fat For Baked Goods Industry Trends & Analysis
This section provides a detailed analysis of the Fat For Baked Goods market's growth trajectory, considering technological advancements, consumer preferences, and competitive landscapes.
The global Fat For Baked Goods market experienced a Compound Annual Growth Rate (CAGR) of xx% during the historical period (2019-2024) and is projected to grow at a CAGR of xx% during the forecast period (2025-2033), reaching a market value of $xx million by 2033. This growth is primarily driven by the rising demand for baked goods globally, fueled by population growth, increasing disposable incomes, and changing lifestyles. Technological advancements in fat processing and formulation are also contributing to the market expansion. Market penetration of specialized fats, such as those with improved functionality or health benefits, continues to increase, creating new opportunities for market players. The competitive landscape remains dynamic, with major players focusing on innovation, brand building, and strategic partnerships to maintain market share and drive growth. Changing consumer preferences, including a growing preference for healthier options and sustainably sourced products, present both challenges and opportunities for businesses operating within the industry.
Leading Markets & Segments in Fat For Baked Goods
This section identifies the dominant regions, countries, and segments within the Fat For Baked Goods market.
Dominant Region/Country: The [Region Name] region, specifically [Country Name], is the leading market for Fat For Baked Goods, accounting for approximately xx% of global market share in 2025.
Key Drivers for Dominance:
- Robust Economy: Strong economic growth and a rising middle class have fueled increased demand for baked goods.
- Developed Infrastructure: Efficient supply chains and distribution networks facilitate market penetration.
- Favorable Government Policies: Supportive regulatory frameworks and investment incentives have spurred industry growth.
- Established Consumer Base: High consumption of baked goods among the population.
The dominance of [Region Name]/[Country Name] is further substantiated by a detailed analysis showing higher consumption per capita and a greater prevalence of established bakery industries and advanced processing facilities. Other regions such as [mention other major regions] also showcase significant growth potential, driven by factors such as rising disposable income and evolving dietary habits.
Fat For Baked Goods Product Developments
The Fat For Baked Goods market is witnessing continuous product innovation driven by consumer demand for improved taste, texture, health benefits, and cost-effectiveness. New formulations emphasizing reduced saturated fat, trans-fat elimination, and incorporation of functional ingredients (e.g., Omega-3 fatty acids) are gaining traction. Technological advancements in fat processing, such as enzymatic modification and fractionation, are leading to the development of fats with tailored properties for specific applications in baked goods. This innovation is fostering improved shelf life, enhanced texture, and better nutritional profiles. The market is seeing increasing adoption of plant-based fats to cater to the growing demand for vegetarian and vegan options.
Key Drivers of Fat For Baked Goods Growth
The growth of the Fat For Baked Goods market is propelled by several key factors:
- Rising Demand for Baked Goods: Growing global population and increasing disposable incomes contribute significantly to the demand for various baked products.
- Technological Advancements: Innovations in fat processing and formulation enable production of fats with improved properties, enhancing product quality and consumer appeal.
- Favorable Regulatory Environment: Government support and favorable policies towards the food processing industry provide impetus for growth.
- Strategic Partnerships and Mergers and Acquisitions: Consolidation and collaborations within the industry enhance market reach and accelerate growth.
Challenges in the Fat For Baked Goods Market
The Fat For Baked Goods market faces several challenges:
- Fluctuating Raw Material Prices: Volatility in the prices of key raw materials can impact the profitability of manufacturers.
- Stringent Regulatory Compliance: Adherence to complex food safety regulations and labeling requirements adds to operational costs.
- Intense Competition: The market is highly competitive, with both large multinational corporations and smaller regional players vying for market share.
- Health Concerns and Consumer Preferences: Growing consumer awareness of health issues related to fat consumption influences demand for low-fat and healthier alternatives. This necessitates innovation and adaptation to consumer trends.
Emerging Opportunities in Fat For Baked Goods
The Fat For Baked Goods market presents several emerging opportunities:
The rising demand for clean-label products, coupled with advancements in plant-based fat alternatives, is opening up new avenues for growth. Strategic partnerships and collaborations amongst ingredient suppliers, food manufacturers, and technology providers are creating opportunities to develop innovative and sustainable solutions. Expanding into new geographical markets, particularly in developing economies experiencing rapid economic growth, offers considerable market expansion potential. Focusing on functional fats, with tailored properties for enhancing health and nutritional value, will become a key differentiator in the increasingly health-conscious consumer market.
Key Milestones in Fat For Baked Goods Industry
- 2020: Introduction of a novel enzymatic process for modifying palm oil for baked goods, improving its functionality.
- 2021: Launch of a new range of plant-based fats designed for vegan baked goods.
- 2022: Merger between two major fat producers resulting in enhanced market reach and economies of scale.
- 2023: Regulatory changes impacting the labeling of trans fats in baked goods.
- 2024: Significant investment in research and development focused on sustainable and ethically sourced fats.
Strategic Outlook for Fat For Baked Goods Market
The Fat For Baked Goods market is poised for continued growth, driven by rising consumer demand, technological advancements, and expanding applications across various baked goods segments. Strategic opportunities lie in developing innovative and sustainable fat solutions, catering to the growing demand for healthier and more convenient baked products. Focusing on plant-based alternatives and optimizing production processes to enhance efficiency and reduce costs are crucial for success. Companies with a strong focus on research and development, coupled with agile adaptation to evolving consumer preferences, are best positioned to capture market share and achieve long-term growth in this dynamic market.
Fat For Baked Goods Segmentation
-
1. Application
- 1.1. Home
- 1.2. Commercial
- 1.3. Others
-
2. Type
- 2.1. Solid
- 2.2. Liquid
Fat For Baked Goods Segmentation By Geography
-
1. North America
- 1.1. United States
- 1.2. Canada
- 1.3. Mexico
-
2. South America
- 2.1. Brazil
- 2.2. Argentina
- 2.3. Rest of South America
-
3. Europe
- 3.1. United Kingdom
- 3.2. Germany
- 3.3. France
- 3.4. Italy
- 3.5. Spain
- 3.6. Russia
- 3.7. Benelux
- 3.8. Nordics
- 3.9. Rest of Europe
-
4. Middle East & Africa
- 4.1. Turkey
- 4.2. Israel
- 4.3. GCC
- 4.4. North Africa
- 4.5. South Africa
- 4.6. Rest of Middle East & Africa
-
5. Asia Pacific
- 5.1. China
- 5.2. India
- 5.3. Japan
- 5.4. South Korea
- 5.5. ASEAN
- 5.6. Oceania
- 5.7. Rest of Asia Pacific
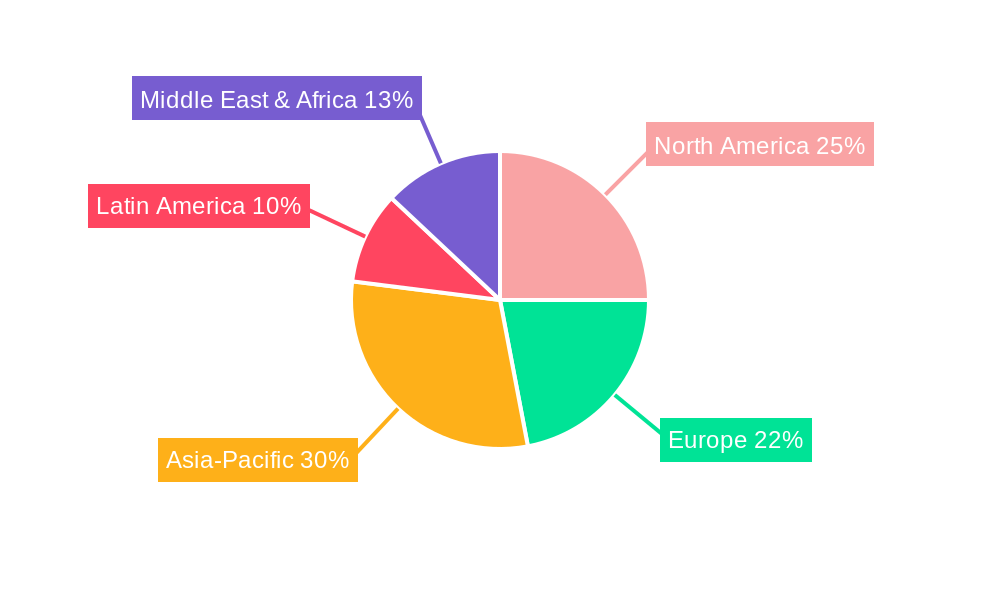
Fat For Baked Goods Regional Market Share
Geographic Coverage of Fat For Baked Goods
Fat For Baked Goods REPORT HIGHLIGHTS
| Aspects | Details |
|---|---|
| Study Period | 2020-2034 |
| Base Year | 2025 |
| Estimated Year | 2026 |
| Forecast Period | 2026-2034 |
| Historical Period | 2020-2025 |
| Growth Rate | CAGR of XXX% from 2020-2034 |
| Segmentation |
|
Table of Contents
- 1. Introduction
- 1.1. Research Scope
- 1.2. Market Segmentation
- 1.3. Research Methodology
- 1.4. Definitions and Assumptions
- 2. Executive Summary
- 2.1. Introduction
- 3. Market Dynamics
- 3.1. Introduction
- 3.2. Market Drivers
- 3.3. Market Restrains
- 3.4. Market Trends
- 4. Market Factor Analysis
- 4.1. Porters Five Forces
- 4.2. Supply/Value Chain
- 4.3. PESTEL analysis
- 4.4. Market Entropy
- 4.5. Patent/Trademark Analysis
- 5. Global Fat For Baked Goods Analysis, Insights and Forecast, 2020-2032
- 5.1. Market Analysis, Insights and Forecast - by Application
- 5.1.1. Home
- 5.1.2. Commercial
- 5.1.3. Others
- 5.2. Market Analysis, Insights and Forecast - by Type
- 5.2.1. Solid
- 5.2.2. Liquid
- 5.3. Market Analysis, Insights and Forecast - by Region
- 5.3.1. North America
- 5.3.2. South America
- 5.3.3. Europe
- 5.3.4. Middle East & Africa
- 5.3.5. Asia Pacific
- 5.1. Market Analysis, Insights and Forecast - by Application
- 6. North America Fat For Baked Goods Analysis, Insights and Forecast, 2020-2032
- 6.1. Market Analysis, Insights and Forecast - by Application
- 6.1.1. Home
- 6.1.2. Commercial
- 6.1.3. Others
- 6.2. Market Analysis, Insights and Forecast - by Type
- 6.2.1. Solid
- 6.2.2. Liquid
- 6.1. Market Analysis, Insights and Forecast - by Application
- 7. South America Fat For Baked Goods Analysis, Insights and Forecast, 2020-2032
- 7.1. Market Analysis, Insights and Forecast - by Application
- 7.1.1. Home
- 7.1.2. Commercial
- 7.1.3. Others
- 7.2. Market Analysis, Insights and Forecast - by Type
- 7.2.1. Solid
- 7.2.2. Liquid
- 7.1. Market Analysis, Insights and Forecast - by Application
- 8. Europe Fat For Baked Goods Analysis, Insights and Forecast, 2020-2032
- 8.1. Market Analysis, Insights and Forecast - by Application
- 8.1.1. Home
- 8.1.2. Commercial
- 8.1.3. Others
- 8.2. Market Analysis, Insights and Forecast - by Type
- 8.2.1. Solid
- 8.2.2. Liquid
- 8.1. Market Analysis, Insights and Forecast - by Application
- 9. Middle East & Africa Fat For Baked Goods Analysis, Insights and Forecast, 2020-2032
- 9.1. Market Analysis, Insights and Forecast - by Application
- 9.1.1. Home
- 9.1.2. Commercial
- 9.1.3. Others
- 9.2. Market Analysis, Insights and Forecast - by Type
- 9.2.1. Solid
- 9.2.2. Liquid
- 9.1. Market Analysis, Insights and Forecast - by Application
- 10. Asia Pacific Fat For Baked Goods Analysis, Insights and Forecast, 2020-2032
- 10.1. Market Analysis, Insights and Forecast - by Application
- 10.1.1. Home
- 10.1.2. Commercial
- 10.1.3. Others
- 10.2. Market Analysis, Insights and Forecast - by Type
- 10.2.1. Solid
- 10.2.2. Liquid
- 10.1. Market Analysis, Insights and Forecast - by Application
- 11. Competitive Analysis
- 11.1. Global Market Share Analysis 2025
- 11.2. Company Profiles
- 11.2.1 Upfield
- 11.2.1.1. Overview
- 11.2.1.2. Products
- 11.2.1.3. SWOT Analysis
- 11.2.1.4. Recent Developments
- 11.2.1.5. Financials (Based on Availability)
- 11.2.2 Bunge
- 11.2.2.1. Overview
- 11.2.2.2. Products
- 11.2.2.3. SWOT Analysis
- 11.2.2.4. Recent Developments
- 11.2.2.5. Financials (Based on Availability)
- 11.2.3 NMGK Group
- 11.2.3.1. Overview
- 11.2.3.2. Products
- 11.2.3.3. SWOT Analysis
- 11.2.3.4. Recent Developments
- 11.2.3.5. Financials (Based on Availability)
- 11.2.4 Conagra
- 11.2.4.1. Overview
- 11.2.4.2. Products
- 11.2.4.3. SWOT Analysis
- 11.2.4.4. Recent Developments
- 11.2.4.5. Financials (Based on Availability)
- 11.2.5 Fuji Oil
- 11.2.5.1. Overview
- 11.2.5.2. Products
- 11.2.5.3. SWOT Analysis
- 11.2.5.4. Recent Developments
- 11.2.5.5. Financials (Based on Availability)
- 11.2.6 BRF
- 11.2.6.1. Overview
- 11.2.6.2. Products
- 11.2.6.3. SWOT Analysis
- 11.2.6.4. Recent Developments
- 11.2.6.5. Financials (Based on Availability)
- 11.2.7 Yildiz Holding
- 11.2.7.1. Overview
- 11.2.7.2. Products
- 11.2.7.3. SWOT Analysis
- 11.2.7.4. Recent Developments
- 11.2.7.5. Financials (Based on Availability)
- 11.2.8 Grupo Lala
- 11.2.8.1. Overview
- 11.2.8.2. Products
- 11.2.8.3. SWOT Analysis
- 11.2.8.4. Recent Developments
- 11.2.8.5. Financials (Based on Availability)
- 11.2.9 Cargill
- 11.2.9.1. Overview
- 11.2.9.2. Products
- 11.2.9.3. SWOT Analysis
- 11.2.9.4. Recent Developments
- 11.2.9.5. Financials (Based on Availability)
- 11.2.10 ADM
- 11.2.10.1. Overview
- 11.2.10.2. Products
- 11.2.10.3. SWOT Analysis
- 11.2.10.4. Recent Developments
- 11.2.10.5. Financials (Based on Availability)
- 11.2.11 JM Smucker
- 11.2.11.1. Overview
- 11.2.11.2. Products
- 11.2.11.3. SWOT Analysis
- 11.2.11.4. Recent Developments
- 11.2.11.5. Financials (Based on Availability)
- 11.2.12 AAK
- 11.2.12.1. Overview
- 11.2.12.2. Products
- 11.2.12.3. SWOT Analysis
- 11.2.12.4. Recent Developments
- 11.2.12.5. Financials (Based on Availability)
- 11.2.13 Wilmar International
- 11.2.13.1. Overview
- 11.2.13.2. Products
- 11.2.13.3. SWOT Analysis
- 11.2.13.4. Recent Developments
- 11.2.13.5. Financials (Based on Availability)
- 11.2.14 COFCO
- 11.2.14.1. Overview
- 11.2.14.2. Products
- 11.2.14.3. SWOT Analysis
- 11.2.14.4. Recent Developments
- 11.2.14.5. Financials (Based on Availability)
- 11.2.15 Uni-President
- 11.2.15.1. Overview
- 11.2.15.2. Products
- 11.2.15.3. SWOT Analysis
- 11.2.15.4. Recent Developments
- 11.2.15.5. Financials (Based on Availability)
- 11.2.16 AB Mauri
- 11.2.16.1. Overview
- 11.2.16.2. Products
- 11.2.16.3. SWOT Analysis
- 11.2.16.4. Recent Developments
- 11.2.16.5. Financials (Based on Availability)
- 11.2.17 Saputo
- 11.2.17.1. Overview
- 11.2.17.2. Products
- 11.2.17.3. SWOT Analysis
- 11.2.17.4. Recent Developments
- 11.2.17.5. Financials (Based on Availability)
- 11.2.18 NamChow
- 11.2.18.1. Overview
- 11.2.18.2. Products
- 11.2.18.3. SWOT Analysis
- 11.2.18.4. Recent Developments
- 11.2.18.5. Financials (Based on Availability)
- 11.2.19 PT. Bonanza Megah
- 11.2.19.1. Overview
- 11.2.19.2. Products
- 11.2.19.3. SWOT Analysis
- 11.2.19.4. Recent Developments
- 11.2.19.5. Financials (Based on Availability)
- 11.2.20 Mengniu Dairy
- 11.2.20.1. Overview
- 11.2.20.2. Products
- 11.2.20.3. SWOT Analysis
- 11.2.20.4. Recent Developments
- 11.2.20.5. Financials (Based on Availability)
- 11.2.21 Yili Group
- 11.2.21.1. Overview
- 11.2.21.2. Products
- 11.2.21.3. SWOT Analysis
- 11.2.21.4. Recent Developments
- 11.2.21.5. Financials (Based on Availability)
- 11.2.22 Bright Dairy & Food
- 11.2.22.1. Overview
- 11.2.22.2. Products
- 11.2.22.3. SWOT Analysis
- 11.2.22.4. Recent Developments
- 11.2.22.5. Financials (Based on Availability)
- 11.2.1 Upfield
List of Figures
- Figure 1: Global Fat For Baked Goods Revenue Breakdown (million, %) by Region 2025 & 2033
- Figure 2: Global Fat For Baked Goods Volume Breakdown (K, %) by Region 2025 & 2033
- Figure 3: North America Fat For Baked Goods Revenue (million), by Application 2025 & 2033
- Figure 4: North America Fat For Baked Goods Volume (K), by Application 2025 & 2033
- Figure 5: North America Fat For Baked Goods Revenue Share (%), by Application 2025 & 2033
- Figure 6: North America Fat For Baked Goods Volume Share (%), by Application 2025 & 2033
- Figure 7: North America Fat For Baked Goods Revenue (million), by Type 2025 & 2033
- Figure 8: North America Fat For Baked Goods Volume (K), by Type 2025 & 2033
- Figure 9: North America Fat For Baked Goods Revenue Share (%), by Type 2025 & 2033
- Figure 10: North America Fat For Baked Goods Volume Share (%), by Type 2025 & 2033
- Figure 11: North America Fat For Baked Goods Revenue (million), by Country 2025 & 2033
- Figure 12: North America Fat For Baked Goods Volume (K), by Country 2025 & 2033
- Figure 13: North America Fat For Baked Goods Revenue Share (%), by Country 2025 & 2033
- Figure 14: North America Fat For Baked Goods Volume Share (%), by Country 2025 & 2033
- Figure 15: South America Fat For Baked Goods Revenue (million), by Application 2025 & 2033
- Figure 16: South America Fat For Baked Goods Volume (K), by Application 2025 & 2033
- Figure 17: South America Fat For Baked Goods Revenue Share (%), by Application 2025 & 2033
- Figure 18: South America Fat For Baked Goods Volume Share (%), by Application 2025 & 2033
- Figure 19: South America Fat For Baked Goods Revenue (million), by Type 2025 & 2033
- Figure 20: South America Fat For Baked Goods Volume (K), by Type 2025 & 2033
- Figure 21: South America Fat For Baked Goods Revenue Share (%), by Type 2025 & 2033
- Figure 22: South America Fat For Baked Goods Volume Share (%), by Type 2025 & 2033
- Figure 23: South America Fat For Baked Goods Revenue (million), by Country 2025 & 2033
- Figure 24: South America Fat For Baked Goods Volume (K), by Country 2025 & 2033
- Figure 25: South America Fat For Baked Goods Revenue Share (%), by Country 2025 & 2033
- Figure 26: South America Fat For Baked Goods Volume Share (%), by Country 2025 & 2033
- Figure 27: Europe Fat For Baked Goods Revenue (million), by Application 2025 & 2033
- Figure 28: Europe Fat For Baked Goods Volume (K), by Application 2025 & 2033
- Figure 29: Europe Fat For Baked Goods Revenue Share (%), by Application 2025 & 2033
- Figure 30: Europe Fat For Baked Goods Volume Share (%), by Application 2025 & 2033
- Figure 31: Europe Fat For Baked Goods Revenue (million), by Type 2025 & 2033
- Figure 32: Europe Fat For Baked Goods Volume (K), by Type 2025 & 2033
- Figure 33: Europe Fat For Baked Goods Revenue Share (%), by Type 2025 & 2033
- Figure 34: Europe Fat For Baked Goods Volume Share (%), by Type 2025 & 2033
- Figure 35: Europe Fat For Baked Goods Revenue (million), by Country 2025 & 2033
- Figure 36: Europe Fat For Baked Goods Volume (K), by Country 2025 & 2033
- Figure 37: Europe Fat For Baked Goods Revenue Share (%), by Country 2025 & 2033
- Figure 38: Europe Fat For Baked Goods Volume Share (%), by Country 2025 & 2033
- Figure 39: Middle East & Africa Fat For Baked Goods Revenue (million), by Application 2025 & 2033
- Figure 40: Middle East & Africa Fat For Baked Goods Volume (K), by Application 2025 & 2033
- Figure 41: Middle East & Africa Fat For Baked Goods Revenue Share (%), by Application 2025 & 2033
- Figure 42: Middle East & Africa Fat For Baked Goods Volume Share (%), by Application 2025 & 2033
- Figure 43: Middle East & Africa Fat For Baked Goods Revenue (million), by Type 2025 & 2033
- Figure 44: Middle East & Africa Fat For Baked Goods Volume (K), by Type 2025 & 2033
- Figure 45: Middle East & Africa Fat For Baked Goods Revenue Share (%), by Type 2025 & 2033
- Figure 46: Middle East & Africa Fat For Baked Goods Volume Share (%), by Type 2025 & 2033
- Figure 47: Middle East & Africa Fat For Baked Goods Revenue (million), by Country 2025 & 2033
- Figure 48: Middle East & Africa Fat For Baked Goods Volume (K), by Country 2025 & 2033
- Figure 49: Middle East & Africa Fat For Baked Goods Revenue Share (%), by Country 2025 & 2033
- Figure 50: Middle East & Africa Fat For Baked Goods Volume Share (%), by Country 2025 & 2033
- Figure 51: Asia Pacific Fat For Baked Goods Revenue (million), by Application 2025 & 2033
- Figure 52: Asia Pacific Fat For Baked Goods Volume (K), by Application 2025 & 2033
- Figure 53: Asia Pacific Fat For Baked Goods Revenue Share (%), by Application 2025 & 2033
- Figure 54: Asia Pacific Fat For Baked Goods Volume Share (%), by Application 2025 & 2033
- Figure 55: Asia Pacific Fat For Baked Goods Revenue (million), by Type 2025 & 2033
- Figure 56: Asia Pacific Fat For Baked Goods Volume (K), by Type 2025 & 2033
- Figure 57: Asia Pacific Fat For Baked Goods Revenue Share (%), by Type 2025 & 2033
- Figure 58: Asia Pacific Fat For Baked Goods Volume Share (%), by Type 2025 & 2033
- Figure 59: Asia Pacific Fat For Baked Goods Revenue (million), by Country 2025 & 2033
- Figure 60: Asia Pacific Fat For Baked Goods Volume (K), by Country 2025 & 2033
- Figure 61: Asia Pacific Fat For Baked Goods Revenue Share (%), by Country 2025 & 2033
- Figure 62: Asia Pacific Fat For Baked Goods Volume Share (%), by Country 2025 & 2033
List of Tables
- Table 1: Global Fat For Baked Goods Revenue million Forecast, by Application 2020 & 2033
- Table 2: Global Fat For Baked Goods Volume K Forecast, by Application 2020 & 2033
- Table 3: Global Fat For Baked Goods Revenue million Forecast, by Type 2020 & 2033
- Table 4: Global Fat For Baked Goods Volume K Forecast, by Type 2020 & 2033
- Table 5: Global Fat For Baked Goods Revenue million Forecast, by Region 2020 & 2033
- Table 6: Global Fat For Baked Goods Volume K Forecast, by Region 2020 & 2033
- Table 7: Global Fat For Baked Goods Revenue million Forecast, by Application 2020 & 2033
- Table 8: Global Fat For Baked Goods Volume K Forecast, by Application 2020 & 2033
- Table 9: Global Fat For Baked Goods Revenue million Forecast, by Type 2020 & 2033
- Table 10: Global Fat For Baked Goods Volume K Forecast, by Type 2020 & 2033
- Table 11: Global Fat For Baked Goods Revenue million Forecast, by Country 2020 & 2033
- Table 12: Global Fat For Baked Goods Volume K Forecast, by Country 2020 & 2033
- Table 13: United States Fat For Baked Goods Revenue (million) Forecast, by Application 2020 & 2033
- Table 14: United States Fat For Baked Goods Volume (K) Forecast, by Application 2020 & 2033
- Table 15: Canada Fat For Baked Goods Revenue (million) Forecast, by Application 2020 & 2033
- Table 16: Canada Fat For Baked Goods Volume (K) Forecast, by Application 2020 & 2033
- Table 17: Mexico Fat For Baked Goods Revenue (million) Forecast, by Application 2020 & 2033
- Table 18: Mexico Fat For Baked Goods Volume (K) Forecast, by Application 2020 & 2033
- Table 19: Global Fat For Baked Goods Revenue million Forecast, by Application 2020 & 2033
- Table 20: Global Fat For Baked Goods Volume K Forecast, by Application 2020 & 2033
- Table 21: Global Fat For Baked Goods Revenue million Forecast, by Type 2020 & 2033
- Table 22: Global Fat For Baked Goods Volume K Forecast, by Type 2020 & 2033
- Table 23: Global Fat For Baked Goods Revenue million Forecast, by Country 2020 & 2033
- Table 24: Global Fat For Baked Goods Volume K Forecast, by Country 2020 & 2033
- Table 25: Brazil Fat For Baked Goods Revenue (million) Forecast, by Application 2020 & 2033
- Table 26: Brazil Fat For Baked Goods Volume (K) Forecast, by Application 2020 & 2033
- Table 27: Argentina Fat For Baked Goods Revenue (million) Forecast, by Application 2020 & 2033
- Table 28: Argentina Fat For Baked Goods Volume (K) Forecast, by Application 2020 & 2033
- Table 29: Rest of South America Fat For Baked Goods Revenue (million) Forecast, by Application 2020 & 2033
- Table 30: Rest of South America Fat For Baked Goods Volume (K) Forecast, by Application 2020 & 2033
- Table 31: Global Fat For Baked Goods Revenue million Forecast, by Application 2020 & 2033
- Table 32: Global Fat For Baked Goods Volume K Forecast, by Application 2020 & 2033
- Table 33: Global Fat For Baked Goods Revenue million Forecast, by Type 2020 & 2033
- Table 34: Global Fat For Baked Goods Volume K Forecast, by Type 2020 & 2033
- Table 35: Global Fat For Baked Goods Revenue million Forecast, by Country 2020 & 2033
- Table 36: Global Fat For Baked Goods Volume K Forecast, by Country 2020 & 2033
- Table 37: United Kingdom Fat For Baked Goods Revenue (million) Forecast, by Application 2020 & 2033
- Table 38: United Kingdom Fat For Baked Goods Volume (K) Forecast, by Application 2020 & 2033
- Table 39: Germany Fat For Baked Goods Revenue (million) Forecast, by Application 2020 & 2033
- Table 40: Germany Fat For Baked Goods Volume (K) Forecast, by Application 2020 & 2033
- Table 41: France Fat For Baked Goods Revenue (million) Forecast, by Application 2020 & 2033
- Table 42: France Fat For Baked Goods Volume (K) Forecast, by Application 2020 & 2033
- Table 43: Italy Fat For Baked Goods Revenue (million) Forecast, by Application 2020 & 2033
- Table 44: Italy Fat For Baked Goods Volume (K) Forecast, by Application 2020 & 2033
- Table 45: Spain Fat For Baked Goods Revenue (million) Forecast, by Application 2020 & 2033
- Table 46: Spain Fat For Baked Goods Volume (K) Forecast, by Application 2020 & 2033
- Table 47: Russia Fat For Baked Goods Revenue (million) Forecast, by Application 2020 & 2033
- Table 48: Russia Fat For Baked Goods Volume (K) Forecast, by Application 2020 & 2033
- Table 49: Benelux Fat For Baked Goods Revenue (million) Forecast, by Application 2020 & 2033
- Table 50: Benelux Fat For Baked Goods Volume (K) Forecast, by Application 2020 & 2033
- Table 51: Nordics Fat For Baked Goods Revenue (million) Forecast, by Application 2020 & 2033
- Table 52: Nordics Fat For Baked Goods Volume (K) Forecast, by Application 2020 & 2033
- Table 53: Rest of Europe Fat For Baked Goods Revenue (million) Forecast, by Application 2020 & 2033
- Table 54: Rest of Europe Fat For Baked Goods Volume (K) Forecast, by Application 2020 & 2033
- Table 55: Global Fat For Baked Goods Revenue million Forecast, by Application 2020 & 2033
- Table 56: Global Fat For Baked Goods Volume K Forecast, by Application 2020 & 2033
- Table 57: Global Fat For Baked Goods Revenue million Forecast, by Type 2020 & 2033
- Table 58: Global Fat For Baked Goods Volume K Forecast, by Type 2020 & 2033
- Table 59: Global Fat For Baked Goods Revenue million Forecast, by Country 2020 & 2033
- Table 60: Global Fat For Baked Goods Volume K Forecast, by Country 2020 & 2033
- Table 61: Turkey Fat For Baked Goods Revenue (million) Forecast, by Application 2020 & 2033
- Table 62: Turkey Fat For Baked Goods Volume (K) Forecast, by Application 2020 & 2033
- Table 63: Israel Fat For Baked Goods Revenue (million) Forecast, by Application 2020 & 2033
- Table 64: Israel Fat For Baked Goods Volume (K) Forecast, by Application 2020 & 2033
- Table 65: GCC Fat For Baked Goods Revenue (million) Forecast, by Application 2020 & 2033
- Table 66: GCC Fat For Baked Goods Volume (K) Forecast, by Application 2020 & 2033
- Table 67: North Africa Fat For Baked Goods Revenue (million) Forecast, by Application 2020 & 2033
- Table 68: North Africa Fat For Baked Goods Volume (K) Forecast, by Application 2020 & 2033
- Table 69: South Africa Fat For Baked Goods Revenue (million) Forecast, by Application 2020 & 2033
- Table 70: South Africa Fat For Baked Goods Volume (K) Forecast, by Application 2020 & 2033
- Table 71: Rest of Middle East & Africa Fat For Baked Goods Revenue (million) Forecast, by Application 2020 & 2033
- Table 72: Rest of Middle East & Africa Fat For Baked Goods Volume (K) Forecast, by Application 2020 & 2033
- Table 73: Global Fat For Baked Goods Revenue million Forecast, by Application 2020 & 2033
- Table 74: Global Fat For Baked Goods Volume K Forecast, by Application 2020 & 2033
- Table 75: Global Fat For Baked Goods Revenue million Forecast, by Type 2020 & 2033
- Table 76: Global Fat For Baked Goods Volume K Forecast, by Type 2020 & 2033
- Table 77: Global Fat For Baked Goods Revenue million Forecast, by Country 2020 & 2033
- Table 78: Global Fat For Baked Goods Volume K Forecast, by Country 2020 & 2033
- Table 79: China Fat For Baked Goods Revenue (million) Forecast, by Application 2020 & 2033
- Table 80: China Fat For Baked Goods Volume (K) Forecast, by Application 2020 & 2033
- Table 81: India Fat For Baked Goods Revenue (million) Forecast, by Application 2020 & 2033
- Table 82: India Fat For Baked Goods Volume (K) Forecast, by Application 2020 & 2033
- Table 83: Japan Fat For Baked Goods Revenue (million) Forecast, by Application 2020 & 2033
- Table 84: Japan Fat For Baked Goods Volume (K) Forecast, by Application 2020 & 2033
- Table 85: South Korea Fat For Baked Goods Revenue (million) Forecast, by Application 2020 & 2033
- Table 86: South Korea Fat For Baked Goods Volume (K) Forecast, by Application 2020 & 2033
- Table 87: ASEAN Fat For Baked Goods Revenue (million) Forecast, by Application 2020 & 2033
- Table 88: ASEAN Fat For Baked Goods Volume (K) Forecast, by Application 2020 & 2033
- Table 89: Oceania Fat For Baked Goods Revenue (million) Forecast, by Application 2020 & 2033
- Table 90: Oceania Fat For Baked Goods Volume (K) Forecast, by Application 2020 & 2033
- Table 91: Rest of Asia Pacific Fat For Baked Goods Revenue (million) Forecast, by Application 2020 & 2033
- Table 92: Rest of Asia Pacific Fat For Baked Goods Volume (K) Forecast, by Application 2020 & 2033
Frequently Asked Questions
1. What is the projected Compound Annual Growth Rate (CAGR) of the Fat For Baked Goods?
The projected CAGR is approximately XXX%.
2. Which companies are prominent players in the Fat For Baked Goods?
Key companies in the market include Upfield, Bunge, NMGK Group, Conagra, Fuji Oil, BRF, Yildiz Holding, Grupo Lala, Cargill, ADM, JM Smucker, AAK, Wilmar International, COFCO, Uni-President, AB Mauri, Saputo, NamChow, PT. Bonanza Megah, Mengniu Dairy, Yili Group, Bright Dairy & Food.
3. What are the main segments of the Fat For Baked Goods?
The market segments include Application, Type.
4. Can you provide details about the market size?
The market size is estimated to be USD XXX million as of 2022.
5. What are some drivers contributing to market growth?
N/A
6. What are the notable trends driving market growth?
N/A
7. Are there any restraints impacting market growth?
N/A
8. Can you provide examples of recent developments in the market?
N/A
9. What pricing options are available for accessing the report?
Pricing options include single-user, multi-user, and enterprise licenses priced at USD 3950.00, USD 5925.00, and USD 7900.00 respectively.
10. Is the market size provided in terms of value or volume?
The market size is provided in terms of value, measured in million and volume, measured in K.
11. Are there any specific market keywords associated with the report?
Yes, the market keyword associated with the report is "Fat For Baked Goods," which aids in identifying and referencing the specific market segment covered.
12. How do I determine which pricing option suits my needs best?
The pricing options vary based on user requirements and access needs. Individual users may opt for single-user licenses, while businesses requiring broader access may choose multi-user or enterprise licenses for cost-effective access to the report.
13. Are there any additional resources or data provided in the Fat For Baked Goods report?
While the report offers comprehensive insights, it's advisable to review the specific contents or supplementary materials provided to ascertain if additional resources or data are available.
14. How can I stay updated on further developments or reports in the Fat For Baked Goods?
To stay informed about further developments, trends, and reports in the Fat For Baked Goods, consider subscribing to industry newsletters, following relevant companies and organizations, or regularly checking reputable industry news sources and publications.
Methodology
Step 1 - Identification of Relevant Samples Size from Population Database


Step 2 - Approaches for Defining Global Market Size (Value, Volume* & Price*)

Note*: In applicable scenarios
Step 3 - Data Sources
Primary Research
- Web Analytics
- Survey Reports
- Research Institute
- Latest Research Reports
- Opinion Leaders
Secondary Research
- Annual Reports
- White Paper
- Latest Press Release
- Industry Association
- Paid Database
- Investor Presentations

Step 4 - Data Triangulation
Involves using different sources of information in order to increase the validity of a study
These sources are likely to be stakeholders in a program - participants, other researchers, program staff, other community members, and so on.
Then we put all data in single framework & apply various statistical tools to find out the dynamic on the market.
During the analysis stage, feedback from the stakeholder groups would be compared to determine areas of agreement as well as areas of divergence