

Key Insights
The global Eye Protection Light market is poised for significant expansion, projected to reach approximately $6.92 billion by 2025. This robust growth is fueled by a rising awareness of the detrimental effects of prolonged screen time and inadequate lighting on vision health, particularly among students and office workers. The increasing adoption of smart home technologies and the demand for energy-efficient lighting solutions further contribute to this upward trajectory. Key market drivers include government initiatives promoting healthy study environments, the development of advanced LED technology offering tunable and flicker-free illumination, and the growing disposable income enabling consumers to invest in premium eye-care lighting products. The market is experiencing a CAGR of 6.69%, indicating a sustained and healthy expansion over the forecast period.
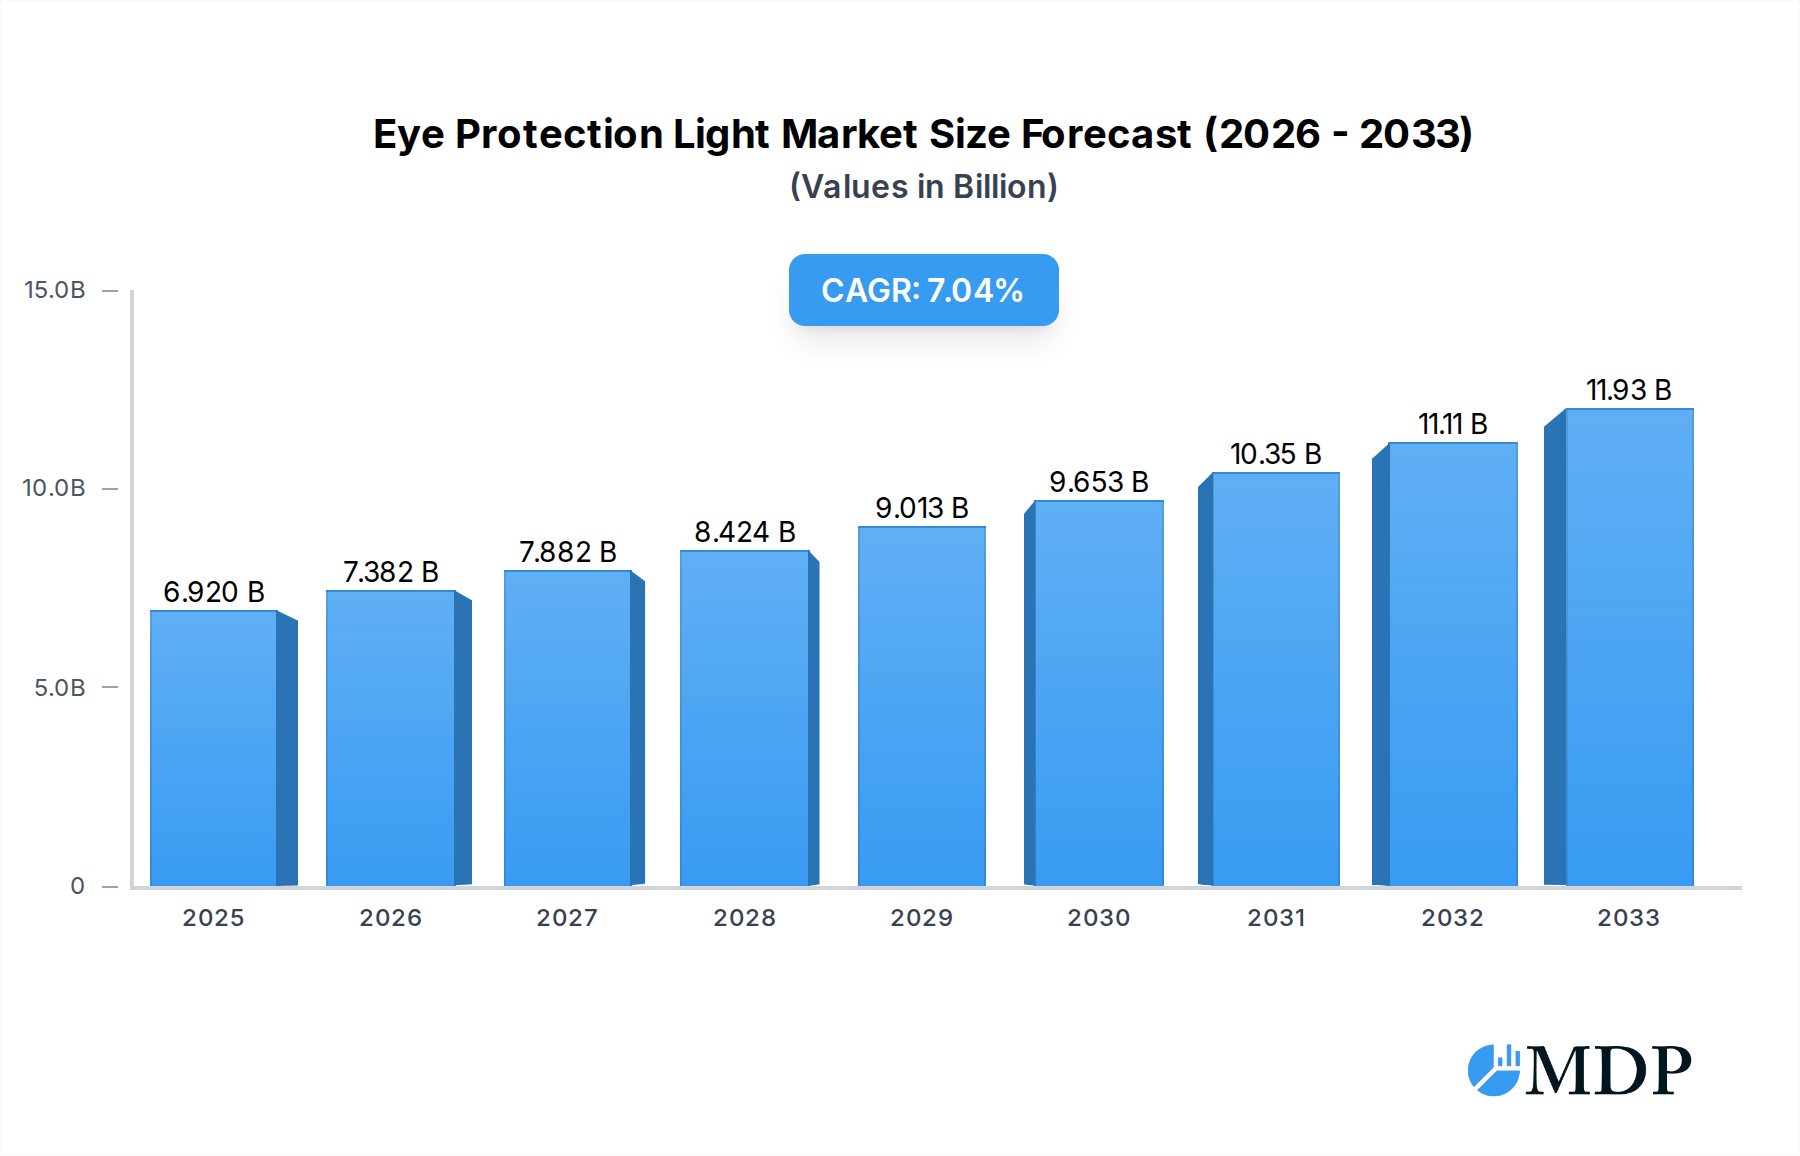
Eye Protection Light Market Size (In Billion)
The market is segmented by application into Home, School, and Others, with the Home and School segments expected to witness substantial growth due to increased screen usage for remote work, online education, and entertainment. In terms of types, Folding Table Lamps and Vertical Table Lamps are anticipated to dominate, offering versatility and targeted illumination for various tasks. Geographically, Asia Pacific is expected to lead the market, driven by a large population, rapid urbanization, and a growing middle class with increasing disposable income and a heightened focus on health and education. Companies like Philips, OSRAM, and Panasonic are at the forefront of innovation, introducing advanced eye-care lighting solutions to cater to the evolving consumer needs and capitalize on market opportunities.

Eye Protection Light Company Market Share
Eye Protection Light Market Report: Driving Innovation and Healthy Vision in a Digital Age
This comprehensive report, "Eye Protection Light Market Dynamics and Forecast 2019–2033," offers an in-depth analysis of the rapidly evolving eye protection light industry. With a study period spanning from 2019 to 2033, a base year of 2025, and an estimated year also in 2025, this report provides critical insights for industry stakeholders looking to navigate growth opportunities and understand market trends. The forecast period, from 2025 to 2033, details projected advancements and market penetration. This report leverages a historical analysis from 2019–2024 to establish a robust foundation for future projections, ensuring actionable intelligence for strategic decision-making in a market projected to reach billions in valuation.
Eye Protection Light Market Dynamics & Concentration
The eye protection light market is characterized by moderate concentration, with a handful of prominent players holding significant market share, estimated to be in the billions. Innovation drivers, such as the increasing prevalence of digital eye strain and a growing awareness of visual health, are propelling the market forward. Regulatory frameworks, though evolving, are increasingly focusing on setting standards for light quality and flicker reduction to safeguard consumer vision. Product substitutes, including general lighting solutions, still exist, but the specialized nature of eye protection lights, offering targeted benefits like flicker-free illumination and adjustable color temperatures, is creating a distinct market niche. End-user trends are overwhelmingly positive, with consumers actively seeking solutions to mitigate the adverse effects of prolonged screen time. Mergers and acquisitions (M&A) activities, while not at an extreme level, are present as companies seek to consolidate their market position and expand their technological capabilities. M&A deal counts are expected to rise as the market matures, with an estimated xx number of significant deals anticipated during the forecast period.
Eye Protection Light Industry Trends & Analysis
The eye protection light industry is experiencing robust growth, fueled by several interconnected trends and technological advancements. The escalating adoption of digital devices across all age groups, from students to professionals, has created an unprecedented demand for lighting solutions designed to minimize eye fatigue and discomfort. This surge in screen time directly translates into a heightened awareness of visual health, making eye protection lights a necessity rather than a luxury for a significant portion of the population. The Compound Annual Growth Rate (CAGR) for the eye protection light market is projected to be substantial, estimated at xx% over the forecast period, signifying a strong upward trajectory. Technological disruptions are a key enabler of this growth. Innovations in LED technology have allowed for the development of lights with superior color rendering indexes (CRI), flicker-free operation, and customizable color temperatures that can mimic natural daylight, thereby reducing blue light exposure. This enhanced functionality is directly appealing to consumers, leading to increased market penetration. Consumer preferences are rapidly shifting towards smart lighting solutions that offer app-controlled adjustments and personalized lighting profiles, further driving adoption. The competitive dynamics within the market are characterized by a blend of established global brands and emerging regional players, all vying to capture market share through product differentiation, competitive pricing, and effective marketing strategies. The market penetration of specialized eye protection lights is projected to reach xx% by 2033, indicating a significant shift in consumer purchasing habits. The emphasis on creating a healthier and more productive environment, both at home and in educational institutions, is a powerful underlying driver. The increasing understanding of the long-term implications of poor lighting on vision is also contributing to the demand for these specialized products. The integration of AI and IoT capabilities into eye protection lights, enabling adaptive lighting based on ambient conditions and user activity, represents a significant future trend that will continue to shape the market landscape and drive further innovation.
Leading Markets & Segments in Eye Protection Light
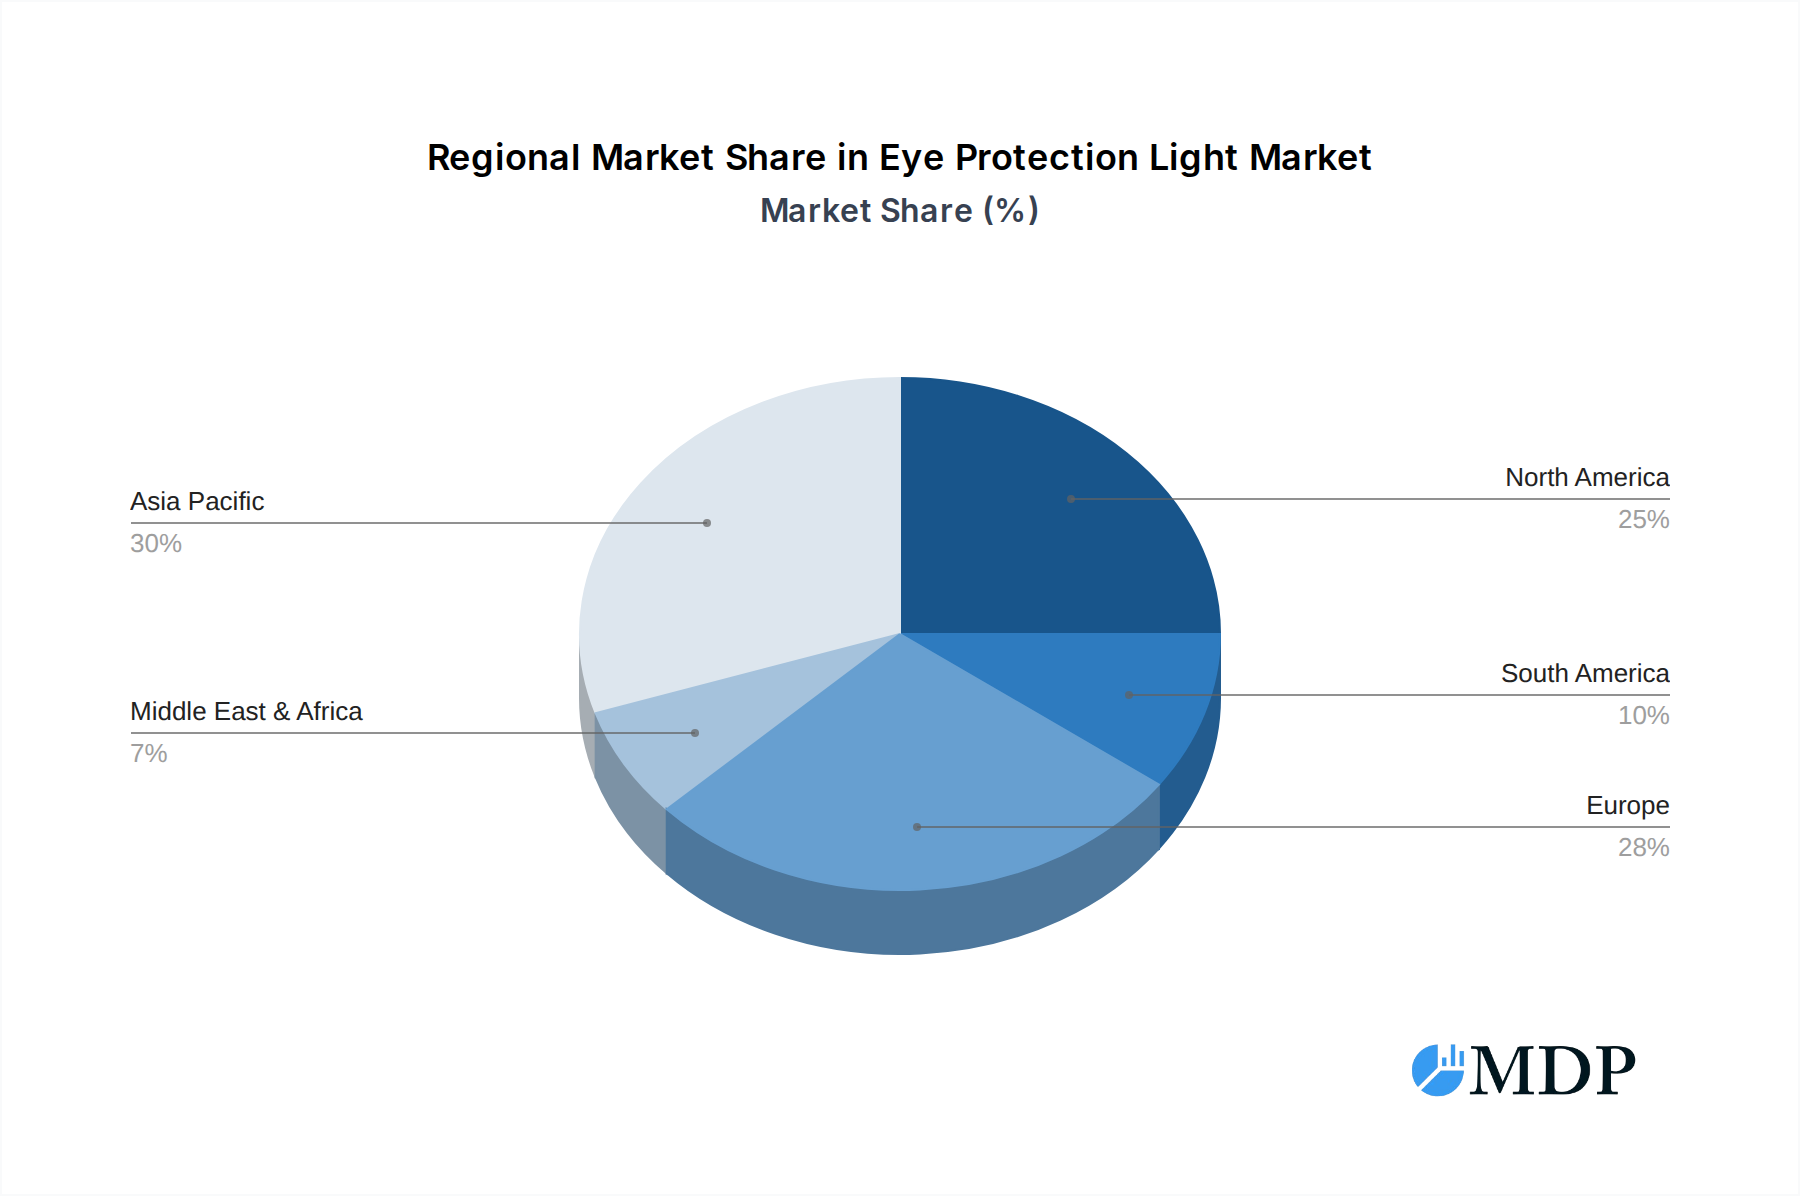
The dominant region in the eye protection light market is Asia Pacific, driven by its massive population, rapid urbanization, and burgeoning middle class with increasing disposable income. Within Asia Pacific, China stands out as a leading country due to its extensive manufacturing capabilities, a vast domestic market for consumer electronics, and government initiatives promoting technological adoption. The "Home" application segment is currently the largest, as individuals increasingly invest in creating comfortable and healthy study and work environments at home, particularly amplified by the rise of remote work and online learning. The "School" application segment is also showing significant growth, with educational institutions recognizing the critical role of proper lighting in student learning and well-being, leading to increased adoption of eye-friendly lighting solutions in classrooms and libraries.
Key drivers for the dominance of these markets and segments include:
- Economic Policies: Favorable government policies supporting the electronics manufacturing sector and consumer spending on health and wellness products in countries like China and India.
- Infrastructure Development: The widespread availability of electricity and the increasing adoption of smart home and smart building technologies create a fertile ground for advanced lighting solutions.
- Consumer Awareness: A growing understanding among consumers and educators about the detrimental effects of poor lighting on eyesight, particularly from prolonged screen use.
- Technological Advancements: The availability of affordable, high-quality LED technology and innovative features tailored for eye protection are making these products more accessible and desirable.
- E-commerce Penetration: The strong presence of e-commerce platforms facilitates easy access to a wide range of eye protection lights for consumers across different regions.
The "Vertical Table Lamp" type segment is a significant contributor to market growth due to its functional design and ability to provide focused illumination without glare. The "Folding Table Lamp" segment is also gaining traction, especially among students and those with limited desk space, offering portability and versatility. The "Others" segment, encompassing innovative designs and specialized application lights, is expected to witness accelerated growth as manufacturers explore new form factors and functionalities. The continued investment in research and development by leading companies is instrumental in introducing next-generation eye protection lights that cater to evolving consumer needs and address emerging concerns related to digital eye strain and visual fatigue. The market's ability to adapt to diverse user requirements, from academic settings to professional workspaces and home environments, underscores its broad appeal and sustained expansion potential.
Eye Protection Light Product Developments
Product development in the eye protection light sector is heavily focused on enhancing user experience and mitigating digital eye strain. Innovations include adaptive lighting systems that automatically adjust brightness and color temperature based on ambient light and time of day, mimicking natural sunlight patterns to reduce eye fatigue. The integration of advanced LED technologies ensures flicker-free operation and high color rendering indexes (CRI) for more natural and comfortable illumination. Competitive advantages are being derived from smart features, such as app-controlled adjustments, customizable lighting modes for different activities (reading, working, relaxing), and energy efficiency. Companies are also developing unique designs and form factors to cater to diverse aesthetic preferences and space constraints, further broadening the market appeal.
Key Drivers of Eye Protection Light Growth
The growth of the eye protection light market is primarily propelled by escalating concerns over digital eye strain and the increasing awareness of visual health among consumers. The widespread adoption of smartphones, tablets, and computers for extended periods, especially in educational and professional settings, has created a substantial demand for lighting solutions that reduce eye fatigue and protect vision. Technological advancements in LED lighting, enabling flicker-free operation, adjustable color temperatures, and enhanced CRI, are making these products more effective and appealing. Furthermore, supportive government initiatives and increasing R&D investments by manufacturers in developing specialized lighting solutions are significantly contributing to market expansion. The market penetration of eye protection lights is projected to exceed billions in value by 2033.
Challenges in the Eye Protection Light Market
Despite the positive growth trajectory, the eye protection light market faces several challenges. Regulatory hurdles related to establishing standardized quality benchmarks and certifications for eye-friendly lighting can slow down product adoption and market entry for new players. Intense competition from both established brands and numerous new entrants can lead to price wars and margin pressures, impacting profitability. Supply chain issues, particularly concerning the availability and cost of specialized components for advanced LED technology, can disrupt production and increase manufacturing expenses. Furthermore, a lack of widespread consumer education about the specific benefits and features of specialized eye protection lights, compared to generic lighting options, presents a barrier to full market potential, estimated to impact market share by xx% if not addressed.
Emerging Opportunities in Eye Protection Light
Emerging opportunities in the eye protection light market are largely driven by technological breakthroughs and strategic market expansion. The growing integration of smart home technology and the Internet of Things (IoT) presents a significant catalyst for developing connected eye protection lights that can be seamlessly controlled and personalized via mobile apps and voice assistants. Strategic partnerships between lighting manufacturers and consumer electronics companies can lead to bundled offerings and cross-promotional activities, expanding reach. Furthermore, the untapped potential in emerging economies, where awareness of digital eye strain is growing, offers substantial market expansion opportunities. The development of specialized eye protection lights for specific professions, such as healthcare workers and gamers, also represents a niche but growing opportunity.
Leading Players in the Eye Protection Light Sector
- Leimove
- Philips
- OSRAM
- Panasonic
- OPPLE
- YAGE
- Dpled
- Midea
Key Milestones in Eye Protection Light Industry
- 2019: Increased focus on flicker-free LED technology in consumer lighting.
- 2020: Rise in demand for home study lights due to global shift to remote learning.
- 2021: Introduction of smart table lamps with app-controlled color temperature adjustments.
- 2022: Growing consumer awareness campaigns on digital eye strain and the importance of eye protection lighting.
- 2023: Advancements in adjustable LED spectrums to mimic natural daylight cycles.
- 2024: Expansion of product lines to include specialized eye protection lights for professional use.
- 2025 (Estimated): Expected launch of more AI-integrated lighting solutions that adapt to user needs.
Strategic Outlook for Eye Protection Light Market
The strategic outlook for the eye protection light market is highly optimistic, driven by an increasing global emphasis on health and well-being, particularly in relation to visual comfort amidst pervasive digital device usage. Future growth will be accelerated by continued innovation in smart lighting technologies, integrating features like AI-powered adaptive lighting and seamless connectivity with smart home ecosystems. The expansion into emerging markets, coupled with strategic alliances and product diversification to cater to niche applications, will be crucial for sustained market leadership. Continued investment in R&D and effective consumer education campaigns will solidify the market's position as a vital segment within the broader lighting industry, projected to achieve billions in market valuation.
Eye Protection Light Segmentation
-
1. Application
- 1.1. Home
- 1.2. School
- 1.3. Others
-
2. Types
- 2.1. Folding Table Lamp
- 2.2. Vertical Table Lamp
- 2.3. Others
Eye Protection Light Segmentation By Geography
-
1. North America
- 1.1. United States
- 1.2. Canada
- 1.3. Mexico
-
2. South America
- 2.1. Brazil
- 2.2. Argentina
- 2.3. Rest of South America
-
3. Europe
- 3.1. United Kingdom
- 3.2. Germany
- 3.3. France
- 3.4. Italy
- 3.5. Spain
- 3.6. Russia
- 3.7. Benelux
- 3.8. Nordics
- 3.9. Rest of Europe
-
4. Middle East & Africa
- 4.1. Turkey
- 4.2. Israel
- 4.3. GCC
- 4.4. North Africa
- 4.5. South Africa
- 4.6. Rest of Middle East & Africa
-
5. Asia Pacific
- 5.1. China
- 5.2. India
- 5.3. Japan
- 5.4. South Korea
- 5.5. ASEAN
- 5.6. Oceania
- 5.7. Rest of Asia Pacific
Eye Protection Light Regional Market Share
Geographic Coverage of Eye Protection Light
Eye Protection Light REPORT HIGHLIGHTS
| Aspects | Details |
|---|---|
| Study Period | 2020-2034 |
| Base Year | 2025 |
| Estimated Year | 2026 |
| Forecast Period | 2026-2034 |
| Historical Period | 2020-2025 |
| Growth Rate | CAGR of 6.69% from 2020-2034 |
| Segmentation |
|
Table of Contents
- 1. Introduction
- 1.1. Research Scope
- 1.2. Market Segmentation
- 1.3. Research Methodology
- 1.4. Definitions and Assumptions
- 2. Executive Summary
- 2.1. Introduction
- 3. Market Dynamics
- 3.1. Introduction
- 3.2. Market Drivers
- 3.3. Market Restrains
- 3.4. Market Trends
- 4. Market Factor Analysis
- 4.1. Porters Five Forces
- 4.2. Supply/Value Chain
- 4.3. PESTEL analysis
- 4.4. Market Entropy
- 4.5. Patent/Trademark Analysis
- 5. Global Eye Protection Light Analysis, Insights and Forecast, 2020-2032
- 5.1. Market Analysis, Insights and Forecast - by Application
- 5.1.1. Home
- 5.1.2. School
- 5.1.3. Others
- 5.2. Market Analysis, Insights and Forecast - by Types
- 5.2.1. Folding Table Lamp
- 5.2.2. Vertical Table Lamp
- 5.2.3. Others
- 5.3. Market Analysis, Insights and Forecast - by Region
- 5.3.1. North America
- 5.3.2. South America
- 5.3.3. Europe
- 5.3.4. Middle East & Africa
- 5.3.5. Asia Pacific
- 5.1. Market Analysis, Insights and Forecast - by Application
- 6. North America Eye Protection Light Analysis, Insights and Forecast, 2020-2032
- 6.1. Market Analysis, Insights and Forecast - by Application
- 6.1.1. Home
- 6.1.2. School
- 6.1.3. Others
- 6.2. Market Analysis, Insights and Forecast - by Types
- 6.2.1. Folding Table Lamp
- 6.2.2. Vertical Table Lamp
- 6.2.3. Others
- 6.1. Market Analysis, Insights and Forecast - by Application
- 7. South America Eye Protection Light Analysis, Insights and Forecast, 2020-2032
- 7.1. Market Analysis, Insights and Forecast - by Application
- 7.1.1. Home
- 7.1.2. School
- 7.1.3. Others
- 7.2. Market Analysis, Insights and Forecast - by Types
- 7.2.1. Folding Table Lamp
- 7.2.2. Vertical Table Lamp
- 7.2.3. Others
- 7.1. Market Analysis, Insights and Forecast - by Application
- 8. Europe Eye Protection Light Analysis, Insights and Forecast, 2020-2032
- 8.1. Market Analysis, Insights and Forecast - by Application
- 8.1.1. Home
- 8.1.2. School
- 8.1.3. Others
- 8.2. Market Analysis, Insights and Forecast - by Types
- 8.2.1. Folding Table Lamp
- 8.2.2. Vertical Table Lamp
- 8.2.3. Others
- 8.1. Market Analysis, Insights and Forecast - by Application
- 9. Middle East & Africa Eye Protection Light Analysis, Insights and Forecast, 2020-2032
- 9.1. Market Analysis, Insights and Forecast - by Application
- 9.1.1. Home
- 9.1.2. School
- 9.1.3. Others
- 9.2. Market Analysis, Insights and Forecast - by Types
- 9.2.1. Folding Table Lamp
- 9.2.2. Vertical Table Lamp
- 9.2.3. Others
- 9.1. Market Analysis, Insights and Forecast - by Application
- 10. Asia Pacific Eye Protection Light Analysis, Insights and Forecast, 2020-2032
- 10.1. Market Analysis, Insights and Forecast - by Application
- 10.1.1. Home
- 10.1.2. School
- 10.1.3. Others
- 10.2. Market Analysis, Insights and Forecast - by Types
- 10.2.1. Folding Table Lamp
- 10.2.2. Vertical Table Lamp
- 10.2.3. Others
- 10.1. Market Analysis, Insights and Forecast - by Application
- 11. Competitive Analysis
- 11.1. Global Market Share Analysis 2025
- 11.2. Company Profiles
- 11.2.1 Leimove
- 11.2.1.1. Overview
- 11.2.1.2. Products
- 11.2.1.3. SWOT Analysis
- 11.2.1.4. Recent Developments
- 11.2.1.5. Financials (Based on Availability)
- 11.2.2 Philips
- 11.2.2.1. Overview
- 11.2.2.2. Products
- 11.2.2.3. SWOT Analysis
- 11.2.2.4. Recent Developments
- 11.2.2.5. Financials (Based on Availability)
- 11.2.3 OPPLE
- 11.2.3.1. Overview
- 11.2.3.2. Products
- 11.2.3.3. SWOT Analysis
- 11.2.3.4. Recent Developments
- 11.2.3.5. Financials (Based on Availability)
- 11.2.4 Panasonic
- 11.2.4.1. Overview
- 11.2.4.2. Products
- 11.2.4.3. SWOT Analysis
- 11.2.4.4. Recent Developments
- 11.2.4.5. Financials (Based on Availability)
- 11.2.5 OSRAM
- 11.2.5.1. Overview
- 11.2.5.2. Products
- 11.2.5.3. SWOT Analysis
- 11.2.5.4. Recent Developments
- 11.2.5.5. Financials (Based on Availability)
- 11.2.6 YAGE
- 11.2.6.1. Overview
- 11.2.6.2. Products
- 11.2.6.3. SWOT Analysis
- 11.2.6.4. Recent Developments
- 11.2.6.5. Financials (Based on Availability)
- 11.2.7 Dpled
- 11.2.7.1. Overview
- 11.2.7.2. Products
- 11.2.7.3. SWOT Analysis
- 11.2.7.4. Recent Developments
- 11.2.7.5. Financials (Based on Availability)
- 11.2.8 Midea
- 11.2.8.1. Overview
- 11.2.8.2. Products
- 11.2.8.3. SWOT Analysis
- 11.2.8.4. Recent Developments
- 11.2.8.5. Financials (Based on Availability)
- 11.2.1 Leimove
List of Figures
- Figure 1: Global Eye Protection Light Revenue Breakdown (undefined, %) by Region 2025 & 2033
- Figure 2: Global Eye Protection Light Volume Breakdown (K, %) by Region 2025 & 2033
- Figure 3: North America Eye Protection Light Revenue (undefined), by Application 2025 & 2033
- Figure 4: North America Eye Protection Light Volume (K), by Application 2025 & 2033
- Figure 5: North America Eye Protection Light Revenue Share (%), by Application 2025 & 2033
- Figure 6: North America Eye Protection Light Volume Share (%), by Application 2025 & 2033
- Figure 7: North America Eye Protection Light Revenue (undefined), by Types 2025 & 2033
- Figure 8: North America Eye Protection Light Volume (K), by Types 2025 & 2033
- Figure 9: North America Eye Protection Light Revenue Share (%), by Types 2025 & 2033
- Figure 10: North America Eye Protection Light Volume Share (%), by Types 2025 & 2033
- Figure 11: North America Eye Protection Light Revenue (undefined), by Country 2025 & 2033
- Figure 12: North America Eye Protection Light Volume (K), by Country 2025 & 2033
- Figure 13: North America Eye Protection Light Revenue Share (%), by Country 2025 & 2033
- Figure 14: North America Eye Protection Light Volume Share (%), by Country 2025 & 2033
- Figure 15: South America Eye Protection Light Revenue (undefined), by Application 2025 & 2033
- Figure 16: South America Eye Protection Light Volume (K), by Application 2025 & 2033
- Figure 17: South America Eye Protection Light Revenue Share (%), by Application 2025 & 2033
- Figure 18: South America Eye Protection Light Volume Share (%), by Application 2025 & 2033
- Figure 19: South America Eye Protection Light Revenue (undefined), by Types 2025 & 2033
- Figure 20: South America Eye Protection Light Volume (K), by Types 2025 & 2033
- Figure 21: South America Eye Protection Light Revenue Share (%), by Types 2025 & 2033
- Figure 22: South America Eye Protection Light Volume Share (%), by Types 2025 & 2033
- Figure 23: South America Eye Protection Light Revenue (undefined), by Country 2025 & 2033
- Figure 24: South America Eye Protection Light Volume (K), by Country 2025 & 2033
- Figure 25: South America Eye Protection Light Revenue Share (%), by Country 2025 & 2033
- Figure 26: South America Eye Protection Light Volume Share (%), by Country 2025 & 2033
- Figure 27: Europe Eye Protection Light Revenue (undefined), by Application 2025 & 2033
- Figure 28: Europe Eye Protection Light Volume (K), by Application 2025 & 2033
- Figure 29: Europe Eye Protection Light Revenue Share (%), by Application 2025 & 2033
- Figure 30: Europe Eye Protection Light Volume Share (%), by Application 2025 & 2033
- Figure 31: Europe Eye Protection Light Revenue (undefined), by Types 2025 & 2033
- Figure 32: Europe Eye Protection Light Volume (K), by Types 2025 & 2033
- Figure 33: Europe Eye Protection Light Revenue Share (%), by Types 2025 & 2033
- Figure 34: Europe Eye Protection Light Volume Share (%), by Types 2025 & 2033
- Figure 35: Europe Eye Protection Light Revenue (undefined), by Country 2025 & 2033
- Figure 36: Europe Eye Protection Light Volume (K), by Country 2025 & 2033
- Figure 37: Europe Eye Protection Light Revenue Share (%), by Country 2025 & 2033
- Figure 38: Europe Eye Protection Light Volume Share (%), by Country 2025 & 2033
- Figure 39: Middle East & Africa Eye Protection Light Revenue (undefined), by Application 2025 & 2033
- Figure 40: Middle East & Africa Eye Protection Light Volume (K), by Application 2025 & 2033
- Figure 41: Middle East & Africa Eye Protection Light Revenue Share (%), by Application 2025 & 2033
- Figure 42: Middle East & Africa Eye Protection Light Volume Share (%), by Application 2025 & 2033
- Figure 43: Middle East & Africa Eye Protection Light Revenue (undefined), by Types 2025 & 2033
- Figure 44: Middle East & Africa Eye Protection Light Volume (K), by Types 2025 & 2033
- Figure 45: Middle East & Africa Eye Protection Light Revenue Share (%), by Types 2025 & 2033
- Figure 46: Middle East & Africa Eye Protection Light Volume Share (%), by Types 2025 & 2033
- Figure 47: Middle East & Africa Eye Protection Light Revenue (undefined), by Country 2025 & 2033
- Figure 48: Middle East & Africa Eye Protection Light Volume (K), by Country 2025 & 2033
- Figure 49: Middle East & Africa Eye Protection Light Revenue Share (%), by Country 2025 & 2033
- Figure 50: Middle East & Africa Eye Protection Light Volume Share (%), by Country 2025 & 2033
- Figure 51: Asia Pacific Eye Protection Light Revenue (undefined), by Application 2025 & 2033
- Figure 52: Asia Pacific Eye Protection Light Volume (K), by Application 2025 & 2033
- Figure 53: Asia Pacific Eye Protection Light Revenue Share (%), by Application 2025 & 2033
- Figure 54: Asia Pacific Eye Protection Light Volume Share (%), by Application 2025 & 2033
- Figure 55: Asia Pacific Eye Protection Light Revenue (undefined), by Types 2025 & 2033
- Figure 56: Asia Pacific Eye Protection Light Volume (K), by Types 2025 & 2033
- Figure 57: Asia Pacific Eye Protection Light Revenue Share (%), by Types 2025 & 2033
- Figure 58: Asia Pacific Eye Protection Light Volume Share (%), by Types 2025 & 2033
- Figure 59: Asia Pacific Eye Protection Light Revenue (undefined), by Country 2025 & 2033
- Figure 60: Asia Pacific Eye Protection Light Volume (K), by Country 2025 & 2033
- Figure 61: Asia Pacific Eye Protection Light Revenue Share (%), by Country 2025 & 2033
- Figure 62: Asia Pacific Eye Protection Light Volume Share (%), by Country 2025 & 2033
List of Tables
- Table 1: Global Eye Protection Light Revenue undefined Forecast, by Application 2020 & 2033
- Table 2: Global Eye Protection Light Volume K Forecast, by Application 2020 & 2033
- Table 3: Global Eye Protection Light Revenue undefined Forecast, by Types 2020 & 2033
- Table 4: Global Eye Protection Light Volume K Forecast, by Types 2020 & 2033
- Table 5: Global Eye Protection Light Revenue undefined Forecast, by Region 2020 & 2033
- Table 6: Global Eye Protection Light Volume K Forecast, by Region 2020 & 2033
- Table 7: Global Eye Protection Light Revenue undefined Forecast, by Application 2020 & 2033
- Table 8: Global Eye Protection Light Volume K Forecast, by Application 2020 & 2033
- Table 9: Global Eye Protection Light Revenue undefined Forecast, by Types 2020 & 2033
- Table 10: Global Eye Protection Light Volume K Forecast, by Types 2020 & 2033
- Table 11: Global Eye Protection Light Revenue undefined Forecast, by Country 2020 & 2033
- Table 12: Global Eye Protection Light Volume K Forecast, by Country 2020 & 2033
- Table 13: United States Eye Protection Light Revenue (undefined) Forecast, by Application 2020 & 2033
- Table 14: United States Eye Protection Light Volume (K) Forecast, by Application 2020 & 2033
- Table 15: Canada Eye Protection Light Revenue (undefined) Forecast, by Application 2020 & 2033
- Table 16: Canada Eye Protection Light Volume (K) Forecast, by Application 2020 & 2033
- Table 17: Mexico Eye Protection Light Revenue (undefined) Forecast, by Application 2020 & 2033
- Table 18: Mexico Eye Protection Light Volume (K) Forecast, by Application 2020 & 2033
- Table 19: Global Eye Protection Light Revenue undefined Forecast, by Application 2020 & 2033
- Table 20: Global Eye Protection Light Volume K Forecast, by Application 2020 & 2033
- Table 21: Global Eye Protection Light Revenue undefined Forecast, by Types 2020 & 2033
- Table 22: Global Eye Protection Light Volume K Forecast, by Types 2020 & 2033
- Table 23: Global Eye Protection Light Revenue undefined Forecast, by Country 2020 & 2033
- Table 24: Global Eye Protection Light Volume K Forecast, by Country 2020 & 2033
- Table 25: Brazil Eye Protection Light Revenue (undefined) Forecast, by Application 2020 & 2033
- Table 26: Brazil Eye Protection Light Volume (K) Forecast, by Application 2020 & 2033
- Table 27: Argentina Eye Protection Light Revenue (undefined) Forecast, by Application 2020 & 2033
- Table 28: Argentina Eye Protection Light Volume (K) Forecast, by Application 2020 & 2033
- Table 29: Rest of South America Eye Protection Light Revenue (undefined) Forecast, by Application 2020 & 2033
- Table 30: Rest of South America Eye Protection Light Volume (K) Forecast, by Application 2020 & 2033
- Table 31: Global Eye Protection Light Revenue undefined Forecast, by Application 2020 & 2033
- Table 32: Global Eye Protection Light Volume K Forecast, by Application 2020 & 2033
- Table 33: Global Eye Protection Light Revenue undefined Forecast, by Types 2020 & 2033
- Table 34: Global Eye Protection Light Volume K Forecast, by Types 2020 & 2033
- Table 35: Global Eye Protection Light Revenue undefined Forecast, by Country 2020 & 2033
- Table 36: Global Eye Protection Light Volume K Forecast, by Country 2020 & 2033
- Table 37: United Kingdom Eye Protection Light Revenue (undefined) Forecast, by Application 2020 & 2033
- Table 38: United Kingdom Eye Protection Light Volume (K) Forecast, by Application 2020 & 2033
- Table 39: Germany Eye Protection Light Revenue (undefined) Forecast, by Application 2020 & 2033
- Table 40: Germany Eye Protection Light Volume (K) Forecast, by Application 2020 & 2033
- Table 41: France Eye Protection Light Revenue (undefined) Forecast, by Application 2020 & 2033
- Table 42: France Eye Protection Light Volume (K) Forecast, by Application 2020 & 2033
- Table 43: Italy Eye Protection Light Revenue (undefined) Forecast, by Application 2020 & 2033
- Table 44: Italy Eye Protection Light Volume (K) Forecast, by Application 2020 & 2033
- Table 45: Spain Eye Protection Light Revenue (undefined) Forecast, by Application 2020 & 2033
- Table 46: Spain Eye Protection Light Volume (K) Forecast, by Application 2020 & 2033
- Table 47: Russia Eye Protection Light Revenue (undefined) Forecast, by Application 2020 & 2033
- Table 48: Russia Eye Protection Light Volume (K) Forecast, by Application 2020 & 2033
- Table 49: Benelux Eye Protection Light Revenue (undefined) Forecast, by Application 2020 & 2033
- Table 50: Benelux Eye Protection Light Volume (K) Forecast, by Application 2020 & 2033
- Table 51: Nordics Eye Protection Light Revenue (undefined) Forecast, by Application 2020 & 2033
- Table 52: Nordics Eye Protection Light Volume (K) Forecast, by Application 2020 & 2033
- Table 53: Rest of Europe Eye Protection Light Revenue (undefined) Forecast, by Application 2020 & 2033
- Table 54: Rest of Europe Eye Protection Light Volume (K) Forecast, by Application 2020 & 2033
- Table 55: Global Eye Protection Light Revenue undefined Forecast, by Application 2020 & 2033
- Table 56: Global Eye Protection Light Volume K Forecast, by Application 2020 & 2033
- Table 57: Global Eye Protection Light Revenue undefined Forecast, by Types 2020 & 2033
- Table 58: Global Eye Protection Light Volume K Forecast, by Types 2020 & 2033
- Table 59: Global Eye Protection Light Revenue undefined Forecast, by Country 2020 & 2033
- Table 60: Global Eye Protection Light Volume K Forecast, by Country 2020 & 2033
- Table 61: Turkey Eye Protection Light Revenue (undefined) Forecast, by Application 2020 & 2033
- Table 62: Turkey Eye Protection Light Volume (K) Forecast, by Application 2020 & 2033
- Table 63: Israel Eye Protection Light Revenue (undefined) Forecast, by Application 2020 & 2033
- Table 64: Israel Eye Protection Light Volume (K) Forecast, by Application 2020 & 2033
- Table 65: GCC Eye Protection Light Revenue (undefined) Forecast, by Application 2020 & 2033
- Table 66: GCC Eye Protection Light Volume (K) Forecast, by Application 2020 & 2033
- Table 67: North Africa Eye Protection Light Revenue (undefined) Forecast, by Application 2020 & 2033
- Table 68: North Africa Eye Protection Light Volume (K) Forecast, by Application 2020 & 2033
- Table 69: South Africa Eye Protection Light Revenue (undefined) Forecast, by Application 2020 & 2033
- Table 70: South Africa Eye Protection Light Volume (K) Forecast, by Application 2020 & 2033
- Table 71: Rest of Middle East & Africa Eye Protection Light Revenue (undefined) Forecast, by Application 2020 & 2033
- Table 72: Rest of Middle East & Africa Eye Protection Light Volume (K) Forecast, by Application 2020 & 2033
- Table 73: Global Eye Protection Light Revenue undefined Forecast, by Application 2020 & 2033
- Table 74: Global Eye Protection Light Volume K Forecast, by Application 2020 & 2033
- Table 75: Global Eye Protection Light Revenue undefined Forecast, by Types 2020 & 2033
- Table 76: Global Eye Protection Light Volume K Forecast, by Types 2020 & 2033
- Table 77: Global Eye Protection Light Revenue undefined Forecast, by Country 2020 & 2033
- Table 78: Global Eye Protection Light Volume K Forecast, by Country 2020 & 2033
- Table 79: China Eye Protection Light Revenue (undefined) Forecast, by Application 2020 & 2033
- Table 80: China Eye Protection Light Volume (K) Forecast, by Application 2020 & 2033
- Table 81: India Eye Protection Light Revenue (undefined) Forecast, by Application 2020 & 2033
- Table 82: India Eye Protection Light Volume (K) Forecast, by Application 2020 & 2033
- Table 83: Japan Eye Protection Light Revenue (undefined) Forecast, by Application 2020 & 2033
- Table 84: Japan Eye Protection Light Volume (K) Forecast, by Application 2020 & 2033
- Table 85: South Korea Eye Protection Light Revenue (undefined) Forecast, by Application 2020 & 2033
- Table 86: South Korea Eye Protection Light Volume (K) Forecast, by Application 2020 & 2033
- Table 87: ASEAN Eye Protection Light Revenue (undefined) Forecast, by Application 2020 & 2033
- Table 88: ASEAN Eye Protection Light Volume (K) Forecast, by Application 2020 & 2033
- Table 89: Oceania Eye Protection Light Revenue (undefined) Forecast, by Application 2020 & 2033
- Table 90: Oceania Eye Protection Light Volume (K) Forecast, by Application 2020 & 2033
- Table 91: Rest of Asia Pacific Eye Protection Light Revenue (undefined) Forecast, by Application 2020 & 2033
- Table 92: Rest of Asia Pacific Eye Protection Light Volume (K) Forecast, by Application 2020 & 2033
Frequently Asked Questions
1. What is the projected Compound Annual Growth Rate (CAGR) of the Eye Protection Light?
The projected CAGR is approximately 6.69%.
2. Which companies are prominent players in the Eye Protection Light?
Key companies in the market include Leimove, Philips, OPPLE, Panasonic, OSRAM, YAGE, Dpled, Midea.
3. What are the main segments of the Eye Protection Light?
The market segments include Application, Types.
4. Can you provide details about the market size?
The market size is estimated to be USD XXX N/A as of 2022.
5. What are some drivers contributing to market growth?
N/A
6. What are the notable trends driving market growth?
N/A
7. Are there any restraints impacting market growth?
N/A
8. Can you provide examples of recent developments in the market?
N/A
9. What pricing options are available for accessing the report?
Pricing options include single-user, multi-user, and enterprise licenses priced at USD 3950.00, USD 5925.00, and USD 7900.00 respectively.
10. Is the market size provided in terms of value or volume?
The market size is provided in terms of value, measured in N/A and volume, measured in K.
11. Are there any specific market keywords associated with the report?
Yes, the market keyword associated with the report is "Eye Protection Light," which aids in identifying and referencing the specific market segment covered.
12. How do I determine which pricing option suits my needs best?
The pricing options vary based on user requirements and access needs. Individual users may opt for single-user licenses, while businesses requiring broader access may choose multi-user or enterprise licenses for cost-effective access to the report.
13. Are there any additional resources or data provided in the Eye Protection Light report?
While the report offers comprehensive insights, it's advisable to review the specific contents or supplementary materials provided to ascertain if additional resources or data are available.
14. How can I stay updated on further developments or reports in the Eye Protection Light?
To stay informed about further developments, trends, and reports in the Eye Protection Light, consider subscribing to industry newsletters, following relevant companies and organizations, or regularly checking reputable industry news sources and publications.
Methodology
Step 1 - Identification of Relevant Samples Size from Population Database


Step 2 - Approaches for Defining Global Market Size (Value, Volume* & Price*)

Note*: In applicable scenarios
Step 3 - Data Sources
Primary Research
- Web Analytics
- Survey Reports
- Research Institute
- Latest Research Reports
- Opinion Leaders
Secondary Research
- Annual Reports
- White Paper
- Latest Press Release
- Industry Association
- Paid Database
- Investor Presentations

Step 4 - Data Triangulation
Involves using different sources of information in order to increase the validity of a study
These sources are likely to be stakeholders in a program - participants, other researchers, program staff, other community members, and so on.
Then we put all data in single framework & apply various statistical tools to find out the dynamic on the market.
During the analysis stage, feedback from the stakeholder groups would be compared to determine areas of agreement as well as areas of divergence