

Key Insights
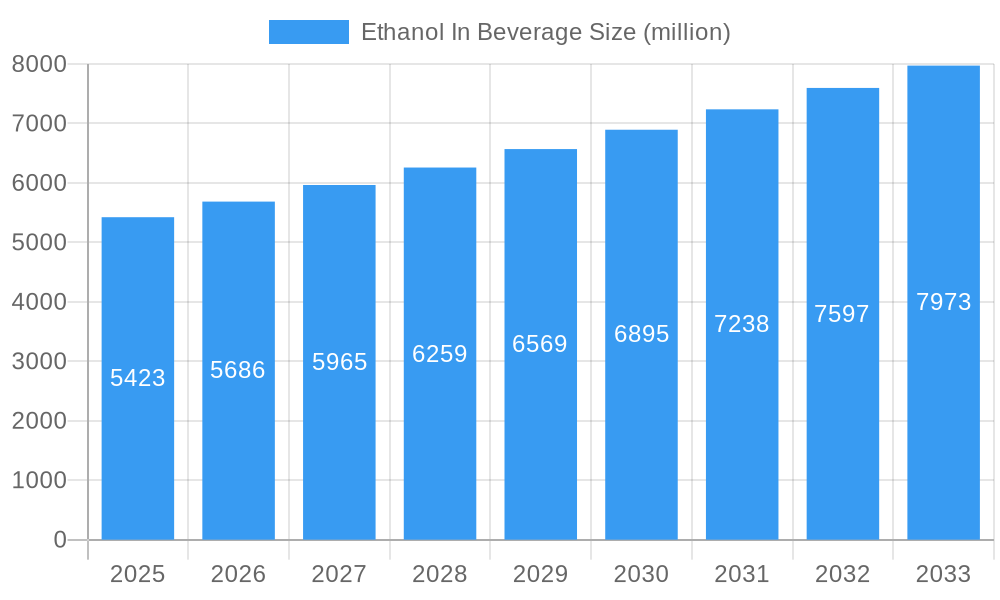
The global ethanol in beverage market, valued at $5.423 billion in 2025, is projected to experience robust growth, driven by increasing demand for alcoholic and non-alcoholic beverages containing ethanol. The Compound Annual Growth Rate (CAGR) of 4.8% from 2025 to 2033 indicates a significant expansion in market size, reaching an estimated $7.8 billion by 2033. This growth is fueled by several factors including the rising popularity of ready-to-drink (RTD) cocktails, craft beers, and flavored alcoholic beverages, alongside the continued demand for ethanol in traditional spirits and wines. Consumer preference shifts towards premium and diverse beverage options further contribute to this market expansion. While potential regulatory hurdles and fluctuating raw material prices pose some challenges, innovative product development and strategic partnerships within the industry are expected to mitigate these restraints. The market is segmented by various beverage types (e.g., spirits, beer, wine, RTDs), geographical regions, and production methods, reflecting diverse consumer preferences and manufacturing capabilities across the globe. Key players such as MGP Ingredients, Cargill, and ADM are leveraging their expertise and market presence to capitalize on emerging trends and solidify their positions in this growing market.

Ethanol In Beverage Market Size (In Billion)
The competitive landscape is dynamic, with established multinational corporations and regional players vying for market share. Growth strategies employed include mergers and acquisitions, capacity expansions, and investments in research and development of sustainable and cost-effective ethanol production processes. Furthermore, increasing consumer awareness regarding sustainability and responsible consumption is influencing product development, leading to a greater focus on organic and ethically sourced ethanol. The market is expected to continue its upward trajectory, benefiting from rising disposable incomes in emerging economies and the sustained popularity of alcoholic and non-alcoholic beverages containing ethanol. This positive outlook suggests considerable investment opportunities and potential for continued growth in the coming years.
Ethanol In Beverage Company Market Share
Ethanol In Beverage Market Report: 2019-2033 Forecast
Dive deep into the dynamic world of ethanol in beverages with this comprehensive market report, providing actionable insights for strategic decision-making. This in-depth analysis covers the period from 2019 to 2033, with a focus on the crucial 2025-2033 forecast period. The report meticulously examines market dynamics, industry trends, leading players, and emerging opportunities within the multi-billion dollar ethanol in beverage sector. Projected to reach xx million by 2033, this market presents significant potential for investors and industry stakeholders.
This report offers an unparalleled understanding of the global Ethanol In Beverage market, leveraging rigorous research methodologies and extensive data analysis to provide a clear and concise picture of the landscape. Key players such as MGP Ingredients, Cargill, Tereos, ADM, and others are examined, offering competitive intelligence crucial for strategic planning.
Ethanol In Beverage Market Dynamics & Concentration
The global ethanol in beverage market, valued at xx million in 2025, demonstrates a moderately consolidated structure. Major players like Cargill and ADM hold significant market share, exceeding xx% collectively, while numerous smaller players contribute to the remaining market. This concentration is influenced by economies of scale in production and distribution, as well as strong brand recognition among consumers.
Market Dynamics:
- Innovation Drivers: The rise of premium and craft beverages fuels demand for high-quality ethanol, driving innovation in purification and flavoring technologies.
- Regulatory Frameworks: Varying regulations across regions concerning ethanol purity and labeling significantly impact market dynamics, creating both opportunities and challenges.
- Product Substitutes: The market faces competition from synthetic alternatives, although natural ethanol's perceived superior quality and consumer preference sustain its dominance.
- End-User Trends: Growing consumer demand for premium and functional beverages, coupled with increasing health consciousness, shapes the market's trajectory.
- M&A Activities: The past five years have witnessed xx M&A deals, primarily focused on consolidating production capacity and expanding geographic reach. This trend is expected to continue, resulting in further market concentration.
Ethanol In Beverage Industry Trends & Analysis
The ethanol in beverage market exhibits robust growth, projected to achieve a CAGR of xx% during 2025-2033. This growth is driven by several factors, including:
- Rising disposable incomes: Increased purchasing power, especially in developing economies, fuels demand for premium beverages.
- Shifting consumer preferences: Growing preference for healthier, natural, and premium beverages enhances the appeal of ethanol derived from natural sources.
- Technological advancements: Innovations in fermentation, purification, and flavoring techniques contribute to a wider range of high-quality products.
- Competitive dynamics: Intense competition among key players fosters innovation and drives down prices, making ethanol-based beverages more accessible to a wider consumer base. Market penetration of ethanol in various beverage segments continues to grow, reaching approximately xx% in 2025.
Leading Markets & Segments in Ethanol In Beverage
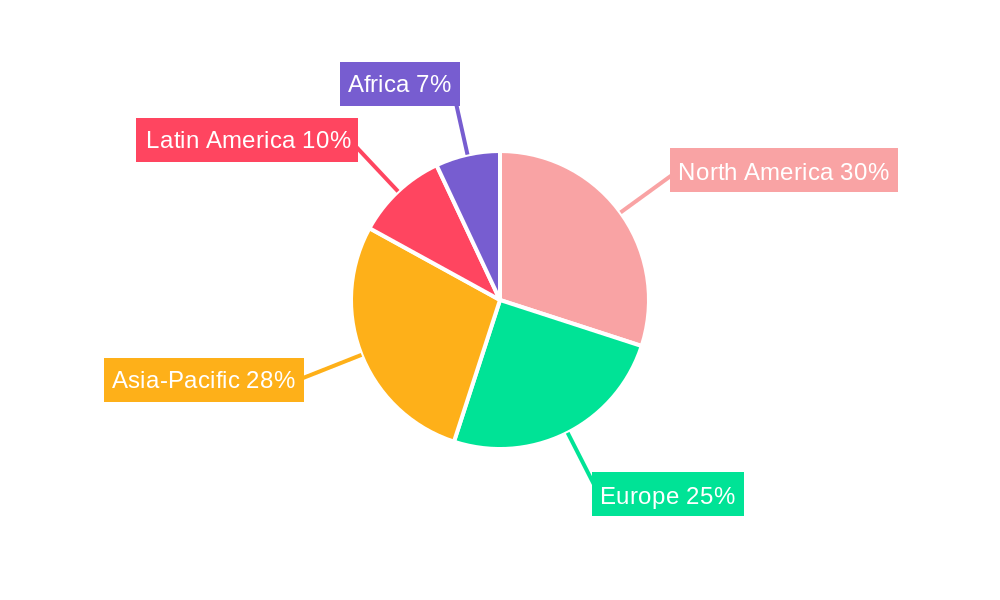
The North American market currently dominates the global ethanol in beverage sector, representing approximately xx% of the total market share in 2025. This dominance is primarily attributed to:
- Established infrastructure: Well-developed agricultural infrastructure and established ethanol production facilities are crucial for supplying the beverage industry.
- Favorable regulatory environment: Supportive regulations and policies facilitate the growth of the ethanol market.
- Strong consumer demand: High per capita consumption of alcoholic beverages and a preference for premium products drive high demand.
Other key markets include:
- Europe: Strong demand for premium spirits and a focus on sustainable practices.
- Asia-Pacific: Rapidly growing economies and a rising middle class fuel demand growth.
Ethanol In Beverage Product Developments
Recent years have seen significant advancements in ethanol production, focusing on improving purity, enhancing flavor profiles, and reducing production costs. Innovations in fermentation technology and purification processes have led to higher-quality ethanol, enhancing the taste and quality of beverages. This improved quality translates into a competitive advantage for beverage manufacturers, further driving market growth.
Key Drivers of Ethanol In Beverage Growth
Several key factors contribute to the growth of the ethanol in beverage market:
- Technological advancements: Innovations in fermentation, distillation, and purification processes enhance ethanol quality and efficiency.
- Economic growth: Rising disposable incomes in developing countries boost demand for premium beverages containing ethanol.
- Favorable government policies: Supportive regulations and incentives encourage ethanol production and consumption.
Challenges in the Ethanol In Beverage Market
The market faces challenges, including:
- Fluctuating raw material prices: Changes in the price of feedstocks impact ethanol production costs.
- Stringent regulatory requirements: Compliance with environmental and safety regulations adds complexity and cost.
- Intense competition: The presence of numerous players results in price pressure and competitive dynamics.
Emerging Opportunities in Ethanol In Beverage
The market presents several growth opportunities:
- Expansion into emerging markets: Untapped potential in developing countries drives expansion opportunities.
- Strategic partnerships: Collaborations between ethanol producers and beverage manufacturers accelerate market penetration.
- Product diversification: Introducing new and innovative ethanol-based beverages with unique flavor profiles appeals to consumer preferences.
Leading Players in the Ethanol In Beverage Sector
- MGP Ingredients
- Cargill
- Tereos
- ADM
- SDIC JILIN
- China New Borun
- GPC
- KAI
- CropEnergies
- Greenfield
- Cristal Union
- Euro-Alkohol
- ALCOGROUP
- Taicang Xintal Alcohol
- Manildra
- Bruggemann Alcohol Heilbronn
- Wilmar BioEthanol
- Bangkok Alcohol Industrial
Key Milestones in Ethanol In Beverage Industry
- 2020: Increased adoption of sustainable ethanol production practices.
- 2021: Launch of several new premium ethanol-based beverages.
- 2022: Significant investments in ethanol production capacity expansion.
- 2023: Growing adoption of innovative fermentation technologies.
Strategic Outlook for Ethanol In Beverage Market
The ethanol in beverage market is poised for continued growth, driven by technological advancements, increasing consumer demand, and strategic expansions into new markets. Proactive adaptation to evolving consumer preferences, investment in sustainable production practices, and strategic partnerships will be crucial for long-term success. The predicted xx million market size by 2033 presents a significant opportunity for existing players and new entrants alike.
Ethanol In Beverage Segmentation
-
1. Application
- 1.1. Alcohol Beverage
- 1.2. Vinegar
- 1.3. Others
-
2. Type
- 2.1. Grains
- 2.2. Sugarcane
- 2.3. Fruits
- 2.4. Others
Ethanol In Beverage Segmentation By Geography
-
1. North America
- 1.1. United States
- 1.2. Canada
- 1.3. Mexico
-
2. South America
- 2.1. Brazil
- 2.2. Argentina
- 2.3. Rest of South America
-
3. Europe
- 3.1. United Kingdom
- 3.2. Germany
- 3.3. France
- 3.4. Italy
- 3.5. Spain
- 3.6. Russia
- 3.7. Benelux
- 3.8. Nordics
- 3.9. Rest of Europe
-
4. Middle East & Africa
- 4.1. Turkey
- 4.2. Israel
- 4.3. GCC
- 4.4. North Africa
- 4.5. South Africa
- 4.6. Rest of Middle East & Africa
-
5. Asia Pacific
- 5.1. China
- 5.2. India
- 5.3. Japan
- 5.4. South Korea
- 5.5. ASEAN
- 5.6. Oceania
- 5.7. Rest of Asia Pacific
Ethanol In Beverage Regional Market Share
Geographic Coverage of Ethanol In Beverage
Ethanol In Beverage REPORT HIGHLIGHTS
| Aspects | Details |
|---|---|
| Study Period | 2020-2034 |
| Base Year | 2025 |
| Estimated Year | 2026 |
| Forecast Period | 2026-2034 |
| Historical Period | 2020-2025 |
| Growth Rate | CAGR of 4.8% from 2020-2034 |
| Segmentation |
|
Table of Contents
- 1. Introduction
- 1.1. Research Scope
- 1.2. Market Segmentation
- 1.3. Research Methodology
- 1.4. Definitions and Assumptions
- 2. Executive Summary
- 2.1. Introduction
- 3. Market Dynamics
- 3.1. Introduction
- 3.2. Market Drivers
- 3.3. Market Restrains
- 3.4. Market Trends
- 4. Market Factor Analysis
- 4.1. Porters Five Forces
- 4.2. Supply/Value Chain
- 4.3. PESTEL analysis
- 4.4. Market Entropy
- 4.5. Patent/Trademark Analysis
- 5. Global Ethanol In Beverage Analysis, Insights and Forecast, 2020-2032
- 5.1. Market Analysis, Insights and Forecast - by Application
- 5.1.1. Alcohol Beverage
- 5.1.2. Vinegar
- 5.1.3. Others
- 5.2. Market Analysis, Insights and Forecast - by Type
- 5.2.1. Grains
- 5.2.2. Sugarcane
- 5.2.3. Fruits
- 5.2.4. Others
- 5.3. Market Analysis, Insights and Forecast - by Region
- 5.3.1. North America
- 5.3.2. South America
- 5.3.3. Europe
- 5.3.4. Middle East & Africa
- 5.3.5. Asia Pacific
- 5.1. Market Analysis, Insights and Forecast - by Application
- 6. North America Ethanol In Beverage Analysis, Insights and Forecast, 2020-2032
- 6.1. Market Analysis, Insights and Forecast - by Application
- 6.1.1. Alcohol Beverage
- 6.1.2. Vinegar
- 6.1.3. Others
- 6.2. Market Analysis, Insights and Forecast - by Type
- 6.2.1. Grains
- 6.2.2. Sugarcane
- 6.2.3. Fruits
- 6.2.4. Others
- 6.1. Market Analysis, Insights and Forecast - by Application
- 7. South America Ethanol In Beverage Analysis, Insights and Forecast, 2020-2032
- 7.1. Market Analysis, Insights and Forecast - by Application
- 7.1.1. Alcohol Beverage
- 7.1.2. Vinegar
- 7.1.3. Others
- 7.2. Market Analysis, Insights and Forecast - by Type
- 7.2.1. Grains
- 7.2.2. Sugarcane
- 7.2.3. Fruits
- 7.2.4. Others
- 7.1. Market Analysis, Insights and Forecast - by Application
- 8. Europe Ethanol In Beverage Analysis, Insights and Forecast, 2020-2032
- 8.1. Market Analysis, Insights and Forecast - by Application
- 8.1.1. Alcohol Beverage
- 8.1.2. Vinegar
- 8.1.3. Others
- 8.2. Market Analysis, Insights and Forecast - by Type
- 8.2.1. Grains
- 8.2.2. Sugarcane
- 8.2.3. Fruits
- 8.2.4. Others
- 8.1. Market Analysis, Insights and Forecast - by Application
- 9. Middle East & Africa Ethanol In Beverage Analysis, Insights and Forecast, 2020-2032
- 9.1. Market Analysis, Insights and Forecast - by Application
- 9.1.1. Alcohol Beverage
- 9.1.2. Vinegar
- 9.1.3. Others
- 9.2. Market Analysis, Insights and Forecast - by Type
- 9.2.1. Grains
- 9.2.2. Sugarcane
- 9.2.3. Fruits
- 9.2.4. Others
- 9.1. Market Analysis, Insights and Forecast - by Application
- 10. Asia Pacific Ethanol In Beverage Analysis, Insights and Forecast, 2020-2032
- 10.1. Market Analysis, Insights and Forecast - by Application
- 10.1.1. Alcohol Beverage
- 10.1.2. Vinegar
- 10.1.3. Others
- 10.2. Market Analysis, Insights and Forecast - by Type
- 10.2.1. Grains
- 10.2.2. Sugarcane
- 10.2.3. Fruits
- 10.2.4. Others
- 10.1. Market Analysis, Insights and Forecast - by Application
- 11. Competitive Analysis
- 11.1. Global Market Share Analysis 2025
- 11.2. Company Profiles
- 11.2.1 MGP Ingredients
- 11.2.1.1. Overview
- 11.2.1.2. Products
- 11.2.1.3. SWOT Analysis
- 11.2.1.4. Recent Developments
- 11.2.1.5. Financials (Based on Availability)
- 11.2.2 Cargill
- 11.2.2.1. Overview
- 11.2.2.2. Products
- 11.2.2.3. SWOT Analysis
- 11.2.2.4. Recent Developments
- 11.2.2.5. Financials (Based on Availability)
- 11.2.3 Tereos
- 11.2.3.1. Overview
- 11.2.3.2. Products
- 11.2.3.3. SWOT Analysis
- 11.2.3.4. Recent Developments
- 11.2.3.5. Financials (Based on Availability)
- 11.2.4 ADM
- 11.2.4.1. Overview
- 11.2.4.2. Products
- 11.2.4.3. SWOT Analysis
- 11.2.4.4. Recent Developments
- 11.2.4.5. Financials (Based on Availability)
- 11.2.5 SDIC JILIN
- 11.2.5.1. Overview
- 11.2.5.2. Products
- 11.2.5.3. SWOT Analysis
- 11.2.5.4. Recent Developments
- 11.2.5.5. Financials (Based on Availability)
- 11.2.6 China New Borun
- 11.2.6.1. Overview
- 11.2.6.2. Products
- 11.2.6.3. SWOT Analysis
- 11.2.6.4. Recent Developments
- 11.2.6.5. Financials (Based on Availability)
- 11.2.7 GPC
- 11.2.7.1. Overview
- 11.2.7.2. Products
- 11.2.7.3. SWOT Analysis
- 11.2.7.4. Recent Developments
- 11.2.7.5. Financials (Based on Availability)
- 11.2.8 KAI
- 11.2.8.1. Overview
- 11.2.8.2. Products
- 11.2.8.3. SWOT Analysis
- 11.2.8.4. Recent Developments
- 11.2.8.5. Financials (Based on Availability)
- 11.2.9 CropEnergies
- 11.2.9.1. Overview
- 11.2.9.2. Products
- 11.2.9.3. SWOT Analysis
- 11.2.9.4. Recent Developments
- 11.2.9.5. Financials (Based on Availability)
- 11.2.10 Greenfield
- 11.2.10.1. Overview
- 11.2.10.2. Products
- 11.2.10.3. SWOT Analysis
- 11.2.10.4. Recent Developments
- 11.2.10.5. Financials (Based on Availability)
- 11.2.11 Cristal Union
- 11.2.11.1. Overview
- 11.2.11.2. Products
- 11.2.11.3. SWOT Analysis
- 11.2.11.4. Recent Developments
- 11.2.11.5. Financials (Based on Availability)
- 11.2.12 Euro-Alkohol
- 11.2.12.1. Overview
- 11.2.12.2. Products
- 11.2.12.3. SWOT Analysis
- 11.2.12.4. Recent Developments
- 11.2.12.5. Financials (Based on Availability)
- 11.2.13 ALCOGROUP
- 11.2.13.1. Overview
- 11.2.13.2. Products
- 11.2.13.3. SWOT Analysis
- 11.2.13.4. Recent Developments
- 11.2.13.5. Financials (Based on Availability)
- 11.2.14 Taicang Xintal Alcohol
- 11.2.14.1. Overview
- 11.2.14.2. Products
- 11.2.14.3. SWOT Analysis
- 11.2.14.4. Recent Developments
- 11.2.14.5. Financials (Based on Availability)
- 11.2.15 Manildra
- 11.2.15.1. Overview
- 11.2.15.2. Products
- 11.2.15.3. SWOT Analysis
- 11.2.15.4. Recent Developments
- 11.2.15.5. Financials (Based on Availability)
- 11.2.16 BruggemannAlcohol Heilbronn
- 11.2.16.1. Overview
- 11.2.16.2. Products
- 11.2.16.3. SWOT Analysis
- 11.2.16.4. Recent Developments
- 11.2.16.5. Financials (Based on Availability)
- 11.2.17 Wilmar BioEthanol
- 11.2.17.1. Overview
- 11.2.17.2. Products
- 11.2.17.3. SWOT Analysis
- 11.2.17.4. Recent Developments
- 11.2.17.5. Financials (Based on Availability)
- 11.2.18 Bangkok Alcohol Industrial
- 11.2.18.1. Overview
- 11.2.18.2. Products
- 11.2.18.3. SWOT Analysis
- 11.2.18.4. Recent Developments
- 11.2.18.5. Financials (Based on Availability)
- 11.2.1 MGP Ingredients
List of Figures
- Figure 1: Global Ethanol In Beverage Revenue Breakdown (million, %) by Region 2025 & 2033
- Figure 2: Global Ethanol In Beverage Volume Breakdown (K, %) by Region 2025 & 2033
- Figure 3: North America Ethanol In Beverage Revenue (million), by Application 2025 & 2033
- Figure 4: North America Ethanol In Beverage Volume (K), by Application 2025 & 2033
- Figure 5: North America Ethanol In Beverage Revenue Share (%), by Application 2025 & 2033
- Figure 6: North America Ethanol In Beverage Volume Share (%), by Application 2025 & 2033
- Figure 7: North America Ethanol In Beverage Revenue (million), by Type 2025 & 2033
- Figure 8: North America Ethanol In Beverage Volume (K), by Type 2025 & 2033
- Figure 9: North America Ethanol In Beverage Revenue Share (%), by Type 2025 & 2033
- Figure 10: North America Ethanol In Beverage Volume Share (%), by Type 2025 & 2033
- Figure 11: North America Ethanol In Beverage Revenue (million), by Country 2025 & 2033
- Figure 12: North America Ethanol In Beverage Volume (K), by Country 2025 & 2033
- Figure 13: North America Ethanol In Beverage Revenue Share (%), by Country 2025 & 2033
- Figure 14: North America Ethanol In Beverage Volume Share (%), by Country 2025 & 2033
- Figure 15: South America Ethanol In Beverage Revenue (million), by Application 2025 & 2033
- Figure 16: South America Ethanol In Beverage Volume (K), by Application 2025 & 2033
- Figure 17: South America Ethanol In Beverage Revenue Share (%), by Application 2025 & 2033
- Figure 18: South America Ethanol In Beverage Volume Share (%), by Application 2025 & 2033
- Figure 19: South America Ethanol In Beverage Revenue (million), by Type 2025 & 2033
- Figure 20: South America Ethanol In Beverage Volume (K), by Type 2025 & 2033
- Figure 21: South America Ethanol In Beverage Revenue Share (%), by Type 2025 & 2033
- Figure 22: South America Ethanol In Beverage Volume Share (%), by Type 2025 & 2033
- Figure 23: South America Ethanol In Beverage Revenue (million), by Country 2025 & 2033
- Figure 24: South America Ethanol In Beverage Volume (K), by Country 2025 & 2033
- Figure 25: South America Ethanol In Beverage Revenue Share (%), by Country 2025 & 2033
- Figure 26: South America Ethanol In Beverage Volume Share (%), by Country 2025 & 2033
- Figure 27: Europe Ethanol In Beverage Revenue (million), by Application 2025 & 2033
- Figure 28: Europe Ethanol In Beverage Volume (K), by Application 2025 & 2033
- Figure 29: Europe Ethanol In Beverage Revenue Share (%), by Application 2025 & 2033
- Figure 30: Europe Ethanol In Beverage Volume Share (%), by Application 2025 & 2033
- Figure 31: Europe Ethanol In Beverage Revenue (million), by Type 2025 & 2033
- Figure 32: Europe Ethanol In Beverage Volume (K), by Type 2025 & 2033
- Figure 33: Europe Ethanol In Beverage Revenue Share (%), by Type 2025 & 2033
- Figure 34: Europe Ethanol In Beverage Volume Share (%), by Type 2025 & 2033
- Figure 35: Europe Ethanol In Beverage Revenue (million), by Country 2025 & 2033
- Figure 36: Europe Ethanol In Beverage Volume (K), by Country 2025 & 2033
- Figure 37: Europe Ethanol In Beverage Revenue Share (%), by Country 2025 & 2033
- Figure 38: Europe Ethanol In Beverage Volume Share (%), by Country 2025 & 2033
- Figure 39: Middle East & Africa Ethanol In Beverage Revenue (million), by Application 2025 & 2033
- Figure 40: Middle East & Africa Ethanol In Beverage Volume (K), by Application 2025 & 2033
- Figure 41: Middle East & Africa Ethanol In Beverage Revenue Share (%), by Application 2025 & 2033
- Figure 42: Middle East & Africa Ethanol In Beverage Volume Share (%), by Application 2025 & 2033
- Figure 43: Middle East & Africa Ethanol In Beverage Revenue (million), by Type 2025 & 2033
- Figure 44: Middle East & Africa Ethanol In Beverage Volume (K), by Type 2025 & 2033
- Figure 45: Middle East & Africa Ethanol In Beverage Revenue Share (%), by Type 2025 & 2033
- Figure 46: Middle East & Africa Ethanol In Beverage Volume Share (%), by Type 2025 & 2033
- Figure 47: Middle East & Africa Ethanol In Beverage Revenue (million), by Country 2025 & 2033
- Figure 48: Middle East & Africa Ethanol In Beverage Volume (K), by Country 2025 & 2033
- Figure 49: Middle East & Africa Ethanol In Beverage Revenue Share (%), by Country 2025 & 2033
- Figure 50: Middle East & Africa Ethanol In Beverage Volume Share (%), by Country 2025 & 2033
- Figure 51: Asia Pacific Ethanol In Beverage Revenue (million), by Application 2025 & 2033
- Figure 52: Asia Pacific Ethanol In Beverage Volume (K), by Application 2025 & 2033
- Figure 53: Asia Pacific Ethanol In Beverage Revenue Share (%), by Application 2025 & 2033
- Figure 54: Asia Pacific Ethanol In Beverage Volume Share (%), by Application 2025 & 2033
- Figure 55: Asia Pacific Ethanol In Beverage Revenue (million), by Type 2025 & 2033
- Figure 56: Asia Pacific Ethanol In Beverage Volume (K), by Type 2025 & 2033
- Figure 57: Asia Pacific Ethanol In Beverage Revenue Share (%), by Type 2025 & 2033
- Figure 58: Asia Pacific Ethanol In Beverage Volume Share (%), by Type 2025 & 2033
- Figure 59: Asia Pacific Ethanol In Beverage Revenue (million), by Country 2025 & 2033
- Figure 60: Asia Pacific Ethanol In Beverage Volume (K), by Country 2025 & 2033
- Figure 61: Asia Pacific Ethanol In Beverage Revenue Share (%), by Country 2025 & 2033
- Figure 62: Asia Pacific Ethanol In Beverage Volume Share (%), by Country 2025 & 2033
List of Tables
- Table 1: Global Ethanol In Beverage Revenue million Forecast, by Application 2020 & 2033
- Table 2: Global Ethanol In Beverage Volume K Forecast, by Application 2020 & 2033
- Table 3: Global Ethanol In Beverage Revenue million Forecast, by Type 2020 & 2033
- Table 4: Global Ethanol In Beverage Volume K Forecast, by Type 2020 & 2033
- Table 5: Global Ethanol In Beverage Revenue million Forecast, by Region 2020 & 2033
- Table 6: Global Ethanol In Beverage Volume K Forecast, by Region 2020 & 2033
- Table 7: Global Ethanol In Beverage Revenue million Forecast, by Application 2020 & 2033
- Table 8: Global Ethanol In Beverage Volume K Forecast, by Application 2020 & 2033
- Table 9: Global Ethanol In Beverage Revenue million Forecast, by Type 2020 & 2033
- Table 10: Global Ethanol In Beverage Volume K Forecast, by Type 2020 & 2033
- Table 11: Global Ethanol In Beverage Revenue million Forecast, by Country 2020 & 2033
- Table 12: Global Ethanol In Beverage Volume K Forecast, by Country 2020 & 2033
- Table 13: United States Ethanol In Beverage Revenue (million) Forecast, by Application 2020 & 2033
- Table 14: United States Ethanol In Beverage Volume (K) Forecast, by Application 2020 & 2033
- Table 15: Canada Ethanol In Beverage Revenue (million) Forecast, by Application 2020 & 2033
- Table 16: Canada Ethanol In Beverage Volume (K) Forecast, by Application 2020 & 2033
- Table 17: Mexico Ethanol In Beverage Revenue (million) Forecast, by Application 2020 & 2033
- Table 18: Mexico Ethanol In Beverage Volume (K) Forecast, by Application 2020 & 2033
- Table 19: Global Ethanol In Beverage Revenue million Forecast, by Application 2020 & 2033
- Table 20: Global Ethanol In Beverage Volume K Forecast, by Application 2020 & 2033
- Table 21: Global Ethanol In Beverage Revenue million Forecast, by Type 2020 & 2033
- Table 22: Global Ethanol In Beverage Volume K Forecast, by Type 2020 & 2033
- Table 23: Global Ethanol In Beverage Revenue million Forecast, by Country 2020 & 2033
- Table 24: Global Ethanol In Beverage Volume K Forecast, by Country 2020 & 2033
- Table 25: Brazil Ethanol In Beverage Revenue (million) Forecast, by Application 2020 & 2033
- Table 26: Brazil Ethanol In Beverage Volume (K) Forecast, by Application 2020 & 2033
- Table 27: Argentina Ethanol In Beverage Revenue (million) Forecast, by Application 2020 & 2033
- Table 28: Argentina Ethanol In Beverage Volume (K) Forecast, by Application 2020 & 2033
- Table 29: Rest of South America Ethanol In Beverage Revenue (million) Forecast, by Application 2020 & 2033
- Table 30: Rest of South America Ethanol In Beverage Volume (K) Forecast, by Application 2020 & 2033
- Table 31: Global Ethanol In Beverage Revenue million Forecast, by Application 2020 & 2033
- Table 32: Global Ethanol In Beverage Volume K Forecast, by Application 2020 & 2033
- Table 33: Global Ethanol In Beverage Revenue million Forecast, by Type 2020 & 2033
- Table 34: Global Ethanol In Beverage Volume K Forecast, by Type 2020 & 2033
- Table 35: Global Ethanol In Beverage Revenue million Forecast, by Country 2020 & 2033
- Table 36: Global Ethanol In Beverage Volume K Forecast, by Country 2020 & 2033
- Table 37: United Kingdom Ethanol In Beverage Revenue (million) Forecast, by Application 2020 & 2033
- Table 38: United Kingdom Ethanol In Beverage Volume (K) Forecast, by Application 2020 & 2033
- Table 39: Germany Ethanol In Beverage Revenue (million) Forecast, by Application 2020 & 2033
- Table 40: Germany Ethanol In Beverage Volume (K) Forecast, by Application 2020 & 2033
- Table 41: France Ethanol In Beverage Revenue (million) Forecast, by Application 2020 & 2033
- Table 42: France Ethanol In Beverage Volume (K) Forecast, by Application 2020 & 2033
- Table 43: Italy Ethanol In Beverage Revenue (million) Forecast, by Application 2020 & 2033
- Table 44: Italy Ethanol In Beverage Volume (K) Forecast, by Application 2020 & 2033
- Table 45: Spain Ethanol In Beverage Revenue (million) Forecast, by Application 2020 & 2033
- Table 46: Spain Ethanol In Beverage Volume (K) Forecast, by Application 2020 & 2033
- Table 47: Russia Ethanol In Beverage Revenue (million) Forecast, by Application 2020 & 2033
- Table 48: Russia Ethanol In Beverage Volume (K) Forecast, by Application 2020 & 2033
- Table 49: Benelux Ethanol In Beverage Revenue (million) Forecast, by Application 2020 & 2033
- Table 50: Benelux Ethanol In Beverage Volume (K) Forecast, by Application 2020 & 2033
- Table 51: Nordics Ethanol In Beverage Revenue (million) Forecast, by Application 2020 & 2033
- Table 52: Nordics Ethanol In Beverage Volume (K) Forecast, by Application 2020 & 2033
- Table 53: Rest of Europe Ethanol In Beverage Revenue (million) Forecast, by Application 2020 & 2033
- Table 54: Rest of Europe Ethanol In Beverage Volume (K) Forecast, by Application 2020 & 2033
- Table 55: Global Ethanol In Beverage Revenue million Forecast, by Application 2020 & 2033
- Table 56: Global Ethanol In Beverage Volume K Forecast, by Application 2020 & 2033
- Table 57: Global Ethanol In Beverage Revenue million Forecast, by Type 2020 & 2033
- Table 58: Global Ethanol In Beverage Volume K Forecast, by Type 2020 & 2033
- Table 59: Global Ethanol In Beverage Revenue million Forecast, by Country 2020 & 2033
- Table 60: Global Ethanol In Beverage Volume K Forecast, by Country 2020 & 2033
- Table 61: Turkey Ethanol In Beverage Revenue (million) Forecast, by Application 2020 & 2033
- Table 62: Turkey Ethanol In Beverage Volume (K) Forecast, by Application 2020 & 2033
- Table 63: Israel Ethanol In Beverage Revenue (million) Forecast, by Application 2020 & 2033
- Table 64: Israel Ethanol In Beverage Volume (K) Forecast, by Application 2020 & 2033
- Table 65: GCC Ethanol In Beverage Revenue (million) Forecast, by Application 2020 & 2033
- Table 66: GCC Ethanol In Beverage Volume (K) Forecast, by Application 2020 & 2033
- Table 67: North Africa Ethanol In Beverage Revenue (million) Forecast, by Application 2020 & 2033
- Table 68: North Africa Ethanol In Beverage Volume (K) Forecast, by Application 2020 & 2033
- Table 69: South Africa Ethanol In Beverage Revenue (million) Forecast, by Application 2020 & 2033
- Table 70: South Africa Ethanol In Beverage Volume (K) Forecast, by Application 2020 & 2033
- Table 71: Rest of Middle East & Africa Ethanol In Beverage Revenue (million) Forecast, by Application 2020 & 2033
- Table 72: Rest of Middle East & Africa Ethanol In Beverage Volume (K) Forecast, by Application 2020 & 2033
- Table 73: Global Ethanol In Beverage Revenue million Forecast, by Application 2020 & 2033
- Table 74: Global Ethanol In Beverage Volume K Forecast, by Application 2020 & 2033
- Table 75: Global Ethanol In Beverage Revenue million Forecast, by Type 2020 & 2033
- Table 76: Global Ethanol In Beverage Volume K Forecast, by Type 2020 & 2033
- Table 77: Global Ethanol In Beverage Revenue million Forecast, by Country 2020 & 2033
- Table 78: Global Ethanol In Beverage Volume K Forecast, by Country 2020 & 2033
- Table 79: China Ethanol In Beverage Revenue (million) Forecast, by Application 2020 & 2033
- Table 80: China Ethanol In Beverage Volume (K) Forecast, by Application 2020 & 2033
- Table 81: India Ethanol In Beverage Revenue (million) Forecast, by Application 2020 & 2033
- Table 82: India Ethanol In Beverage Volume (K) Forecast, by Application 2020 & 2033
- Table 83: Japan Ethanol In Beverage Revenue (million) Forecast, by Application 2020 & 2033
- Table 84: Japan Ethanol In Beverage Volume (K) Forecast, by Application 2020 & 2033
- Table 85: South Korea Ethanol In Beverage Revenue (million) Forecast, by Application 2020 & 2033
- Table 86: South Korea Ethanol In Beverage Volume (K) Forecast, by Application 2020 & 2033
- Table 87: ASEAN Ethanol In Beverage Revenue (million) Forecast, by Application 2020 & 2033
- Table 88: ASEAN Ethanol In Beverage Volume (K) Forecast, by Application 2020 & 2033
- Table 89: Oceania Ethanol In Beverage Revenue (million) Forecast, by Application 2020 & 2033
- Table 90: Oceania Ethanol In Beverage Volume (K) Forecast, by Application 2020 & 2033
- Table 91: Rest of Asia Pacific Ethanol In Beverage Revenue (million) Forecast, by Application 2020 & 2033
- Table 92: Rest of Asia Pacific Ethanol In Beverage Volume (K) Forecast, by Application 2020 & 2033
Frequently Asked Questions
1. What is the projected Compound Annual Growth Rate (CAGR) of the Ethanol In Beverage?
The projected CAGR is approximately 4.8%.
2. Which companies are prominent players in the Ethanol In Beverage?
Key companies in the market include MGP Ingredients, Cargill, Tereos, ADM, SDIC JILIN, China New Borun, GPC, KAI, CropEnergies, Greenfield, Cristal Union, Euro-Alkohol, ALCOGROUP, Taicang Xintal Alcohol, Manildra, BruggemannAlcohol Heilbronn, Wilmar BioEthanol, Bangkok Alcohol Industrial.
3. What are the main segments of the Ethanol In Beverage?
The market segments include Application, Type.
4. Can you provide details about the market size?
The market size is estimated to be USD 5423 million as of 2022.
5. What are some drivers contributing to market growth?
N/A
6. What are the notable trends driving market growth?
N/A
7. Are there any restraints impacting market growth?
N/A
8. Can you provide examples of recent developments in the market?
N/A
9. What pricing options are available for accessing the report?
Pricing options include single-user, multi-user, and enterprise licenses priced at USD 3950.00, USD 5925.00, and USD 7900.00 respectively.
10. Is the market size provided in terms of value or volume?
The market size is provided in terms of value, measured in million and volume, measured in K.
11. Are there any specific market keywords associated with the report?
Yes, the market keyword associated with the report is "Ethanol In Beverage," which aids in identifying and referencing the specific market segment covered.
12. How do I determine which pricing option suits my needs best?
The pricing options vary based on user requirements and access needs. Individual users may opt for single-user licenses, while businesses requiring broader access may choose multi-user or enterprise licenses for cost-effective access to the report.
13. Are there any additional resources or data provided in the Ethanol In Beverage report?
While the report offers comprehensive insights, it's advisable to review the specific contents or supplementary materials provided to ascertain if additional resources or data are available.
14. How can I stay updated on further developments or reports in the Ethanol In Beverage?
To stay informed about further developments, trends, and reports in the Ethanol In Beverage, consider subscribing to industry newsletters, following relevant companies and organizations, or regularly checking reputable industry news sources and publications.
Methodology
Step 1 - Identification of Relevant Samples Size from Population Database


Step 2 - Approaches for Defining Global Market Size (Value, Volume* & Price*)

Note*: In applicable scenarios
Step 3 - Data Sources
Primary Research
- Web Analytics
- Survey Reports
- Research Institute
- Latest Research Reports
- Opinion Leaders
Secondary Research
- Annual Reports
- White Paper
- Latest Press Release
- Industry Association
- Paid Database
- Investor Presentations

Step 4 - Data Triangulation
Involves using different sources of information in order to increase the validity of a study
These sources are likely to be stakeholders in a program - participants, other researchers, program staff, other community members, and so on.
Then we put all data in single framework & apply various statistical tools to find out the dynamic on the market.
During the analysis stage, feedback from the stakeholder groups would be compared to determine areas of agreement as well as areas of divergence