

Key Insights
The global electronic calculator market is projected to reach $551.41 million in 2025, exhibiting a steady growth trajectory with a compound annual growth rate (CAGR) of 2% from 2019 to 2033. This sustained expansion is driven by the consistent demand for both basic and specialized calculating devices across educational institutions, professional environments, and for personal use. While the market is mature in some aspects, new innovations and the integration of advanced functionalities continue to sustain its relevance. The online segment is expected to witness a significant push due to the increasing preference for e-commerce platforms for purchasing these devices, offering convenience and wider accessibility. Conversely, the offline segment, encompassing retail stores and stationery shops, will continue to cater to immediate needs and traditional buying habits, particularly in developing regions. The market's resilience is also bolstered by the enduring utility of scientific and financial calculators, which remain indispensable tools for students and professionals in STEM fields and finance, respectively.
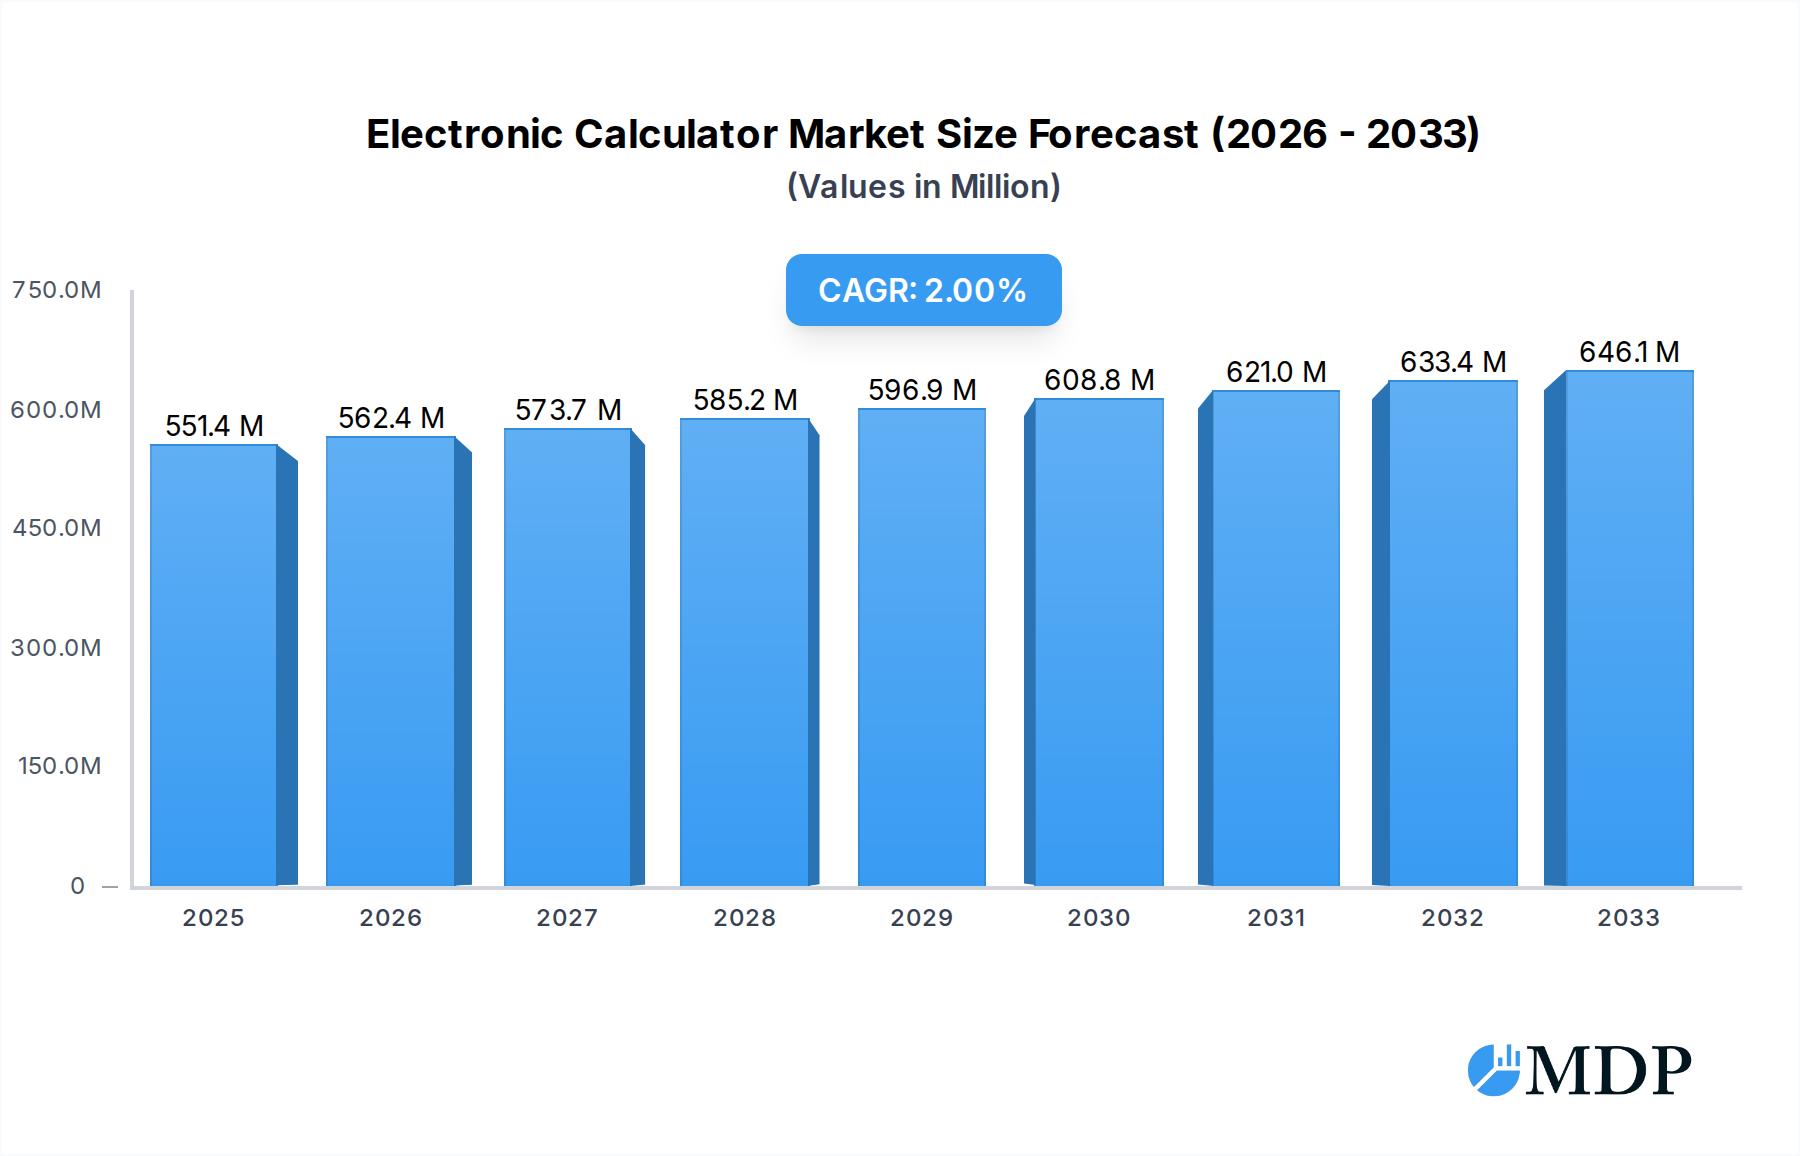
Electronic Calculator Market Size (In Million)
Key market drivers include the growing student population worldwide, necessitating calculators for academic purposes, and the continuous need for precise calculations in various professional sectors such as engineering, accounting, and research. Advancements in calculator technology, leading to more user-friendly interfaces and enhanced functionalities like data storage and connectivity, are also contributing to market growth. However, the increasing prevalence of calculator applications on smartphones and computers poses a significant restraint, offering a free or low-cost alternative. Despite this, the dedicated nature and specific features of physical electronic calculators ensure their continued demand, especially in contexts where the use of personal electronic devices is restricted or impractical. The market is segmented by application into online and offline channels, and by type into basic, financial, scientific, and graphical calculators. Leading players like Casio, Texas Instruments, and Canon continue to innovate and maintain a strong market presence, adapting to evolving consumer preferences and technological landscapes.

Electronic Calculator Company Market Share
This comprehensive report provides an in-depth analysis of the global Electronic Calculator market, encompassing a study period from 2019 to 2033, with a base year of 2025 and a forecast period of 2025-2033. Dive into the intricate dynamics, emerging trends, and future trajectory of this essential industry, valued in the millions. Our research meticulously examines key players such as Casio, Sharp, Canon, Sunway Electronics Company, Texas Instruments, Hewlett Packard, Citizen Systems, Lyreco, Victor Technology, Deli, Newsunda Stationery, Kenko International Company, Shantou Eates Electronic Industrial, and more. Whether seeking insights into online or offline applications, or understanding the dominance of Basic Calculators, Financial Calculators, Scientific Calculators, and Graphical Calculators, this report offers unparalleled actionable intelligence for industry stakeholders.
Electronic Calculator Market Dynamics & Concentration
The global Electronic Calculator market, estimated to be valued in the millions, exhibits a moderate to high concentration, with key players like Casio, Sharp, and Texas Instruments holding significant market shares, collectively accounting for an estimated xx% of the total market value. Innovation drivers are predominantly centered around enhanced functionality, user-friendliness, and integration with digital platforms, pushing the boundaries of what was once a simple computational tool. Regulatory frameworks, while generally stable, can impact import/export dynamics and product standardization across different regions. Product substitutes, primarily in the form of advanced smartphone applications and software solutions, pose an evolving challenge, necessitating continuous innovation in dedicated hardware. End-user trends reveal a sustained demand for specialized calculators in educational and professional settings, alongside a growing niche for advanced graphical and financial models. Mergers and Acquisitions (M&A) activities, while not as prevalent as in some other tech sectors, have historically played a role in market consolidation. We anticipate approximately xx M&A deals over the forecast period, aimed at acquiring technological capabilities or expanding market reach.
Electronic Calculator Industry Trends & Analysis
The Electronic Calculator industry is poised for steady growth, projected to witness a Compound Annual Growth Rate (CAGR) of xx% from 2025 to 2033, propelling its market value into the millions. This expansion is fueled by several interconnected trends. Market growth drivers include the persistent demand from educational institutions for reliable and feature-rich calculators, the growing need for specialized financial calculators in the burgeoning fintech sector, and the ongoing development of scientific and graphical calculators essential for STEM education and research. Technological disruptions are manifesting in several ways: the integration of connectivity features, allowing for data transfer and cloud synchronization; the development of more intuitive user interfaces, akin to modern digital devices; and the exploration of eco-friendly manufacturing processes and materials. Consumer preferences are shifting towards calculators that offer a blend of traditional functionality and modern convenience, with an increasing appreciation for durability and ergonomic design. The competitive landscape remains dynamic, with established brands like Casio and Texas Instruments facing increasing competition from both global and regional players such as Deli and Newsunda Stationery, particularly in the basic and mid-range segments. Market penetration for advanced calculators is expected to rise as educational curricula evolve and professional demands for sophisticated data analysis increase.
Leading Markets & Segments in Electronic Calculator
The Offline application segment continues to dominate the global Electronic Calculator market, accounting for an estimated xx% of the total market revenue in 2025, projected to reach millions by 2033. This dominance is particularly pronounced in developing economies where reliable internet access may be inconsistent, and in educational environments where the use of connected devices during examinations is often restricted. Within this segment, Basic Calculators represent the largest and most consistent demand driver, fueled by widespread adoption in primary and secondary education, as well as everyday household and office use. The market penetration for basic calculators remains high globally, estimated at xx%.
Key Drivers for Offline Dominance:
- Educational Policies: Mandates for standardized testing and classroom use often favor offline, dedicated devices.
- Infrastructure Limitations: In certain regions, consistent and affordable internet access is not universally available, making offline solutions more practical.
- Cost-Effectiveness: Basic offline calculators offer a highly cost-effective solution for mass adoption.
However, the Online segment is exhibiting a faster growth trajectory, driven by the increasing integration of cloud computing and mobile applications. This segment is expected to see a CAGR of xx% during the forecast period, with the potential to reach millions. The rise of sophisticated financial and scientific applications accessible online is a significant contributor.
Dominance Analysis of Segments:
- Basic Calculators: While holding the largest market share currently, their growth rate is moderate. Their strength lies in their ubiquity and affordability.
- Financial Calculators: Experiencing robust growth due to the increasing complexity of financial markets and the demand for specialized tools in business and accounting.
- Scientific Calculators: A cornerstone for higher education and research, their demand is stable and driven by STEM curriculum advancements.
- Graphical Calculators: Representing a high-value segment, their growth is fueled by advanced features and adoption in specialized academic fields and engineering.
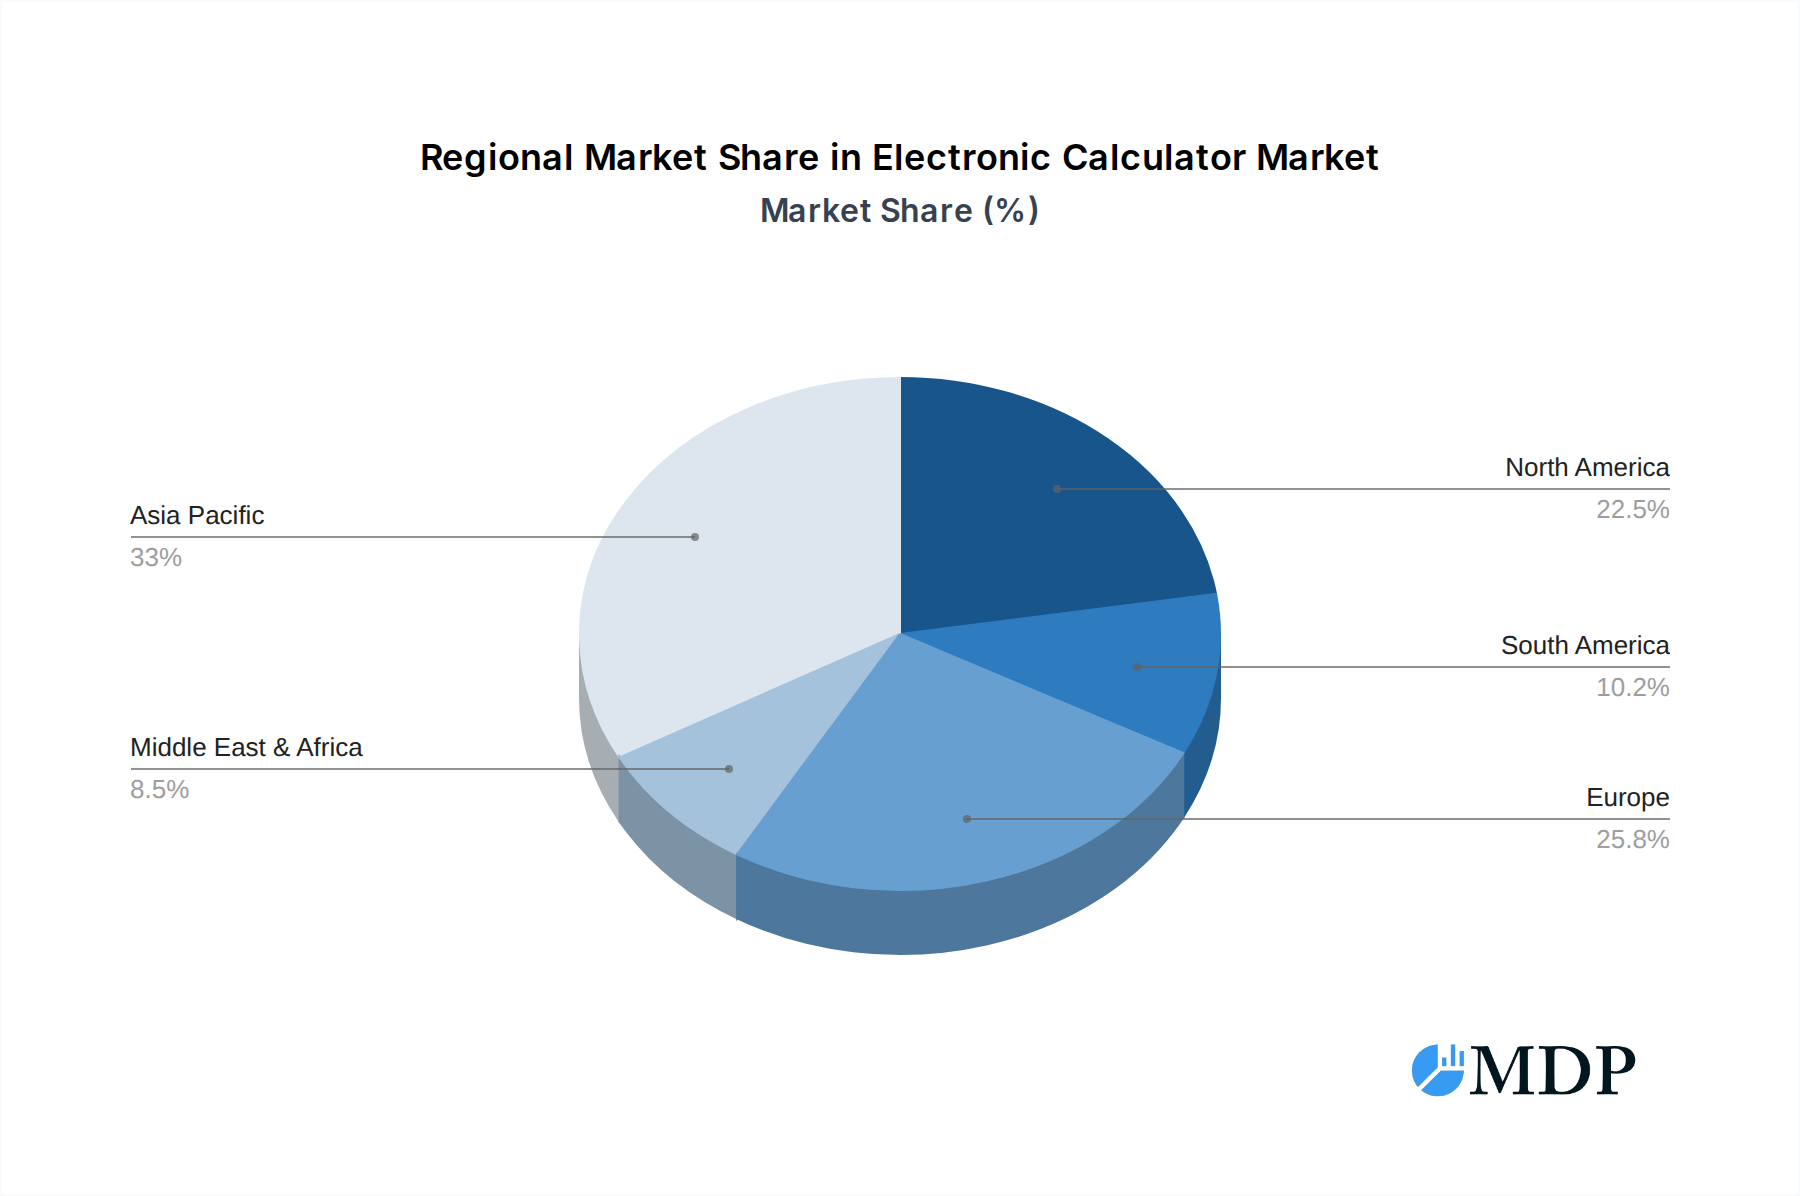
The Asia Pacific region, driven by countries like China and India, is the largest market for electronic calculators, contributing an estimated xx% to the global revenue, with its market value projected to exceed millions by 2033. This dominance is attributed to a large student population, a growing manufacturing base, and increasing disposable incomes.
Electronic Calculator Product Developments
Recent product developments in the Electronic Calculator market are focused on enhancing user experience and expanding functionality. Innovations include the integration of solar and battery power for extended use, improved display technologies for better readability, and the development of ergonomic designs for comfortable handling. We're also observing a trend towards calculators with built-in natural display capabilities, allowing equations to be entered and displayed as they appear in textbooks. Competitive advantages are being carved out through the development of specialized calculators tailored for specific professions, such as advanced financial modeling tools and highly programmable scientific calculators. These advancements are directly addressing evolving market needs and technological trends, ensuring continued relevance and appeal for dedicated calculation devices.
Key Drivers of Electronic Calculator Growth
The Electronic Calculator market's growth is propelled by a confluence of factors. Technological advancements in processing power and display technology are enabling more complex calculations and intuitive interfaces. Economic growth, particularly in emerging markets, is increasing disposable income and the demand for educational and professional tools. Educational reforms globally, emphasizing STEM fields, are driving a consistent need for scientific and graphical calculators. Furthermore, a growing reliance on precise calculations in various industries, from engineering and finance to scientific research, underpins the sustained demand for reliable and specialized calculators. The continued utility of these devices in examination settings also provides a stable demand base.
Challenges in the Electronic Calculator Market
Despite its growth potential, the Electronic Calculator market faces significant challenges. Intensifying competition from feature-rich smartphone calculator apps and versatile software solutions presents a persistent threat, potentially eroding market share in the basic and mid-range segments. Supply chain disruptions, as witnessed in recent years, can lead to increased manufacturing costs and production delays, impacting availability and pricing. Increasingly stringent environmental regulations related to electronic waste and material sourcing may necessitate costly adjustments in manufacturing processes. The high cost of advanced features in scientific and graphical calculators can also be a barrier to adoption in price-sensitive markets.
Emerging Opportunities in Electronic Calculator
Emerging opportunities for the Electronic Calculator market lie in several key areas. Technological breakthroughs in miniaturization and energy efficiency could lead to more portable and sustainable calculator designs. Strategic partnerships with educational technology providers to integrate calculator functionalities into online learning platforms can unlock new distribution channels and user engagement. Market expansion into untapped regions with growing educational and professional sectors presents significant potential. Furthermore, the development of calculators with advanced data analysis and visualization capabilities, catering to specific professional needs, can create high-value niche markets and drive future revenue streams.
Leading Players in the Electronic Calculator Sector
- Casio
- Sharp
- Canon
- Sunway Electronics Company
- Texas Instruments
- Hewlett Packard
- Citizen Systems
- Lyreco
- Victor Technology
- Deli
- Newsunda Stationery
- Kenko International Company
- Shantou Eates Electronic Industrial
Key Milestones in Electronic Calculator Industry
- 2019: Increased integration of solar power in basic calculator models.
- 2020: Launch of enhanced scientific calculators with advanced graphing capabilities by Texas Instruments.
- 2021: Growing adoption of cloud-sync features in financial calculators from leading brands.
- 2022: Focus on sustainable manufacturing practices and eco-friendly materials by several key players.
- 2023: Emergence of AI-powered predictive calculation features in high-end models.
- 2024: Expansion of online calculator platforms offering advanced simulation tools for education.
- 2025 (Base Year): Projected market value of millions, with significant growth anticipated.
- 2026-2033 (Forecast Period): Continued innovation in user interface design and specialized functionalities.
Strategic Outlook for Electronic Calculator Market
The strategic outlook for the Electronic Calculator market is one of sustained evolution and targeted growth. Future success will hinge on the ability of manufacturers to continuously innovate, balancing the enduring demand for traditional functionality with the integration of modern digital capabilities. Key growth accelerators include developing calculators that offer seamless online and offline experiences, catering to both educational and professional segments with specialized, high-performance devices, and exploring new materials and manufacturing processes to enhance sustainability. Strategic partnerships and a focus on user-centric design will be crucial in capturing market share and ensuring the continued relevance of electronic calculators in an increasingly digital world.
Electronic Calculator Segmentation
-
1. Application
- 1.1. Online
- 1.2. Offline
-
2. Types
- 2.1. Basic Calculators
- 2.2. Financial Calculators
- 2.3. Scientific Calculators
- 2.4. Graphical Calculators
Electronic Calculator Segmentation By Geography
-
1. North America
- 1.1. United States
- 1.2. Canada
- 1.3. Mexico
-
2. South America
- 2.1. Brazil
- 2.2. Argentina
- 2.3. Rest of South America
-
3. Europe
- 3.1. United Kingdom
- 3.2. Germany
- 3.3. France
- 3.4. Italy
- 3.5. Spain
- 3.6. Russia
- 3.7. Benelux
- 3.8. Nordics
- 3.9. Rest of Europe
-
4. Middle East & Africa
- 4.1. Turkey
- 4.2. Israel
- 4.3. GCC
- 4.4. North Africa
- 4.5. South Africa
- 4.6. Rest of Middle East & Africa
-
5. Asia Pacific
- 5.1. China
- 5.2. India
- 5.3. Japan
- 5.4. South Korea
- 5.5. ASEAN
- 5.6. Oceania
- 5.7. Rest of Asia Pacific
Electronic Calculator Regional Market Share
Geographic Coverage of Electronic Calculator
Electronic Calculator REPORT HIGHLIGHTS
| Aspects | Details |
|---|---|
| Study Period | 2020-2034 |
| Base Year | 2025 |
| Estimated Year | 2026 |
| Forecast Period | 2026-2034 |
| Historical Period | 2020-2025 |
| Growth Rate | CAGR of 2% from 2020-2034 |
| Segmentation |
|
Table of Contents
- 1. Introduction
- 1.1. Research Scope
- 1.2. Market Segmentation
- 1.3. Research Methodology
- 1.4. Definitions and Assumptions
- 2. Executive Summary
- 2.1. Introduction
- 3. Market Dynamics
- 3.1. Introduction
- 3.2. Market Drivers
- 3.3. Market Restrains
- 3.4. Market Trends
- 4. Market Factor Analysis
- 4.1. Porters Five Forces
- 4.2. Supply/Value Chain
- 4.3. PESTEL analysis
- 4.4. Market Entropy
- 4.5. Patent/Trademark Analysis
- 5. Global Electronic Calculator Analysis, Insights and Forecast, 2020-2032
- 5.1. Market Analysis, Insights and Forecast - by Application
- 5.1.1. Online
- 5.1.2. Offline
- 5.2. Market Analysis, Insights and Forecast - by Types
- 5.2.1. Basic Calculators
- 5.2.2. Financial Calculators
- 5.2.3. Scientific Calculators
- 5.2.4. Graphical Calculators
- 5.3. Market Analysis, Insights and Forecast - by Region
- 5.3.1. North America
- 5.3.2. South America
- 5.3.3. Europe
- 5.3.4. Middle East & Africa
- 5.3.5. Asia Pacific
- 5.1. Market Analysis, Insights and Forecast - by Application
- 6. North America Electronic Calculator Analysis, Insights and Forecast, 2020-2032
- 6.1. Market Analysis, Insights and Forecast - by Application
- 6.1.1. Online
- 6.1.2. Offline
- 6.2. Market Analysis, Insights and Forecast - by Types
- 6.2.1. Basic Calculators
- 6.2.2. Financial Calculators
- 6.2.3. Scientific Calculators
- 6.2.4. Graphical Calculators
- 6.1. Market Analysis, Insights and Forecast - by Application
- 7. South America Electronic Calculator Analysis, Insights and Forecast, 2020-2032
- 7.1. Market Analysis, Insights and Forecast - by Application
- 7.1.1. Online
- 7.1.2. Offline
- 7.2. Market Analysis, Insights and Forecast - by Types
- 7.2.1. Basic Calculators
- 7.2.2. Financial Calculators
- 7.2.3. Scientific Calculators
- 7.2.4. Graphical Calculators
- 7.1. Market Analysis, Insights and Forecast - by Application
- 8. Europe Electronic Calculator Analysis, Insights and Forecast, 2020-2032
- 8.1. Market Analysis, Insights and Forecast - by Application
- 8.1.1. Online
- 8.1.2. Offline
- 8.2. Market Analysis, Insights and Forecast - by Types
- 8.2.1. Basic Calculators
- 8.2.2. Financial Calculators
- 8.2.3. Scientific Calculators
- 8.2.4. Graphical Calculators
- 8.1. Market Analysis, Insights and Forecast - by Application
- 9. Middle East & Africa Electronic Calculator Analysis, Insights and Forecast, 2020-2032
- 9.1. Market Analysis, Insights and Forecast - by Application
- 9.1.1. Online
- 9.1.2. Offline
- 9.2. Market Analysis, Insights and Forecast - by Types
- 9.2.1. Basic Calculators
- 9.2.2. Financial Calculators
- 9.2.3. Scientific Calculators
- 9.2.4. Graphical Calculators
- 9.1. Market Analysis, Insights and Forecast - by Application
- 10. Asia Pacific Electronic Calculator Analysis, Insights and Forecast, 2020-2032
- 10.1. Market Analysis, Insights and Forecast - by Application
- 10.1.1. Online
- 10.1.2. Offline
- 10.2. Market Analysis, Insights and Forecast - by Types
- 10.2.1. Basic Calculators
- 10.2.2. Financial Calculators
- 10.2.3. Scientific Calculators
- 10.2.4. Graphical Calculators
- 10.1. Market Analysis, Insights and Forecast - by Application
- 11. Competitive Analysis
- 11.1. Global Market Share Analysis 2025
- 11.2. Company Profiles
- 11.2.1 Casio
- 11.2.1.1. Overview
- 11.2.1.2. Products
- 11.2.1.3. SWOT Analysis
- 11.2.1.4. Recent Developments
- 11.2.1.5. Financials (Based on Availability)
- 11.2.2 Sharp
- 11.2.2.1. Overview
- 11.2.2.2. Products
- 11.2.2.3. SWOT Analysis
- 11.2.2.4. Recent Developments
- 11.2.2.5. Financials (Based on Availability)
- 11.2.3 Canon
- 11.2.3.1. Overview
- 11.2.3.2. Products
- 11.2.3.3. SWOT Analysis
- 11.2.3.4. Recent Developments
- 11.2.3.5. Financials (Based on Availability)
- 11.2.4 Sunway Electronics Company
- 11.2.4.1. Overview
- 11.2.4.2. Products
- 11.2.4.3. SWOT Analysis
- 11.2.4.4. Recent Developments
- 11.2.4.5. Financials (Based on Availability)
- 11.2.5 Texas Instruments
- 11.2.5.1. Overview
- 11.2.5.2. Products
- 11.2.5.3. SWOT Analysis
- 11.2.5.4. Recent Developments
- 11.2.5.5. Financials (Based on Availability)
- 11.2.6 Hewlett Packard
- 11.2.6.1. Overview
- 11.2.6.2. Products
- 11.2.6.3. SWOT Analysis
- 11.2.6.4. Recent Developments
- 11.2.6.5. Financials (Based on Availability)
- 11.2.7 Citizen Systems
- 11.2.7.1. Overview
- 11.2.7.2. Products
- 11.2.7.3. SWOT Analysis
- 11.2.7.4. Recent Developments
- 11.2.7.5. Financials (Based on Availability)
- 11.2.8 Lyreco
- 11.2.8.1. Overview
- 11.2.8.2. Products
- 11.2.8.3. SWOT Analysis
- 11.2.8.4. Recent Developments
- 11.2.8.5. Financials (Based on Availability)
- 11.2.9 Victor Technology
- 11.2.9.1. Overview
- 11.2.9.2. Products
- 11.2.9.3. SWOT Analysis
- 11.2.9.4. Recent Developments
- 11.2.9.5. Financials (Based on Availability)
- 11.2.10 Deli
- 11.2.10.1. Overview
- 11.2.10.2. Products
- 11.2.10.3. SWOT Analysis
- 11.2.10.4. Recent Developments
- 11.2.10.5. Financials (Based on Availability)
- 11.2.11 Newsunda Stationery
- 11.2.11.1. Overview
- 11.2.11.2. Products
- 11.2.11.3. SWOT Analysis
- 11.2.11.4. Recent Developments
- 11.2.11.5. Financials (Based on Availability)
- 11.2.12 Kenko International Company
- 11.2.12.1. Overview
- 11.2.12.2. Products
- 11.2.12.3. SWOT Analysis
- 11.2.12.4. Recent Developments
- 11.2.12.5. Financials (Based on Availability)
- 11.2.13 Shantou Eates Electronic Industrial
- 11.2.13.1. Overview
- 11.2.13.2. Products
- 11.2.13.3. SWOT Analysis
- 11.2.13.4. Recent Developments
- 11.2.13.5. Financials (Based on Availability)
- 11.2.1 Casio
List of Figures
- Figure 1: Global Electronic Calculator Revenue Breakdown (undefined, %) by Region 2025 & 2033
- Figure 2: Global Electronic Calculator Volume Breakdown (K, %) by Region 2025 & 2033
- Figure 3: North America Electronic Calculator Revenue (undefined), by Application 2025 & 2033
- Figure 4: North America Electronic Calculator Volume (K), by Application 2025 & 2033
- Figure 5: North America Electronic Calculator Revenue Share (%), by Application 2025 & 2033
- Figure 6: North America Electronic Calculator Volume Share (%), by Application 2025 & 2033
- Figure 7: North America Electronic Calculator Revenue (undefined), by Types 2025 & 2033
- Figure 8: North America Electronic Calculator Volume (K), by Types 2025 & 2033
- Figure 9: North America Electronic Calculator Revenue Share (%), by Types 2025 & 2033
- Figure 10: North America Electronic Calculator Volume Share (%), by Types 2025 & 2033
- Figure 11: North America Electronic Calculator Revenue (undefined), by Country 2025 & 2033
- Figure 12: North America Electronic Calculator Volume (K), by Country 2025 & 2033
- Figure 13: North America Electronic Calculator Revenue Share (%), by Country 2025 & 2033
- Figure 14: North America Electronic Calculator Volume Share (%), by Country 2025 & 2033
- Figure 15: South America Electronic Calculator Revenue (undefined), by Application 2025 & 2033
- Figure 16: South America Electronic Calculator Volume (K), by Application 2025 & 2033
- Figure 17: South America Electronic Calculator Revenue Share (%), by Application 2025 & 2033
- Figure 18: South America Electronic Calculator Volume Share (%), by Application 2025 & 2033
- Figure 19: South America Electronic Calculator Revenue (undefined), by Types 2025 & 2033
- Figure 20: South America Electronic Calculator Volume (K), by Types 2025 & 2033
- Figure 21: South America Electronic Calculator Revenue Share (%), by Types 2025 & 2033
- Figure 22: South America Electronic Calculator Volume Share (%), by Types 2025 & 2033
- Figure 23: South America Electronic Calculator Revenue (undefined), by Country 2025 & 2033
- Figure 24: South America Electronic Calculator Volume (K), by Country 2025 & 2033
- Figure 25: South America Electronic Calculator Revenue Share (%), by Country 2025 & 2033
- Figure 26: South America Electronic Calculator Volume Share (%), by Country 2025 & 2033
- Figure 27: Europe Electronic Calculator Revenue (undefined), by Application 2025 & 2033
- Figure 28: Europe Electronic Calculator Volume (K), by Application 2025 & 2033
- Figure 29: Europe Electronic Calculator Revenue Share (%), by Application 2025 & 2033
- Figure 30: Europe Electronic Calculator Volume Share (%), by Application 2025 & 2033
- Figure 31: Europe Electronic Calculator Revenue (undefined), by Types 2025 & 2033
- Figure 32: Europe Electronic Calculator Volume (K), by Types 2025 & 2033
- Figure 33: Europe Electronic Calculator Revenue Share (%), by Types 2025 & 2033
- Figure 34: Europe Electronic Calculator Volume Share (%), by Types 2025 & 2033
- Figure 35: Europe Electronic Calculator Revenue (undefined), by Country 2025 & 2033
- Figure 36: Europe Electronic Calculator Volume (K), by Country 2025 & 2033
- Figure 37: Europe Electronic Calculator Revenue Share (%), by Country 2025 & 2033
- Figure 38: Europe Electronic Calculator Volume Share (%), by Country 2025 & 2033
- Figure 39: Middle East & Africa Electronic Calculator Revenue (undefined), by Application 2025 & 2033
- Figure 40: Middle East & Africa Electronic Calculator Volume (K), by Application 2025 & 2033
- Figure 41: Middle East & Africa Electronic Calculator Revenue Share (%), by Application 2025 & 2033
- Figure 42: Middle East & Africa Electronic Calculator Volume Share (%), by Application 2025 & 2033
- Figure 43: Middle East & Africa Electronic Calculator Revenue (undefined), by Types 2025 & 2033
- Figure 44: Middle East & Africa Electronic Calculator Volume (K), by Types 2025 & 2033
- Figure 45: Middle East & Africa Electronic Calculator Revenue Share (%), by Types 2025 & 2033
- Figure 46: Middle East & Africa Electronic Calculator Volume Share (%), by Types 2025 & 2033
- Figure 47: Middle East & Africa Electronic Calculator Revenue (undefined), by Country 2025 & 2033
- Figure 48: Middle East & Africa Electronic Calculator Volume (K), by Country 2025 & 2033
- Figure 49: Middle East & Africa Electronic Calculator Revenue Share (%), by Country 2025 & 2033
- Figure 50: Middle East & Africa Electronic Calculator Volume Share (%), by Country 2025 & 2033
- Figure 51: Asia Pacific Electronic Calculator Revenue (undefined), by Application 2025 & 2033
- Figure 52: Asia Pacific Electronic Calculator Volume (K), by Application 2025 & 2033
- Figure 53: Asia Pacific Electronic Calculator Revenue Share (%), by Application 2025 & 2033
- Figure 54: Asia Pacific Electronic Calculator Volume Share (%), by Application 2025 & 2033
- Figure 55: Asia Pacific Electronic Calculator Revenue (undefined), by Types 2025 & 2033
- Figure 56: Asia Pacific Electronic Calculator Volume (K), by Types 2025 & 2033
- Figure 57: Asia Pacific Electronic Calculator Revenue Share (%), by Types 2025 & 2033
- Figure 58: Asia Pacific Electronic Calculator Volume Share (%), by Types 2025 & 2033
- Figure 59: Asia Pacific Electronic Calculator Revenue (undefined), by Country 2025 & 2033
- Figure 60: Asia Pacific Electronic Calculator Volume (K), by Country 2025 & 2033
- Figure 61: Asia Pacific Electronic Calculator Revenue Share (%), by Country 2025 & 2033
- Figure 62: Asia Pacific Electronic Calculator Volume Share (%), by Country 2025 & 2033
List of Tables
- Table 1: Global Electronic Calculator Revenue undefined Forecast, by Application 2020 & 2033
- Table 2: Global Electronic Calculator Volume K Forecast, by Application 2020 & 2033
- Table 3: Global Electronic Calculator Revenue undefined Forecast, by Types 2020 & 2033
- Table 4: Global Electronic Calculator Volume K Forecast, by Types 2020 & 2033
- Table 5: Global Electronic Calculator Revenue undefined Forecast, by Region 2020 & 2033
- Table 6: Global Electronic Calculator Volume K Forecast, by Region 2020 & 2033
- Table 7: Global Electronic Calculator Revenue undefined Forecast, by Application 2020 & 2033
- Table 8: Global Electronic Calculator Volume K Forecast, by Application 2020 & 2033
- Table 9: Global Electronic Calculator Revenue undefined Forecast, by Types 2020 & 2033
- Table 10: Global Electronic Calculator Volume K Forecast, by Types 2020 & 2033
- Table 11: Global Electronic Calculator Revenue undefined Forecast, by Country 2020 & 2033
- Table 12: Global Electronic Calculator Volume K Forecast, by Country 2020 & 2033
- Table 13: United States Electronic Calculator Revenue (undefined) Forecast, by Application 2020 & 2033
- Table 14: United States Electronic Calculator Volume (K) Forecast, by Application 2020 & 2033
- Table 15: Canada Electronic Calculator Revenue (undefined) Forecast, by Application 2020 & 2033
- Table 16: Canada Electronic Calculator Volume (K) Forecast, by Application 2020 & 2033
- Table 17: Mexico Electronic Calculator Revenue (undefined) Forecast, by Application 2020 & 2033
- Table 18: Mexico Electronic Calculator Volume (K) Forecast, by Application 2020 & 2033
- Table 19: Global Electronic Calculator Revenue undefined Forecast, by Application 2020 & 2033
- Table 20: Global Electronic Calculator Volume K Forecast, by Application 2020 & 2033
- Table 21: Global Electronic Calculator Revenue undefined Forecast, by Types 2020 & 2033
- Table 22: Global Electronic Calculator Volume K Forecast, by Types 2020 & 2033
- Table 23: Global Electronic Calculator Revenue undefined Forecast, by Country 2020 & 2033
- Table 24: Global Electronic Calculator Volume K Forecast, by Country 2020 & 2033
- Table 25: Brazil Electronic Calculator Revenue (undefined) Forecast, by Application 2020 & 2033
- Table 26: Brazil Electronic Calculator Volume (K) Forecast, by Application 2020 & 2033
- Table 27: Argentina Electronic Calculator Revenue (undefined) Forecast, by Application 2020 & 2033
- Table 28: Argentina Electronic Calculator Volume (K) Forecast, by Application 2020 & 2033
- Table 29: Rest of South America Electronic Calculator Revenue (undefined) Forecast, by Application 2020 & 2033
- Table 30: Rest of South America Electronic Calculator Volume (K) Forecast, by Application 2020 & 2033
- Table 31: Global Electronic Calculator Revenue undefined Forecast, by Application 2020 & 2033
- Table 32: Global Electronic Calculator Volume K Forecast, by Application 2020 & 2033
- Table 33: Global Electronic Calculator Revenue undefined Forecast, by Types 2020 & 2033
- Table 34: Global Electronic Calculator Volume K Forecast, by Types 2020 & 2033
- Table 35: Global Electronic Calculator Revenue undefined Forecast, by Country 2020 & 2033
- Table 36: Global Electronic Calculator Volume K Forecast, by Country 2020 & 2033
- Table 37: United Kingdom Electronic Calculator Revenue (undefined) Forecast, by Application 2020 & 2033
- Table 38: United Kingdom Electronic Calculator Volume (K) Forecast, by Application 2020 & 2033
- Table 39: Germany Electronic Calculator Revenue (undefined) Forecast, by Application 2020 & 2033
- Table 40: Germany Electronic Calculator Volume (K) Forecast, by Application 2020 & 2033
- Table 41: France Electronic Calculator Revenue (undefined) Forecast, by Application 2020 & 2033
- Table 42: France Electronic Calculator Volume (K) Forecast, by Application 2020 & 2033
- Table 43: Italy Electronic Calculator Revenue (undefined) Forecast, by Application 2020 & 2033
- Table 44: Italy Electronic Calculator Volume (K) Forecast, by Application 2020 & 2033
- Table 45: Spain Electronic Calculator Revenue (undefined) Forecast, by Application 2020 & 2033
- Table 46: Spain Electronic Calculator Volume (K) Forecast, by Application 2020 & 2033
- Table 47: Russia Electronic Calculator Revenue (undefined) Forecast, by Application 2020 & 2033
- Table 48: Russia Electronic Calculator Volume (K) Forecast, by Application 2020 & 2033
- Table 49: Benelux Electronic Calculator Revenue (undefined) Forecast, by Application 2020 & 2033
- Table 50: Benelux Electronic Calculator Volume (K) Forecast, by Application 2020 & 2033
- Table 51: Nordics Electronic Calculator Revenue (undefined) Forecast, by Application 2020 & 2033
- Table 52: Nordics Electronic Calculator Volume (K) Forecast, by Application 2020 & 2033
- Table 53: Rest of Europe Electronic Calculator Revenue (undefined) Forecast, by Application 2020 & 2033
- Table 54: Rest of Europe Electronic Calculator Volume (K) Forecast, by Application 2020 & 2033
- Table 55: Global Electronic Calculator Revenue undefined Forecast, by Application 2020 & 2033
- Table 56: Global Electronic Calculator Volume K Forecast, by Application 2020 & 2033
- Table 57: Global Electronic Calculator Revenue undefined Forecast, by Types 2020 & 2033
- Table 58: Global Electronic Calculator Volume K Forecast, by Types 2020 & 2033
- Table 59: Global Electronic Calculator Revenue undefined Forecast, by Country 2020 & 2033
- Table 60: Global Electronic Calculator Volume K Forecast, by Country 2020 & 2033
- Table 61: Turkey Electronic Calculator Revenue (undefined) Forecast, by Application 2020 & 2033
- Table 62: Turkey Electronic Calculator Volume (K) Forecast, by Application 2020 & 2033
- Table 63: Israel Electronic Calculator Revenue (undefined) Forecast, by Application 2020 & 2033
- Table 64: Israel Electronic Calculator Volume (K) Forecast, by Application 2020 & 2033
- Table 65: GCC Electronic Calculator Revenue (undefined) Forecast, by Application 2020 & 2033
- Table 66: GCC Electronic Calculator Volume (K) Forecast, by Application 2020 & 2033
- Table 67: North Africa Electronic Calculator Revenue (undefined) Forecast, by Application 2020 & 2033
- Table 68: North Africa Electronic Calculator Volume (K) Forecast, by Application 2020 & 2033
- Table 69: South Africa Electronic Calculator Revenue (undefined) Forecast, by Application 2020 & 2033
- Table 70: South Africa Electronic Calculator Volume (K) Forecast, by Application 2020 & 2033
- Table 71: Rest of Middle East & Africa Electronic Calculator Revenue (undefined) Forecast, by Application 2020 & 2033
- Table 72: Rest of Middle East & Africa Electronic Calculator Volume (K) Forecast, by Application 2020 & 2033
- Table 73: Global Electronic Calculator Revenue undefined Forecast, by Application 2020 & 2033
- Table 74: Global Electronic Calculator Volume K Forecast, by Application 2020 & 2033
- Table 75: Global Electronic Calculator Revenue undefined Forecast, by Types 2020 & 2033
- Table 76: Global Electronic Calculator Volume K Forecast, by Types 2020 & 2033
- Table 77: Global Electronic Calculator Revenue undefined Forecast, by Country 2020 & 2033
- Table 78: Global Electronic Calculator Volume K Forecast, by Country 2020 & 2033
- Table 79: China Electronic Calculator Revenue (undefined) Forecast, by Application 2020 & 2033
- Table 80: China Electronic Calculator Volume (K) Forecast, by Application 2020 & 2033
- Table 81: India Electronic Calculator Revenue (undefined) Forecast, by Application 2020 & 2033
- Table 82: India Electronic Calculator Volume (K) Forecast, by Application 2020 & 2033
- Table 83: Japan Electronic Calculator Revenue (undefined) Forecast, by Application 2020 & 2033
- Table 84: Japan Electronic Calculator Volume (K) Forecast, by Application 2020 & 2033
- Table 85: South Korea Electronic Calculator Revenue (undefined) Forecast, by Application 2020 & 2033
- Table 86: South Korea Electronic Calculator Volume (K) Forecast, by Application 2020 & 2033
- Table 87: ASEAN Electronic Calculator Revenue (undefined) Forecast, by Application 2020 & 2033
- Table 88: ASEAN Electronic Calculator Volume (K) Forecast, by Application 2020 & 2033
- Table 89: Oceania Electronic Calculator Revenue (undefined) Forecast, by Application 2020 & 2033
- Table 90: Oceania Electronic Calculator Volume (K) Forecast, by Application 2020 & 2033
- Table 91: Rest of Asia Pacific Electronic Calculator Revenue (undefined) Forecast, by Application 2020 & 2033
- Table 92: Rest of Asia Pacific Electronic Calculator Volume (K) Forecast, by Application 2020 & 2033
Frequently Asked Questions
1. What is the projected Compound Annual Growth Rate (CAGR) of the Electronic Calculator?
The projected CAGR is approximately 2%.
2. Which companies are prominent players in the Electronic Calculator?
Key companies in the market include Casio, Sharp, Canon, Sunway Electronics Company, Texas Instruments, Hewlett Packard, Citizen Systems, Lyreco, Victor Technology, Deli, Newsunda Stationery, Kenko International Company, Shantou Eates Electronic Industrial.
3. What are the main segments of the Electronic Calculator?
The market segments include Application, Types.
4. Can you provide details about the market size?
The market size is estimated to be USD XXX N/A as of 2022.
5. What are some drivers contributing to market growth?
N/A
6. What are the notable trends driving market growth?
N/A
7. Are there any restraints impacting market growth?
N/A
8. Can you provide examples of recent developments in the market?
N/A
9. What pricing options are available for accessing the report?
Pricing options include single-user, multi-user, and enterprise licenses priced at USD 3350.00, USD 5025.00, and USD 6700.00 respectively.
10. Is the market size provided in terms of value or volume?
The market size is provided in terms of value, measured in N/A and volume, measured in K.
11. Are there any specific market keywords associated with the report?
Yes, the market keyword associated with the report is "Electronic Calculator," which aids in identifying and referencing the specific market segment covered.
12. How do I determine which pricing option suits my needs best?
The pricing options vary based on user requirements and access needs. Individual users may opt for single-user licenses, while businesses requiring broader access may choose multi-user or enterprise licenses for cost-effective access to the report.
13. Are there any additional resources or data provided in the Electronic Calculator report?
While the report offers comprehensive insights, it's advisable to review the specific contents or supplementary materials provided to ascertain if additional resources or data are available.
14. How can I stay updated on further developments or reports in the Electronic Calculator?
To stay informed about further developments, trends, and reports in the Electronic Calculator, consider subscribing to industry newsletters, following relevant companies and organizations, or regularly checking reputable industry news sources and publications.
Methodology
Step 1 - Identification of Relevant Samples Size from Population Database


Step 2 - Approaches for Defining Global Market Size (Value, Volume* & Price*)

Note*: In applicable scenarios
Step 3 - Data Sources
Primary Research
- Web Analytics
- Survey Reports
- Research Institute
- Latest Research Reports
- Opinion Leaders
Secondary Research
- Annual Reports
- White Paper
- Latest Press Release
- Industry Association
- Paid Database
- Investor Presentations

Step 4 - Data Triangulation
Involves using different sources of information in order to increase the validity of a study
These sources are likely to be stakeholders in a program - participants, other researchers, program staff, other community members, and so on.
Then we put all data in single framework & apply various statistical tools to find out the dynamic on the market.
During the analysis stage, feedback from the stakeholder groups would be compared to determine areas of agreement as well as areas of divergence