

Key Insights
The global electric bike mid-drive motor market is experiencing robust expansion, driven by increasing consumer preference for sustainable and efficient personal transportation. In 2024, the market size is estimated at approximately $1.53 billion, with a projected Compound Annual Growth Rate (CAGR) of 9.3% through 2033. This significant growth is fueled by several key factors. The escalating cost of traditional fuel, coupled with growing environmental consciousness, is pushing consumers towards e-bikes, particularly those equipped with advanced mid-drive systems that offer superior torque, balance, and ride feel compared to hub motors. Furthermore, technological advancements in battery efficiency and motor power output are enhancing the performance and range of e-bikes, making them more attractive for commuting, recreation, and even professional cycling applications. The increasing adoption of e-bikes in urban mobility solutions and the growing popularity of e-MTBs and e-gravel bikes are also substantial contributors to this market surge.
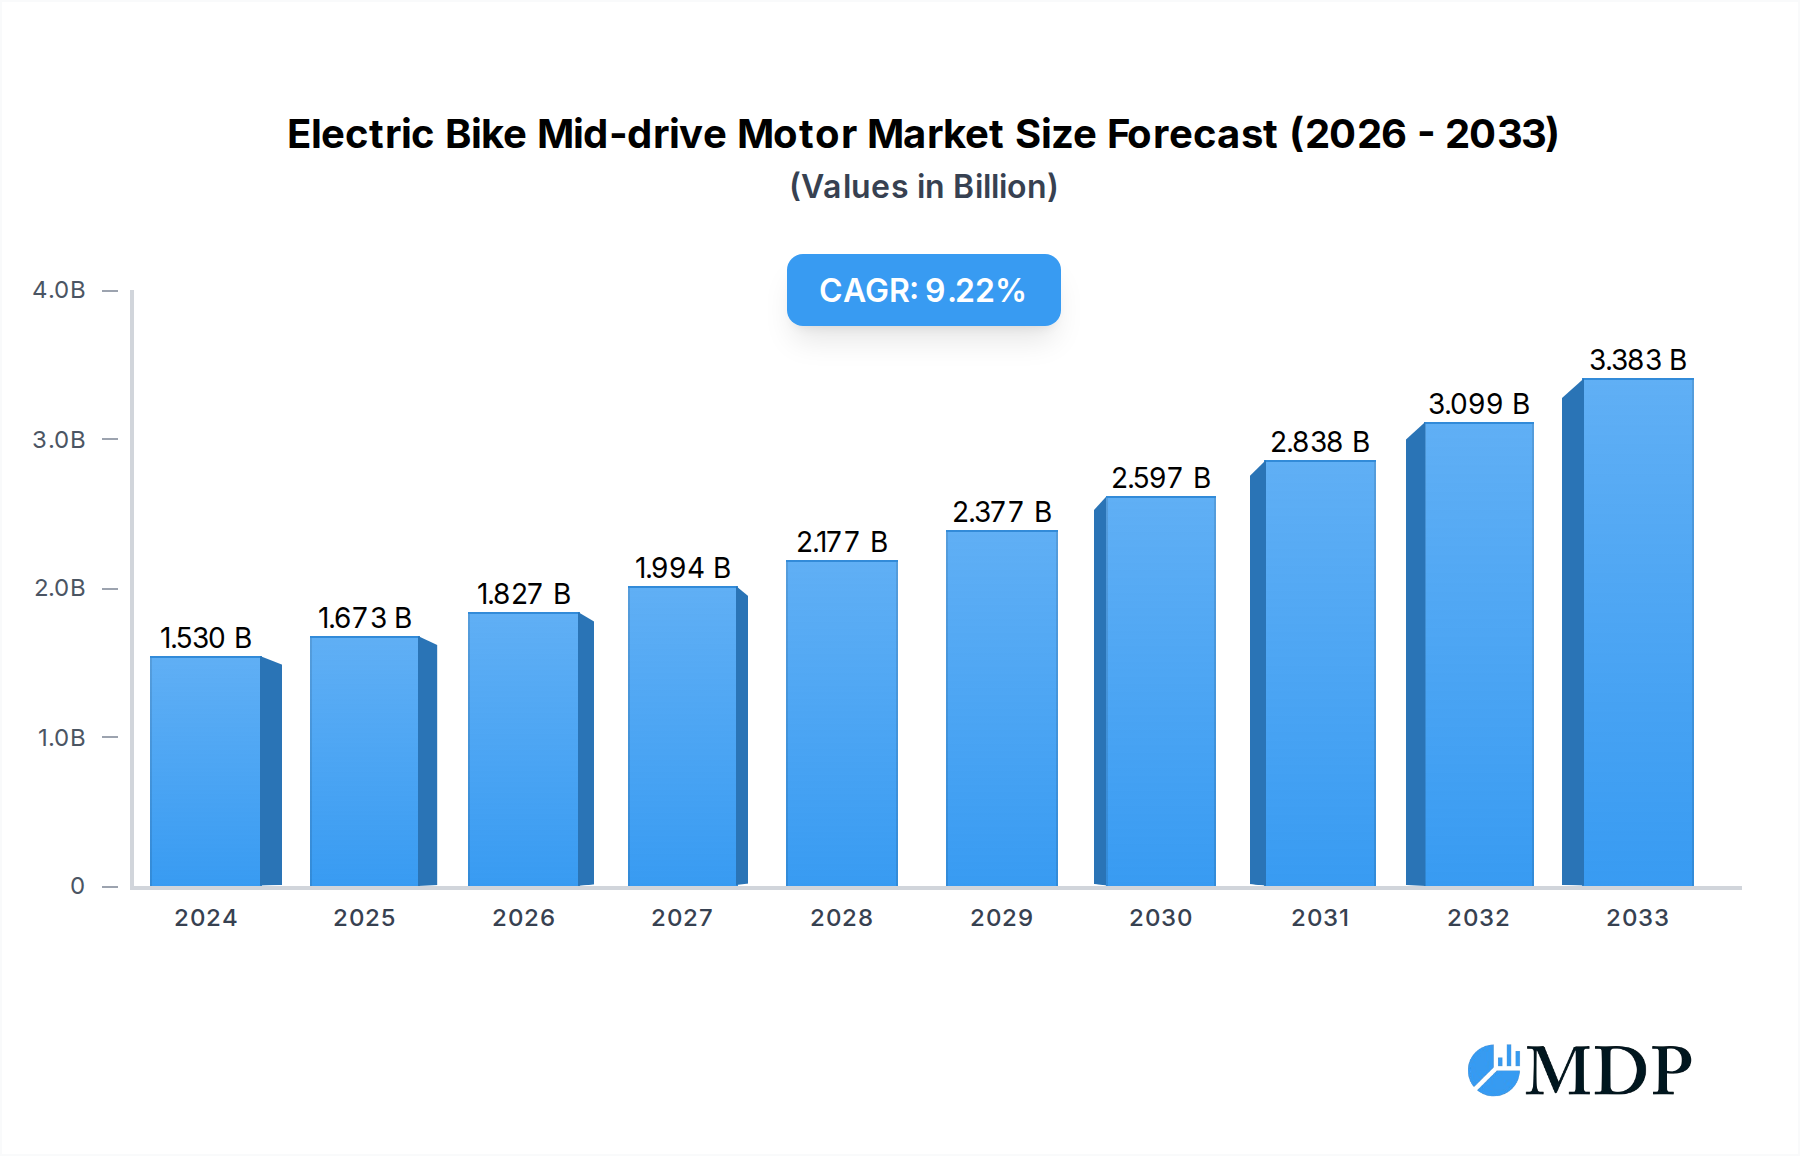
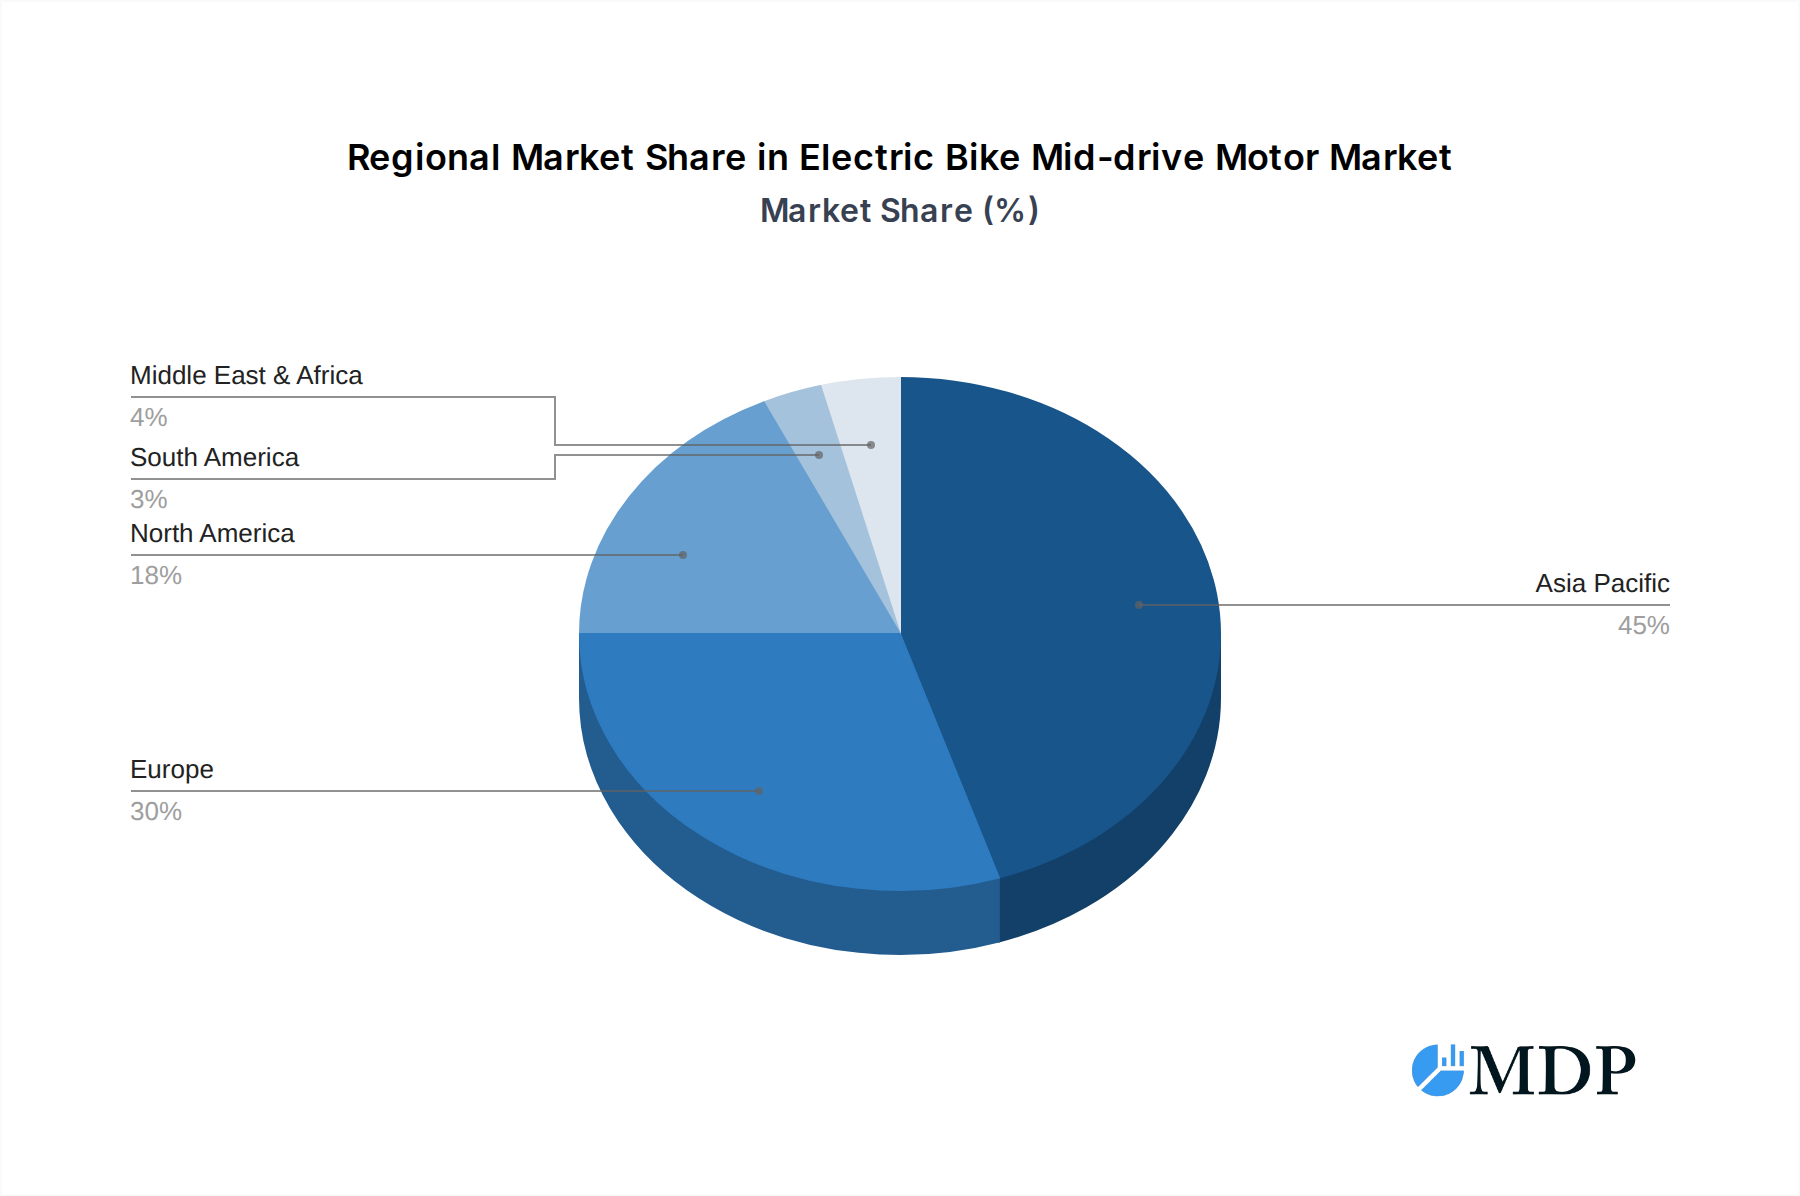
Electric Bike Mid-drive Motor Market Size (In Billion)
The market segmentation reveals a dynamic landscape. In terms of application, both the OEM (Original Equipment Manufacturer) and Aftermarket segments are poised for substantial growth, indicating a strong demand for both new e-bike installations and upgrades for existing bicycles. The division by motor type, specifically Below 250W and Above 250W, highlights the evolving power requirements of e-bikes, with a notable trend towards higher-powered motors for performance-oriented models. Geographically, Asia Pacific, led by China, is expected to dominate the market due to its established manufacturing capabilities and a rapidly growing e-bike consumer base. Europe and North America also represent significant markets, driven by supportive government initiatives, increasing disposable incomes, and a strong cycling culture. While the market is characterized by strong growth, potential restraints such as high initial costs for premium e-bike systems and evolving regulatory landscapes in certain regions could pose challenges to sustained rapid expansion. However, the overarching positive trends suggest a bright future for the electric bike mid-drive motor market.

Electric Bike Mid-drive Motor Company Market Share
Electric Bike Mid-drive Motor Market Report: Unlocking Growth and Innovation (2019–2033)
This comprehensive report, Electric Bike Mid-drive Motor Market Dynamics & Concentration, delves deep into the burgeoning global market for electric bicycle mid-drive motors. Covering the historical period of 2019–2024, with a base year of 2025 and an extensive forecast period stretching to 2033, this analysis provides invaluable insights for industry stakeholders. We meticulously examine market concentration, innovation drivers, evolving regulatory frameworks, the impact of product substitutes, critical end-user trends, and significant Mergers & Acquisitions (M&A) activities. Discover the current market share landscape and an assessment of M&A deal counts, offering a clear picture of the competitive environment. Our report empowers manufacturers, suppliers, distributors, and investors with actionable intelligence to navigate this dynamic sector.
Electric Bike Mid-drive Motor Market Dynamics & Concentration
The electric bike mid-drive motor market is characterized by a moderate to high concentration, with key players like Bosch, Yamaha, and Shimano holding substantial market share. Innovation remains a primary driver, fueled by the relentless pursuit of higher efficiency, lighter weight, and integrated smart features. Regulatory frameworks, particularly concerning e-bike classifications and performance standards, play a crucial role in shaping product development and market access across different regions. The threat of product substitutes, such as hub motors, is present but often overshadowed by the performance advantages of mid-drive systems in terms of torque, balance, and hill-climbing capability. End-user trends are increasingly favoring sophisticated, user-friendly, and performance-oriented e-bike experiences, which directly influences motor design and features. M&A activities are strategically focused on consolidating market presence, acquiring technological expertise, and expanding geographical reach, with an estimated xx M&A deals projected over the forecast period.
Electric Bike Mid-drive Motor Industry Trends & Analysis
The electric bike mid-drive motor industry is experiencing robust growth, driven by several interconnected trends. The escalating global demand for sustainable transportation solutions, coupled with increasing urbanization and a growing emphasis on personal health and fitness, are significant market growth drivers. Technological disruptions are at the forefront, with advancements in battery technology, motor efficiency (e.g., improvements in power-to-weight ratios), and the integration of artificial intelligence for adaptive power delivery and predictive maintenance. Consumer preferences are evolving rapidly, with a rising demand for lightweight, powerful, and silent mid-drive motors that offer a natural riding feel and seamless integration with e-bike systems. This includes a growing appetite for connectivity features, smartphone integration, and customizable riding modes. Competitive dynamics are intensifying, with established players investing heavily in R&D to maintain their technological edge and newer entrants challenging the status quo with innovative designs and pricing strategies. The market penetration of mid-drive e-bikes is projected to continue its upward trajectory, with a Compound Annual Growth Rate (CAGR) of approximately 8.5% expected over the forecast period. This growth is further stimulated by government incentives and the expanding cycling infrastructure in various countries. The increasing adoption of electric cargo bikes and performance e-MTBs also contributes to the sustained demand for powerful and reliable mid-drive motors.
Leading Markets & Segments in Electric Bike Mid-drive Motor
Europe stands as the dominant region in the electric bike mid-drive motor market, with Germany leading the charge due to its well-established e-bike culture, supportive government policies, and extensive cycling infrastructure. The OEM (Original Equipment Manufacturer) segment holds the largest market share, as most leading e-bike manufacturers integrate mid-drive motors directly into their premium offerings. However, the Aftermarket segment is witnessing significant growth as riders upgrade existing e-bikes or seek replacement motors.
Dominant Region: Europe
- Key Drivers: Strong consumer demand for sustainable mobility, government subsidies and tax incentives for e-bike purchases, well-developed cycling infrastructure, and a high disposable income among consumers.
- Detailed Dominance Analysis: European countries like Germany, the Netherlands, and France have a long-standing affinity for cycling, which has seamlessly transitioned into the e-bike revolution. This is supported by robust industrial policies that encourage the production and adoption of electric mobility solutions.
Dominant Segment: Above 250W
- Key Drivers: The increasing popularity of performance-oriented e-bikes, including e-MTBs, e-cargo bikes, and speed pedelecs, necessitates higher power output for superior torque and speed.
- Detailed Dominance Analysis: The demand for mid-drive motors exceeding 250W is driven by riders seeking enhanced performance for challenging terrains, heavy loads, and longer commutes. This segment caters to the growing market for premium and performance e-bikes where mid-drive systems excel in delivering power and efficiency.
Application Segment: OEM
- Key Drivers: E-bike manufacturers prefer integrated mid-drive solutions for optimal performance, aesthetics, and brand differentiation.
- Detailed Dominance Analysis: The OEM segment's dominance is a direct reflection of the close collaboration between motor manufacturers and e-bike brands. This allows for tailored motor designs that complement specific bike frames and riding experiences, ensuring a cohesive and high-quality product for the end consumer.
Electric Bike Mid-drive Motor Product Developments
Recent product developments in the electric bike mid-drive motor sector are centered on enhancing efficiency, reducing weight, and integrating advanced smart features. Innovations include the introduction of lighter and more compact motor units, improved torque sensors for a more intuitive riding experience, and the development of quieter motor operations. Many manufacturers are focusing on integrating connectivity modules for smartphone app control, allowing riders to customize riding modes, track performance metrics, and receive diagnostic information. This push towards smarter, more connected, and highly efficient mid-drive motors offers a significant competitive advantage in the rapidly evolving e-bike market.
Key Drivers of Electric Bike Mid-drive Motor Growth
The growth of the electric bike mid-drive motor market is propelled by several key factors. Technological advancements in motor efficiency, battery technology, and intelligent control systems are making mid-drive e-bikes more accessible and performant. Economic factors, such as rising fuel prices and the increasing cost of public transportation, are making e-bikes an attractive and economical alternative. Regulatory support in the form of subsidies, tax incentives, and favorable e-bike classifications across various regions significantly stimulates consumer adoption. Furthermore, the growing environmental consciousness and the global push towards sustainable transportation are major catalysts for the e-bike industry, directly benefiting mid-drive motor sales.
Challenges in the Electric Bike Mid-drive Motor Market
Despite its strong growth trajectory, the electric bike mid-drive motor market faces certain challenges. Regulatory hurdles in some regions, particularly concerning power output limitations and classification ambiguities, can hinder market expansion. Supply chain disruptions, as evidenced in recent global events, can impact production and increase costs. Intense competitive pressure from both established players and emerging manufacturers can lead to price wars and squeezed profit margins. Additionally, the higher initial cost of mid-drive systems compared to hub motors can be a deterrent for budget-conscious consumers, despite their superior performance.
Emerging Opportunities in Electric Bike Mid-drive Motor
Emerging opportunities within the electric bike mid-drive motor market are numerous and promising. The expansion into developing markets with growing middle classes and increasing awareness of sustainable transportation presents a significant growth avenue. Technological breakthroughs in areas like solid-state batteries and more compact, powerful motor designs will unlock new product possibilities and appeal. Strategic partnerships between motor manufacturers, e-bike brands, and technology providers (e.g., GPS, AI) will foster innovative integrated solutions. Furthermore, the increasing demand for specialized e-bikes, such as lightweight performance models and robust utility e-bikes, offers niche market opportunities for tailored mid-drive motor solutions.
Leading Players in the Electric Bike Mid-drive Motor Sector
- Bosch
- Yamaha
- Shimano
- Bafang
- Brose
- Panasonic
- Derby Cycle
- TQ-Group
Key Milestones in Electric Bike Mid-drive Motor Industry
- 2019: Introduction of Bosch Performance Line CX Gen 4 motor, offering improved torque and efficiency.
- 2020: Yamaha unveils its PW-X2 motor, focusing on a more natural riding feel and enhanced responsiveness.
- 2021: Shimano launches its EP801 motor, featuring advanced connectivity and firmware updates for improved performance.
- 2022: Bafang introduces its M600 motor, targeting a wider range of e-bike applications with competitive pricing.
- 2023: Brose continues to refine its Mag motor with a focus on integration and silent operation.
- 2024: Panasonic expands its e-bike motor offerings, emphasizing durability and reliability for various terrains.
- 2025 (Estimated): Anticipated launch of next-generation motors with significantly reduced weight and enhanced AI-driven power management.
Strategic Outlook for Electric Bike Mid-drive Motor Market
The strategic outlook for the electric bike mid-drive motor market is highly optimistic, driven by sustained demand for premium e-bike experiences and ongoing technological innovation. Growth accelerators include the continuous development of lighter, more powerful, and intelligent motor systems, alongside the expansion of the e-bike market into new geographical regions and diverse application segments like cargo and performance cycling. Strategic partnerships and vertical integration within the supply chain will be crucial for capitalizing on evolving consumer preferences and maintaining a competitive edge. The focus will remain on delivering seamless integration, enhanced rider experience, and sustainable mobility solutions.
Electric Bike Mid-drive Motor Segmentation
-
1. Application
- 1.1. OEM
- 1.2. Aftermarket
-
2. Types
- 2.1. Below 250W
- 2.2. Above 250W
Electric Bike Mid-drive Motor Segmentation By Geography
-
1. North America
- 1.1. United States
- 1.2. Canada
- 1.3. Mexico
-
2. South America
- 2.1. Brazil
- 2.2. Argentina
- 2.3. Rest of South America
-
3. Europe
- 3.1. United Kingdom
- 3.2. Germany
- 3.3. France
- 3.4. Italy
- 3.5. Spain
- 3.6. Russia
- 3.7. Benelux
- 3.8. Nordics
- 3.9. Rest of Europe
-
4. Middle East & Africa
- 4.1. Turkey
- 4.2. Israel
- 4.3. GCC
- 4.4. North Africa
- 4.5. South Africa
- 4.6. Rest of Middle East & Africa
-
5. Asia Pacific
- 5.1. China
- 5.2. India
- 5.3. Japan
- 5.4. South Korea
- 5.5. ASEAN
- 5.6. Oceania
- 5.7. Rest of Asia Pacific
Electric Bike Mid-drive Motor Regional Market Share
Geographic Coverage of Electric Bike Mid-drive Motor
Electric Bike Mid-drive Motor REPORT HIGHLIGHTS
| Aspects | Details |
|---|---|
| Study Period | 2020-2034 |
| Base Year | 2025 |
| Estimated Year | 2026 |
| Forecast Period | 2026-2034 |
| Historical Period | 2020-2025 |
| Growth Rate | CAGR of 9.3% from 2020-2034 |
| Segmentation |
|
Table of Contents
- 1. Introduction
- 1.1. Research Scope
- 1.2. Market Segmentation
- 1.3. Research Methodology
- 1.4. Definitions and Assumptions
- 2. Executive Summary
- 2.1. Introduction
- 3. Market Dynamics
- 3.1. Introduction
- 3.2. Market Drivers
- 3.3. Market Restrains
- 3.4. Market Trends
- 4. Market Factor Analysis
- 4.1. Porters Five Forces
- 4.2. Supply/Value Chain
- 4.3. PESTEL analysis
- 4.4. Market Entropy
- 4.5. Patent/Trademark Analysis
- 5. Global Electric Bike Mid-drive Motor Analysis, Insights and Forecast, 2020-2032
- 5.1. Market Analysis, Insights and Forecast - by Application
- 5.1.1. OEM
- 5.1.2. Aftermarket
- 5.2. Market Analysis, Insights and Forecast - by Types
- 5.2.1. Below 250W
- 5.2.2. Above 250W
- 5.3. Market Analysis, Insights and Forecast - by Region
- 5.3.1. North America
- 5.3.2. South America
- 5.3.3. Europe
- 5.3.4. Middle East & Africa
- 5.3.5. Asia Pacific
- 5.1. Market Analysis, Insights and Forecast - by Application
- 6. North America Electric Bike Mid-drive Motor Analysis, Insights and Forecast, 2020-2032
- 6.1. Market Analysis, Insights and Forecast - by Application
- 6.1.1. OEM
- 6.1.2. Aftermarket
- 6.2. Market Analysis, Insights and Forecast - by Types
- 6.2.1. Below 250W
- 6.2.2. Above 250W
- 6.1. Market Analysis, Insights and Forecast - by Application
- 7. South America Electric Bike Mid-drive Motor Analysis, Insights and Forecast, 2020-2032
- 7.1. Market Analysis, Insights and Forecast - by Application
- 7.1.1. OEM
- 7.1.2. Aftermarket
- 7.2. Market Analysis, Insights and Forecast - by Types
- 7.2.1. Below 250W
- 7.2.2. Above 250W
- 7.1. Market Analysis, Insights and Forecast - by Application
- 8. Europe Electric Bike Mid-drive Motor Analysis, Insights and Forecast, 2020-2032
- 8.1. Market Analysis, Insights and Forecast - by Application
- 8.1.1. OEM
- 8.1.2. Aftermarket
- 8.2. Market Analysis, Insights and Forecast - by Types
- 8.2.1. Below 250W
- 8.2.2. Above 250W
- 8.1. Market Analysis, Insights and Forecast - by Application
- 9. Middle East & Africa Electric Bike Mid-drive Motor Analysis, Insights and Forecast, 2020-2032
- 9.1. Market Analysis, Insights and Forecast - by Application
- 9.1.1. OEM
- 9.1.2. Aftermarket
- 9.2. Market Analysis, Insights and Forecast - by Types
- 9.2.1. Below 250W
- 9.2.2. Above 250W
- 9.1. Market Analysis, Insights and Forecast - by Application
- 10. Asia Pacific Electric Bike Mid-drive Motor Analysis, Insights and Forecast, 2020-2032
- 10.1. Market Analysis, Insights and Forecast - by Application
- 10.1.1. OEM
- 10.1.2. Aftermarket
- 10.2. Market Analysis, Insights and Forecast - by Types
- 10.2.1. Below 250W
- 10.2.2. Above 250W
- 10.1. Market Analysis, Insights and Forecast - by Application
- 11. Competitive Analysis
- 11.1. Global Market Share Analysis 2025
- 11.2. Company Profiles
- 11.2.1 Bosch
- 11.2.1.1. Overview
- 11.2.1.2. Products
- 11.2.1.3. SWOT Analysis
- 11.2.1.4. Recent Developments
- 11.2.1.5. Financials (Based on Availability)
- 11.2.2 Yamaha
- 11.2.2.1. Overview
- 11.2.2.2. Products
- 11.2.2.3. SWOT Analysis
- 11.2.2.4. Recent Developments
- 11.2.2.5. Financials (Based on Availability)
- 11.2.3 Shimano
- 11.2.3.1. Overview
- 11.2.3.2. Products
- 11.2.3.3. SWOT Analysis
- 11.2.3.4. Recent Developments
- 11.2.3.5. Financials (Based on Availability)
- 11.2.4 Bafang
- 11.2.4.1. Overview
- 11.2.4.2. Products
- 11.2.4.3. SWOT Analysis
- 11.2.4.4. Recent Developments
- 11.2.4.5. Financials (Based on Availability)
- 11.2.5 Brose
- 11.2.5.1. Overview
- 11.2.5.2. Products
- 11.2.5.3. SWOT Analysis
- 11.2.5.4. Recent Developments
- 11.2.5.5. Financials (Based on Availability)
- 11.2.6 Panasonic
- 11.2.6.1. Overview
- 11.2.6.2. Products
- 11.2.6.3. SWOT Analysis
- 11.2.6.4. Recent Developments
- 11.2.6.5. Financials (Based on Availability)
- 11.2.7 Derby Cycle
- 11.2.7.1. Overview
- 11.2.7.2. Products
- 11.2.7.3. SWOT Analysis
- 11.2.7.4. Recent Developments
- 11.2.7.5. Financials (Based on Availability)
- 11.2.8 TQ-Group
- 11.2.8.1. Overview
- 11.2.8.2. Products
- 11.2.8.3. SWOT Analysis
- 11.2.8.4. Recent Developments
- 11.2.8.5. Financials (Based on Availability)
- 11.2.1 Bosch
List of Figures
- Figure 1: Global Electric Bike Mid-drive Motor Revenue Breakdown (undefined, %) by Region 2025 & 2033
- Figure 2: Global Electric Bike Mid-drive Motor Volume Breakdown (K, %) by Region 2025 & 2033
- Figure 3: North America Electric Bike Mid-drive Motor Revenue (undefined), by Application 2025 & 2033
- Figure 4: North America Electric Bike Mid-drive Motor Volume (K), by Application 2025 & 2033
- Figure 5: North America Electric Bike Mid-drive Motor Revenue Share (%), by Application 2025 & 2033
- Figure 6: North America Electric Bike Mid-drive Motor Volume Share (%), by Application 2025 & 2033
- Figure 7: North America Electric Bike Mid-drive Motor Revenue (undefined), by Types 2025 & 2033
- Figure 8: North America Electric Bike Mid-drive Motor Volume (K), by Types 2025 & 2033
- Figure 9: North America Electric Bike Mid-drive Motor Revenue Share (%), by Types 2025 & 2033
- Figure 10: North America Electric Bike Mid-drive Motor Volume Share (%), by Types 2025 & 2033
- Figure 11: North America Electric Bike Mid-drive Motor Revenue (undefined), by Country 2025 & 2033
- Figure 12: North America Electric Bike Mid-drive Motor Volume (K), by Country 2025 & 2033
- Figure 13: North America Electric Bike Mid-drive Motor Revenue Share (%), by Country 2025 & 2033
- Figure 14: North America Electric Bike Mid-drive Motor Volume Share (%), by Country 2025 & 2033
- Figure 15: South America Electric Bike Mid-drive Motor Revenue (undefined), by Application 2025 & 2033
- Figure 16: South America Electric Bike Mid-drive Motor Volume (K), by Application 2025 & 2033
- Figure 17: South America Electric Bike Mid-drive Motor Revenue Share (%), by Application 2025 & 2033
- Figure 18: South America Electric Bike Mid-drive Motor Volume Share (%), by Application 2025 & 2033
- Figure 19: South America Electric Bike Mid-drive Motor Revenue (undefined), by Types 2025 & 2033
- Figure 20: South America Electric Bike Mid-drive Motor Volume (K), by Types 2025 & 2033
- Figure 21: South America Electric Bike Mid-drive Motor Revenue Share (%), by Types 2025 & 2033
- Figure 22: South America Electric Bike Mid-drive Motor Volume Share (%), by Types 2025 & 2033
- Figure 23: South America Electric Bike Mid-drive Motor Revenue (undefined), by Country 2025 & 2033
- Figure 24: South America Electric Bike Mid-drive Motor Volume (K), by Country 2025 & 2033
- Figure 25: South America Electric Bike Mid-drive Motor Revenue Share (%), by Country 2025 & 2033
- Figure 26: South America Electric Bike Mid-drive Motor Volume Share (%), by Country 2025 & 2033
- Figure 27: Europe Electric Bike Mid-drive Motor Revenue (undefined), by Application 2025 & 2033
- Figure 28: Europe Electric Bike Mid-drive Motor Volume (K), by Application 2025 & 2033
- Figure 29: Europe Electric Bike Mid-drive Motor Revenue Share (%), by Application 2025 & 2033
- Figure 30: Europe Electric Bike Mid-drive Motor Volume Share (%), by Application 2025 & 2033
- Figure 31: Europe Electric Bike Mid-drive Motor Revenue (undefined), by Types 2025 & 2033
- Figure 32: Europe Electric Bike Mid-drive Motor Volume (K), by Types 2025 & 2033
- Figure 33: Europe Electric Bike Mid-drive Motor Revenue Share (%), by Types 2025 & 2033
- Figure 34: Europe Electric Bike Mid-drive Motor Volume Share (%), by Types 2025 & 2033
- Figure 35: Europe Electric Bike Mid-drive Motor Revenue (undefined), by Country 2025 & 2033
- Figure 36: Europe Electric Bike Mid-drive Motor Volume (K), by Country 2025 & 2033
- Figure 37: Europe Electric Bike Mid-drive Motor Revenue Share (%), by Country 2025 & 2033
- Figure 38: Europe Electric Bike Mid-drive Motor Volume Share (%), by Country 2025 & 2033
- Figure 39: Middle East & Africa Electric Bike Mid-drive Motor Revenue (undefined), by Application 2025 & 2033
- Figure 40: Middle East & Africa Electric Bike Mid-drive Motor Volume (K), by Application 2025 & 2033
- Figure 41: Middle East & Africa Electric Bike Mid-drive Motor Revenue Share (%), by Application 2025 & 2033
- Figure 42: Middle East & Africa Electric Bike Mid-drive Motor Volume Share (%), by Application 2025 & 2033
- Figure 43: Middle East & Africa Electric Bike Mid-drive Motor Revenue (undefined), by Types 2025 & 2033
- Figure 44: Middle East & Africa Electric Bike Mid-drive Motor Volume (K), by Types 2025 & 2033
- Figure 45: Middle East & Africa Electric Bike Mid-drive Motor Revenue Share (%), by Types 2025 & 2033
- Figure 46: Middle East & Africa Electric Bike Mid-drive Motor Volume Share (%), by Types 2025 & 2033
- Figure 47: Middle East & Africa Electric Bike Mid-drive Motor Revenue (undefined), by Country 2025 & 2033
- Figure 48: Middle East & Africa Electric Bike Mid-drive Motor Volume (K), by Country 2025 & 2033
- Figure 49: Middle East & Africa Electric Bike Mid-drive Motor Revenue Share (%), by Country 2025 & 2033
- Figure 50: Middle East & Africa Electric Bike Mid-drive Motor Volume Share (%), by Country 2025 & 2033
- Figure 51: Asia Pacific Electric Bike Mid-drive Motor Revenue (undefined), by Application 2025 & 2033
- Figure 52: Asia Pacific Electric Bike Mid-drive Motor Volume (K), by Application 2025 & 2033
- Figure 53: Asia Pacific Electric Bike Mid-drive Motor Revenue Share (%), by Application 2025 & 2033
- Figure 54: Asia Pacific Electric Bike Mid-drive Motor Volume Share (%), by Application 2025 & 2033
- Figure 55: Asia Pacific Electric Bike Mid-drive Motor Revenue (undefined), by Types 2025 & 2033
- Figure 56: Asia Pacific Electric Bike Mid-drive Motor Volume (K), by Types 2025 & 2033
- Figure 57: Asia Pacific Electric Bike Mid-drive Motor Revenue Share (%), by Types 2025 & 2033
- Figure 58: Asia Pacific Electric Bike Mid-drive Motor Volume Share (%), by Types 2025 & 2033
- Figure 59: Asia Pacific Electric Bike Mid-drive Motor Revenue (undefined), by Country 2025 & 2033
- Figure 60: Asia Pacific Electric Bike Mid-drive Motor Volume (K), by Country 2025 & 2033
- Figure 61: Asia Pacific Electric Bike Mid-drive Motor Revenue Share (%), by Country 2025 & 2033
- Figure 62: Asia Pacific Electric Bike Mid-drive Motor Volume Share (%), by Country 2025 & 2033
List of Tables
- Table 1: Global Electric Bike Mid-drive Motor Revenue undefined Forecast, by Application 2020 & 2033
- Table 2: Global Electric Bike Mid-drive Motor Volume K Forecast, by Application 2020 & 2033
- Table 3: Global Electric Bike Mid-drive Motor Revenue undefined Forecast, by Types 2020 & 2033
- Table 4: Global Electric Bike Mid-drive Motor Volume K Forecast, by Types 2020 & 2033
- Table 5: Global Electric Bike Mid-drive Motor Revenue undefined Forecast, by Region 2020 & 2033
- Table 6: Global Electric Bike Mid-drive Motor Volume K Forecast, by Region 2020 & 2033
- Table 7: Global Electric Bike Mid-drive Motor Revenue undefined Forecast, by Application 2020 & 2033
- Table 8: Global Electric Bike Mid-drive Motor Volume K Forecast, by Application 2020 & 2033
- Table 9: Global Electric Bike Mid-drive Motor Revenue undefined Forecast, by Types 2020 & 2033
- Table 10: Global Electric Bike Mid-drive Motor Volume K Forecast, by Types 2020 & 2033
- Table 11: Global Electric Bike Mid-drive Motor Revenue undefined Forecast, by Country 2020 & 2033
- Table 12: Global Electric Bike Mid-drive Motor Volume K Forecast, by Country 2020 & 2033
- Table 13: United States Electric Bike Mid-drive Motor Revenue (undefined) Forecast, by Application 2020 & 2033
- Table 14: United States Electric Bike Mid-drive Motor Volume (K) Forecast, by Application 2020 & 2033
- Table 15: Canada Electric Bike Mid-drive Motor Revenue (undefined) Forecast, by Application 2020 & 2033
- Table 16: Canada Electric Bike Mid-drive Motor Volume (K) Forecast, by Application 2020 & 2033
- Table 17: Mexico Electric Bike Mid-drive Motor Revenue (undefined) Forecast, by Application 2020 & 2033
- Table 18: Mexico Electric Bike Mid-drive Motor Volume (K) Forecast, by Application 2020 & 2033
- Table 19: Global Electric Bike Mid-drive Motor Revenue undefined Forecast, by Application 2020 & 2033
- Table 20: Global Electric Bike Mid-drive Motor Volume K Forecast, by Application 2020 & 2033
- Table 21: Global Electric Bike Mid-drive Motor Revenue undefined Forecast, by Types 2020 & 2033
- Table 22: Global Electric Bike Mid-drive Motor Volume K Forecast, by Types 2020 & 2033
- Table 23: Global Electric Bike Mid-drive Motor Revenue undefined Forecast, by Country 2020 & 2033
- Table 24: Global Electric Bike Mid-drive Motor Volume K Forecast, by Country 2020 & 2033
- Table 25: Brazil Electric Bike Mid-drive Motor Revenue (undefined) Forecast, by Application 2020 & 2033
- Table 26: Brazil Electric Bike Mid-drive Motor Volume (K) Forecast, by Application 2020 & 2033
- Table 27: Argentina Electric Bike Mid-drive Motor Revenue (undefined) Forecast, by Application 2020 & 2033
- Table 28: Argentina Electric Bike Mid-drive Motor Volume (K) Forecast, by Application 2020 & 2033
- Table 29: Rest of South America Electric Bike Mid-drive Motor Revenue (undefined) Forecast, by Application 2020 & 2033
- Table 30: Rest of South America Electric Bike Mid-drive Motor Volume (K) Forecast, by Application 2020 & 2033
- Table 31: Global Electric Bike Mid-drive Motor Revenue undefined Forecast, by Application 2020 & 2033
- Table 32: Global Electric Bike Mid-drive Motor Volume K Forecast, by Application 2020 & 2033
- Table 33: Global Electric Bike Mid-drive Motor Revenue undefined Forecast, by Types 2020 & 2033
- Table 34: Global Electric Bike Mid-drive Motor Volume K Forecast, by Types 2020 & 2033
- Table 35: Global Electric Bike Mid-drive Motor Revenue undefined Forecast, by Country 2020 & 2033
- Table 36: Global Electric Bike Mid-drive Motor Volume K Forecast, by Country 2020 & 2033
- Table 37: United Kingdom Electric Bike Mid-drive Motor Revenue (undefined) Forecast, by Application 2020 & 2033
- Table 38: United Kingdom Electric Bike Mid-drive Motor Volume (K) Forecast, by Application 2020 & 2033
- Table 39: Germany Electric Bike Mid-drive Motor Revenue (undefined) Forecast, by Application 2020 & 2033
- Table 40: Germany Electric Bike Mid-drive Motor Volume (K) Forecast, by Application 2020 & 2033
- Table 41: France Electric Bike Mid-drive Motor Revenue (undefined) Forecast, by Application 2020 & 2033
- Table 42: France Electric Bike Mid-drive Motor Volume (K) Forecast, by Application 2020 & 2033
- Table 43: Italy Electric Bike Mid-drive Motor Revenue (undefined) Forecast, by Application 2020 & 2033
- Table 44: Italy Electric Bike Mid-drive Motor Volume (K) Forecast, by Application 2020 & 2033
- Table 45: Spain Electric Bike Mid-drive Motor Revenue (undefined) Forecast, by Application 2020 & 2033
- Table 46: Spain Electric Bike Mid-drive Motor Volume (K) Forecast, by Application 2020 & 2033
- Table 47: Russia Electric Bike Mid-drive Motor Revenue (undefined) Forecast, by Application 2020 & 2033
- Table 48: Russia Electric Bike Mid-drive Motor Volume (K) Forecast, by Application 2020 & 2033
- Table 49: Benelux Electric Bike Mid-drive Motor Revenue (undefined) Forecast, by Application 2020 & 2033
- Table 50: Benelux Electric Bike Mid-drive Motor Volume (K) Forecast, by Application 2020 & 2033
- Table 51: Nordics Electric Bike Mid-drive Motor Revenue (undefined) Forecast, by Application 2020 & 2033
- Table 52: Nordics Electric Bike Mid-drive Motor Volume (K) Forecast, by Application 2020 & 2033
- Table 53: Rest of Europe Electric Bike Mid-drive Motor Revenue (undefined) Forecast, by Application 2020 & 2033
- Table 54: Rest of Europe Electric Bike Mid-drive Motor Volume (K) Forecast, by Application 2020 & 2033
- Table 55: Global Electric Bike Mid-drive Motor Revenue undefined Forecast, by Application 2020 & 2033
- Table 56: Global Electric Bike Mid-drive Motor Volume K Forecast, by Application 2020 & 2033
- Table 57: Global Electric Bike Mid-drive Motor Revenue undefined Forecast, by Types 2020 & 2033
- Table 58: Global Electric Bike Mid-drive Motor Volume K Forecast, by Types 2020 & 2033
- Table 59: Global Electric Bike Mid-drive Motor Revenue undefined Forecast, by Country 2020 & 2033
- Table 60: Global Electric Bike Mid-drive Motor Volume K Forecast, by Country 2020 & 2033
- Table 61: Turkey Electric Bike Mid-drive Motor Revenue (undefined) Forecast, by Application 2020 & 2033
- Table 62: Turkey Electric Bike Mid-drive Motor Volume (K) Forecast, by Application 2020 & 2033
- Table 63: Israel Electric Bike Mid-drive Motor Revenue (undefined) Forecast, by Application 2020 & 2033
- Table 64: Israel Electric Bike Mid-drive Motor Volume (K) Forecast, by Application 2020 & 2033
- Table 65: GCC Electric Bike Mid-drive Motor Revenue (undefined) Forecast, by Application 2020 & 2033
- Table 66: GCC Electric Bike Mid-drive Motor Volume (K) Forecast, by Application 2020 & 2033
- Table 67: North Africa Electric Bike Mid-drive Motor Revenue (undefined) Forecast, by Application 2020 & 2033
- Table 68: North Africa Electric Bike Mid-drive Motor Volume (K) Forecast, by Application 2020 & 2033
- Table 69: South Africa Electric Bike Mid-drive Motor Revenue (undefined) Forecast, by Application 2020 & 2033
- Table 70: South Africa Electric Bike Mid-drive Motor Volume (K) Forecast, by Application 2020 & 2033
- Table 71: Rest of Middle East & Africa Electric Bike Mid-drive Motor Revenue (undefined) Forecast, by Application 2020 & 2033
- Table 72: Rest of Middle East & Africa Electric Bike Mid-drive Motor Volume (K) Forecast, by Application 2020 & 2033
- Table 73: Global Electric Bike Mid-drive Motor Revenue undefined Forecast, by Application 2020 & 2033
- Table 74: Global Electric Bike Mid-drive Motor Volume K Forecast, by Application 2020 & 2033
- Table 75: Global Electric Bike Mid-drive Motor Revenue undefined Forecast, by Types 2020 & 2033
- Table 76: Global Electric Bike Mid-drive Motor Volume K Forecast, by Types 2020 & 2033
- Table 77: Global Electric Bike Mid-drive Motor Revenue undefined Forecast, by Country 2020 & 2033
- Table 78: Global Electric Bike Mid-drive Motor Volume K Forecast, by Country 2020 & 2033
- Table 79: China Electric Bike Mid-drive Motor Revenue (undefined) Forecast, by Application 2020 & 2033
- Table 80: China Electric Bike Mid-drive Motor Volume (K) Forecast, by Application 2020 & 2033
- Table 81: India Electric Bike Mid-drive Motor Revenue (undefined) Forecast, by Application 2020 & 2033
- Table 82: India Electric Bike Mid-drive Motor Volume (K) Forecast, by Application 2020 & 2033
- Table 83: Japan Electric Bike Mid-drive Motor Revenue (undefined) Forecast, by Application 2020 & 2033
- Table 84: Japan Electric Bike Mid-drive Motor Volume (K) Forecast, by Application 2020 & 2033
- Table 85: South Korea Electric Bike Mid-drive Motor Revenue (undefined) Forecast, by Application 2020 & 2033
- Table 86: South Korea Electric Bike Mid-drive Motor Volume (K) Forecast, by Application 2020 & 2033
- Table 87: ASEAN Electric Bike Mid-drive Motor Revenue (undefined) Forecast, by Application 2020 & 2033
- Table 88: ASEAN Electric Bike Mid-drive Motor Volume (K) Forecast, by Application 2020 & 2033
- Table 89: Oceania Electric Bike Mid-drive Motor Revenue (undefined) Forecast, by Application 2020 & 2033
- Table 90: Oceania Electric Bike Mid-drive Motor Volume (K) Forecast, by Application 2020 & 2033
- Table 91: Rest of Asia Pacific Electric Bike Mid-drive Motor Revenue (undefined) Forecast, by Application 2020 & 2033
- Table 92: Rest of Asia Pacific Electric Bike Mid-drive Motor Volume (K) Forecast, by Application 2020 & 2033
Frequently Asked Questions
1. What is the projected Compound Annual Growth Rate (CAGR) of the Electric Bike Mid-drive Motor?
The projected CAGR is approximately 9.3%.
2. Which companies are prominent players in the Electric Bike Mid-drive Motor?
Key companies in the market include Bosch, Yamaha, Shimano, Bafang, Brose, Panasonic, Derby Cycle, TQ-Group.
3. What are the main segments of the Electric Bike Mid-drive Motor?
The market segments include Application, Types.
4. Can you provide details about the market size?
The market size is estimated to be USD XXX N/A as of 2022.
5. What are some drivers contributing to market growth?
N/A
6. What are the notable trends driving market growth?
N/A
7. Are there any restraints impacting market growth?
N/A
8. Can you provide examples of recent developments in the market?
N/A
9. What pricing options are available for accessing the report?
Pricing options include single-user, multi-user, and enterprise licenses priced at USD 3350.00, USD 5025.00, and USD 6700.00 respectively.
10. Is the market size provided in terms of value or volume?
The market size is provided in terms of value, measured in N/A and volume, measured in K.
11. Are there any specific market keywords associated with the report?
Yes, the market keyword associated with the report is "Electric Bike Mid-drive Motor," which aids in identifying and referencing the specific market segment covered.
12. How do I determine which pricing option suits my needs best?
The pricing options vary based on user requirements and access needs. Individual users may opt for single-user licenses, while businesses requiring broader access may choose multi-user or enterprise licenses for cost-effective access to the report.
13. Are there any additional resources or data provided in the Electric Bike Mid-drive Motor report?
While the report offers comprehensive insights, it's advisable to review the specific contents or supplementary materials provided to ascertain if additional resources or data are available.
14. How can I stay updated on further developments or reports in the Electric Bike Mid-drive Motor?
To stay informed about further developments, trends, and reports in the Electric Bike Mid-drive Motor, consider subscribing to industry newsletters, following relevant companies and organizations, or regularly checking reputable industry news sources and publications.
Methodology
Step 1 - Identification of Relevant Samples Size from Population Database


Step 2 - Approaches for Defining Global Market Size (Value, Volume* & Price*)

Note*: In applicable scenarios
Step 3 - Data Sources
Primary Research
- Web Analytics
- Survey Reports
- Research Institute
- Latest Research Reports
- Opinion Leaders
Secondary Research
- Annual Reports
- White Paper
- Latest Press Release
- Industry Association
- Paid Database
- Investor Presentations

Step 4 - Data Triangulation
Involves using different sources of information in order to increase the validity of a study
These sources are likely to be stakeholders in a program - participants, other researchers, program staff, other community members, and so on.
Then we put all data in single framework & apply various statistical tools to find out the dynamic on the market.
During the analysis stage, feedback from the stakeholder groups would be compared to determine areas of agreement as well as areas of divergence