

Key Insights
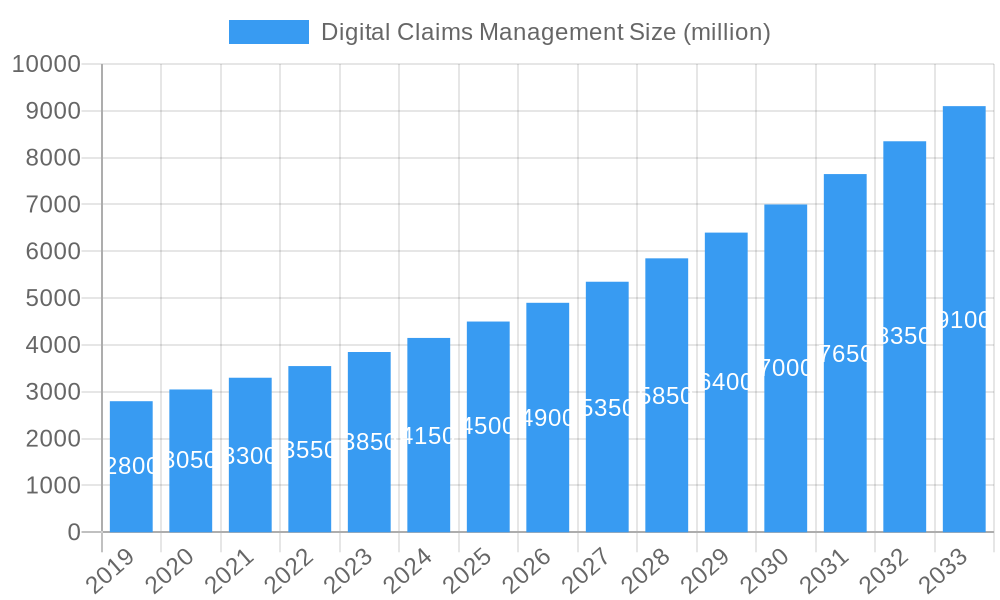
The Digital Claims Management market is projected for significant expansion, with an estimated Compound Annual Growth Rate (CAGR) of 7.55%. This growth trajectory is anticipated to elevate the market size to approximately 16.8 billion by 2032, based on a 2024 base year. This expansion is fueled by the escalating demand for efficient, transparent, and customer-centric claims processing across diverse industries. Key growth drivers include the increasing adoption of advanced technologies such as artificial intelligence (AI), machine learning, and automation, which streamline workflows, reduce operational costs, and improve the accuracy of claims adjudication. Furthermore, the widespread availability of digital platforms and mobile applications facilitates seamless claims submission and tracking, enhancing the overall customer experience. The evolving landscape of remote work and the increasing complexity of insurance policies also contribute to the demand for sophisticated digital claims management solutions. These solutions enable insurers to manage a higher volume of claims with enhanced speed and precision, ultimately leading to improved customer satisfaction and loyalty. The market's progression indicates a strong trend towards paperless operations and automated decision-making, which are essential for modernizing insurance and financial services.
Digital Claims Management Market Size (In Billion)
The market is segmented by application, with a substantial portion serving buyers with turnovers below EUR 5 million, highlighting the growing need for scalable digital solutions among small and medium-sized enterprises. Concurrently, larger enterprises with turnovers exceeding EUR 5 million are making significant investments in these platforms to optimize their complex claims processes. While web-based platforms currently hold a dominant position, the rapid adoption of mobile devices indicates a rising demand for Android and iOS applications. Geographically, North America and Europe are leading the adoption of digital claims management due to their mature insurance markets and early integration of technological innovations. However, the Asia Pacific region is projected to exhibit the highest growth rate in the coming years, driven by digital transformation initiatives and a growing middle class seeking enhanced insurance services. Emerging trends encompass the integration of blockchain for improved security and transparency, and the utilization of predictive analytics for proactive identification of fraudulent claims. Despite the market's robust growth potential, challenges such as data security concerns and the initial investment costs for implementing new systems may present some limitations.
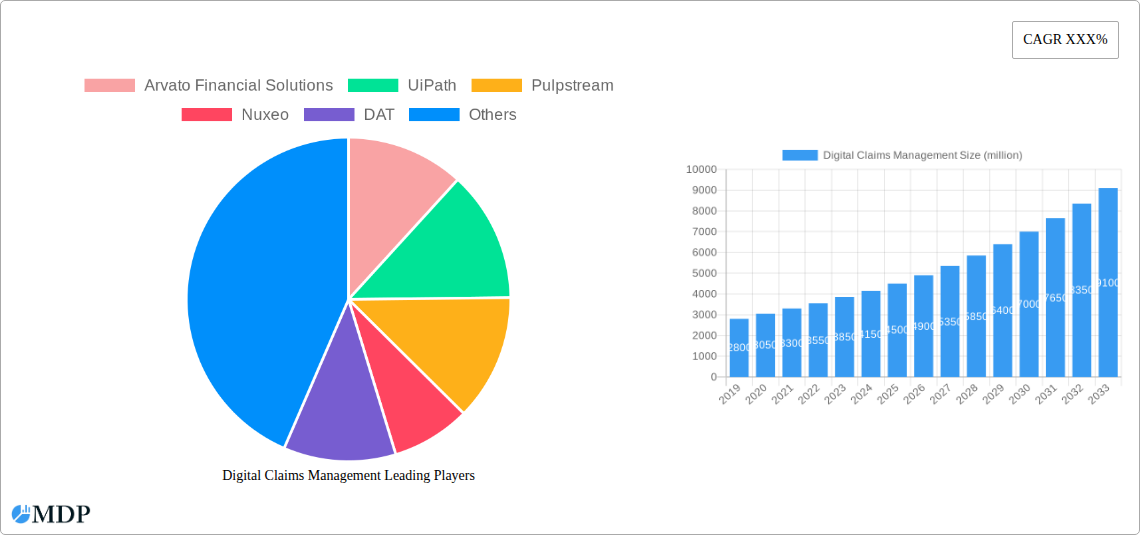
Digital Claims Management Company Market Share
Digital Claims Management: Comprehensive Market Report (2019-2033)
This in-depth report offers a definitive analysis of the Digital Claims Management market, providing critical insights for industry stakeholders. Spanning a study period from 2019 to 2033, with a base year of 2025 and an extensive forecast period from 2025 to 2033, this research meticulously examines market dynamics, trends, leading players, and future opportunities. With a historical analysis from 2019 to 2024, the report delivers a robust understanding of the market's evolution and trajectory. Explore segments including Buyer Turnover below EUR 5 Million and above EUR 5 Million, and application types such as Web, Android, and iOS. Key companies analyzed include Arvato Financial Solutions, UiPath, Pulpstream, Nuxeo, DAT, and ERGO Group AG. This report is essential for insurers, technology providers, and financial institutions seeking to navigate the complexities and capitalize on the growth of digital claims processing.
Digital Claims Management Market Dynamics & Concentration
The Digital Claims Management market is characterized by moderate to high concentration, driven by ongoing technological innovation and a clear shift towards digital-first customer experiences. Regulatory frameworks are increasingly supportive of digital transformation, encouraging faster and more transparent claims processes. Key innovation drivers include the adoption of AI and machine learning for fraud detection, automated damage assessment via image recognition, and improved customer communication through chatbots and mobile applications. Product substitutes, such as traditional manual claims processing, are rapidly declining in relevance as their inefficiencies become more apparent. End-user trends clearly favor speed, convenience, and self-service options, pushing providers to enhance their digital offerings. Merger and acquisition (M&A) activities are expected to remain robust, with an estimated 50 significant deals projected over the forecast period, as larger players seek to acquire innovative technologies and expand their market share. Market share is fluid, with leading providers holding approximately 15% of the market, indicating significant room for growth and consolidation.
Digital Claims Management Industry Trends & Analysis
The Digital Claims Management industry is poised for substantial growth, projected to achieve a Compound Annual Growth Rate (CAGR) of 12% over the forecast period of 2025-2033. This impressive expansion is fueled by several interconnected trends. Firstly, the increasing demand for enhanced customer experience is a paramount driver. Policyholders expect seamless, intuitive, and rapid claims resolution, pushing insurers to invest heavily in digital platforms. The penetration of smartphones and ubiquitous internet access further empowers consumers to engage with claims processes remotely, driving the adoption of mobile and web-based solutions. Secondly, technological advancements are revolutionizing every stage of the claims lifecycle. Artificial intelligence (AI) and machine learning are being deployed for intelligent document processing, predictive analytics for fraud detection, and automated assessment of damages through image and video analysis. Robotic Process Automation (RPA) is streamlining repetitive tasks, reducing operational costs and human error. The integration of IoT devices, such as telematics in vehicles, provides real-time data that can expedite claim validation and settlement. Furthermore, the growing emphasis on data analytics enables insurers to gain deeper insights into claims patterns, optimize resource allocation, and personalize customer interactions. Blockchain technology is also emerging as a potential disruptor, offering enhanced transparency and security in claims data management. The competitive landscape is dynamic, with established insurance carriers and specialized InsurTech firms vying for market dominance. This competition stimulates further innovation and drives down costs, ultimately benefiting end-users. The market penetration of digital claims management solutions, currently estimated at 35%, is expected to climb significantly as more organizations recognize the strategic imperative of digital transformation to remain competitive and meet evolving customer expectations. The continued development of cloud-based solutions and the growing adoption of APIs for seamless integration with other enterprise systems will further accelerate this trend.
Leading Markets & Segments in Digital Claims Management
The Buyer: Turnover above EUR 5 Million segment is anticipated to exhibit the most significant dominance within the Digital Claims Management market. This is primarily driven by the substantial financial resources and complex operational needs of these larger enterprises, which necessitate robust and efficient claims management systems to mitigate financial risks and maintain operational continuity. Economic policies that encourage digitalization and streamline regulatory compliance for businesses also play a crucial role in fostering the adoption of advanced digital claims solutions in this segment. Furthermore, the infrastructure required to support sophisticated digital claims management, including advanced IT systems and skilled personnel, is more readily available within organizations of this scale.
Within the application types, Web-based solutions are expected to maintain a leading position due to their accessibility, broad compatibility, and ease of integration with existing enterprise resource planning (ERP) systems. This makes them a preferred choice for businesses of all sizes, particularly those with a significant volume of claims. However, the Android and iOS segments are experiencing rapid growth, driven by the increasing prevalence of mobile devices and the demand for on-the-go claims processing and customer interaction. Insurers are increasingly developing native mobile applications to offer a more personalized and convenient experience for policyholders, especially for simpler claims that can be managed entirely through a smartphone.
The Buyer: Turnover below EUR 5 Million segment, while representing a larger number of potential users, will also see significant adoption, albeit with a preference for more cost-effective and scalable solutions. The economic policies that support small and medium-sized enterprises (SMEs) in adopting digital technologies are critical enablers for this segment. As the cost of digital claims management solutions decreases and user-friendliness increases, this segment is projected to grow substantially. The overall trend across all segments points towards a comprehensive digital ecosystem that integrates web, mobile, and potentially IoT data to provide a holistic and efficient claims management experience.
Digital Claims Management Product Developments
Recent product developments in Digital Claims Management are heavily focused on enhancing automation, intelligence, and user experience. Innovations include AI-powered chatbots that can handle initial claim intake and answer frequently asked questions, reducing the burden on human agents. Advanced image and video analysis tools are now capable of automatically assessing damage to vehicles and property, significantly speeding up the validation process. Predictive analytics are being integrated to identify potential fraud patterns at an earlier stage. Furthermore, platforms are offering seamless integration with third-party services such as repair shops and medical providers, creating a more connected ecosystem for claim resolution. The competitive advantage lies in solutions that offer end-to-end automation, real-time data insights, and a superior customer journey.
Key Drivers of Digital Claims Management Growth
The growth of the Digital Claims Management market is propelled by several key factors. Technologically, the widespread adoption of AI, machine learning, and robotic process automation is enabling unprecedented levels of efficiency and accuracy in claims processing. Economically, the increasing demand for cost reduction and operational efficiency within the insurance industry is driving the adoption of digital solutions. Regulatory frameworks that promote data privacy and digital transformation are also creating a more favorable environment for innovation. The shift in consumer preferences towards faster, more convenient, and self-service claims experiences further fuels this growth.
Challenges in the Digital Claims Management Market
Despite the positive outlook, the Digital Claims Management market faces several challenges. Regulatory hurdles related to data security and compliance can slow down the implementation of new technologies. Interoperability issues between disparate legacy systems and new digital platforms can create significant integration challenges, impacting the smooth flow of data. The substantial upfront investment required for comprehensive digital transformation can be a barrier for smaller organizations. Furthermore, the need for a skilled workforce capable of managing and leveraging these advanced digital tools presents an ongoing challenge. Competitive pressures also drive rapid innovation, requiring continuous investment and adaptation.
Emerging Opportunities in Digital Claims Management
Emerging opportunities in the Digital Claims Management market are primarily driven by technological breakthroughs and evolving customer expectations. The continued advancement of AI and machine learning offers immense potential for hyper-personalization of claims services and even more sophisticated fraud detection. Strategic partnerships between InsurTech firms and traditional insurers are likely to accelerate the adoption of innovative solutions. The expansion into new geographical markets and the development of specialized digital claims solutions for emerging risks, such as cyber incidents and climate-related disasters, represent significant growth avenues.
Leading Players in the Digital Claims Management Sector
- Arvato Financial Solutions
- UiPath
- Pulpstream
- Nuxeo
- DAT
- ERGO Group AG
Key Milestones in Digital Claims Management Industry
- 2019: Increased adoption of AI for fraud detection in insurance claims.
- 2020: Growth in demand for mobile-first claims processing solutions.
- 2021: Expansion of RPA applications to automate administrative tasks in claims handling.
- 2022: Emergence of advanced image recognition for automated damage assessment.
- 2023: Increased focus on customer experience enhancement through digital channels.
- 2024: Exploration of blockchain technology for enhanced data security and transparency.
Strategic Outlook for Digital Claims Management Market
The strategic outlook for the Digital Claims Management market remains exceptionally positive, driven by the relentless pursuit of efficiency, customer satisfaction, and innovation. Growth accelerators will include the continued integration of advanced AI and predictive analytics to further refine fraud detection and personalize customer interactions. Investments in cloud-native architectures will enable greater scalability and agility for service providers. The development of comprehensive digital ecosystems, seamlessly connecting policyholders, insurers, and service providers, will be a key differentiator. Strategic opportunities lie in leveraging data analytics for proactive risk management and expanding digital claims capabilities into new markets and niche insurance segments.
Digital Claims Management Segmentation
-
1. Application
- 1.1. Buyer: Turnover below EUR 5 Million
- 1.2. Buyer: Turnover above EUR 5 Million
-
2. Type
- 2.1. Web
- 2.2. Android
- 2.3. IOS
Digital Claims Management Segmentation By Geography
-
1. North America
- 1.1. United States
- 1.2. Canada
- 1.3. Mexico
-
2. South America
- 2.1. Brazil
- 2.2. Argentina
- 2.3. Rest of South America
-
3. Europe
- 3.1. United Kingdom
- 3.2. Germany
- 3.3. France
- 3.4. Italy
- 3.5. Spain
- 3.6. Russia
- 3.7. Benelux
- 3.8. Nordics
- 3.9. Rest of Europe
-
4. Middle East & Africa
- 4.1. Turkey
- 4.2. Israel
- 4.3. GCC
- 4.4. North Africa
- 4.5. South Africa
- 4.6. Rest of Middle East & Africa
-
5. Asia Pacific
- 5.1. China
- 5.2. India
- 5.3. Japan
- 5.4. South Korea
- 5.5. ASEAN
- 5.6. Oceania
- 5.7. Rest of Asia Pacific
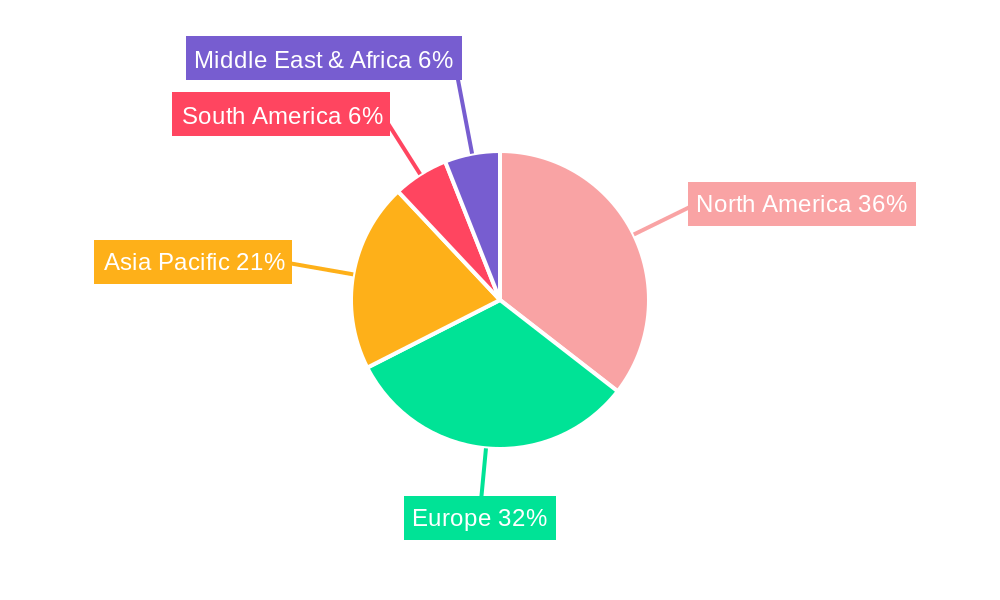
Digital Claims Management Regional Market Share
Geographic Coverage of Digital Claims Management
Digital Claims Management REPORT HIGHLIGHTS
| Aspects | Details |
|---|---|
| Study Period | 2020-2034 |
| Base Year | 2025 |
| Estimated Year | 2026 |
| Forecast Period | 2026-2034 |
| Historical Period | 2020-2025 |
| Growth Rate | CAGR of 7.55% from 2020-2034 |
| Segmentation |
|
Table of Contents
- 1. Introduction
- 1.1. Research Scope
- 1.2. Market Segmentation
- 1.3. Research Methodology
- 1.4. Definitions and Assumptions
- 2. Executive Summary
- 2.1. Introduction
- 3. Market Dynamics
- 3.1. Introduction
- 3.2. Market Drivers
- 3.3. Market Restrains
- 3.4. Market Trends
- 4. Market Factor Analysis
- 4.1. Porters Five Forces
- 4.2. Supply/Value Chain
- 4.3. PESTEL analysis
- 4.4. Market Entropy
- 4.5. Patent/Trademark Analysis
- 5. Global Digital Claims Management Analysis, Insights and Forecast, 2020-2032
- 5.1. Market Analysis, Insights and Forecast - by Application
- 5.1.1. Buyer: Turnover below EUR 5 Million
- 5.1.2. Buyer: Turnover above EUR 5 Million
- 5.2. Market Analysis, Insights and Forecast - by Type
- 5.2.1. Web
- 5.2.2. Android
- 5.2.3. IOS
- 5.3. Market Analysis, Insights and Forecast - by Region
- 5.3.1. North America
- 5.3.2. South America
- 5.3.3. Europe
- 5.3.4. Middle East & Africa
- 5.3.5. Asia Pacific
- 5.1. Market Analysis, Insights and Forecast - by Application
- 6. North America Digital Claims Management Analysis, Insights and Forecast, 2020-2032
- 6.1. Market Analysis, Insights and Forecast - by Application
- 6.1.1. Buyer: Turnover below EUR 5 Million
- 6.1.2. Buyer: Turnover above EUR 5 Million
- 6.2. Market Analysis, Insights and Forecast - by Type
- 6.2.1. Web
- 6.2.2. Android
- 6.2.3. IOS
- 6.1. Market Analysis, Insights and Forecast - by Application
- 7. South America Digital Claims Management Analysis, Insights and Forecast, 2020-2032
- 7.1. Market Analysis, Insights and Forecast - by Application
- 7.1.1. Buyer: Turnover below EUR 5 Million
- 7.1.2. Buyer: Turnover above EUR 5 Million
- 7.2. Market Analysis, Insights and Forecast - by Type
- 7.2.1. Web
- 7.2.2. Android
- 7.2.3. IOS
- 7.1. Market Analysis, Insights and Forecast - by Application
- 8. Europe Digital Claims Management Analysis, Insights and Forecast, 2020-2032
- 8.1. Market Analysis, Insights and Forecast - by Application
- 8.1.1. Buyer: Turnover below EUR 5 Million
- 8.1.2. Buyer: Turnover above EUR 5 Million
- 8.2. Market Analysis, Insights and Forecast - by Type
- 8.2.1. Web
- 8.2.2. Android
- 8.2.3. IOS
- 8.1. Market Analysis, Insights and Forecast - by Application
- 9. Middle East & Africa Digital Claims Management Analysis, Insights and Forecast, 2020-2032
- 9.1. Market Analysis, Insights and Forecast - by Application
- 9.1.1. Buyer: Turnover below EUR 5 Million
- 9.1.2. Buyer: Turnover above EUR 5 Million
- 9.2. Market Analysis, Insights and Forecast - by Type
- 9.2.1. Web
- 9.2.2. Android
- 9.2.3. IOS
- 9.1. Market Analysis, Insights and Forecast - by Application
- 10. Asia Pacific Digital Claims Management Analysis, Insights and Forecast, 2020-2032
- 10.1. Market Analysis, Insights and Forecast - by Application
- 10.1.1. Buyer: Turnover below EUR 5 Million
- 10.1.2. Buyer: Turnover above EUR 5 Million
- 10.2. Market Analysis, Insights and Forecast - by Type
- 10.2.1. Web
- 10.2.2. Android
- 10.2.3. IOS
- 10.1. Market Analysis, Insights and Forecast - by Application
- 11. Competitive Analysis
- 11.1. Global Market Share Analysis 2025
- 11.2. Company Profiles
- 11.2.1 Arvato Financial Solutions
- 11.2.1.1. Overview
- 11.2.1.2. Products
- 11.2.1.3. SWOT Analysis
- 11.2.1.4. Recent Developments
- 11.2.1.5. Financials (Based on Availability)
- 11.2.2 UiPath
- 11.2.2.1. Overview
- 11.2.2.2. Products
- 11.2.2.3. SWOT Analysis
- 11.2.2.4. Recent Developments
- 11.2.2.5. Financials (Based on Availability)
- 11.2.3 Pulpstream
- 11.2.3.1. Overview
- 11.2.3.2. Products
- 11.2.3.3. SWOT Analysis
- 11.2.3.4. Recent Developments
- 11.2.3.5. Financials (Based on Availability)
- 11.2.4 Nuxeo
- 11.2.4.1. Overview
- 11.2.4.2. Products
- 11.2.4.3. SWOT Analysis
- 11.2.4.4. Recent Developments
- 11.2.4.5. Financials (Based on Availability)
- 11.2.5 DAT
- 11.2.5.1. Overview
- 11.2.5.2. Products
- 11.2.5.3. SWOT Analysis
- 11.2.5.4. Recent Developments
- 11.2.5.5. Financials (Based on Availability)
- 11.2.6 ERGO Group AG
- 11.2.6.1. Overview
- 11.2.6.2. Products
- 11.2.6.3. SWOT Analysis
- 11.2.6.4. Recent Developments
- 11.2.6.5. Financials (Based on Availability)
- 11.2.1 Arvato Financial Solutions
List of Figures
- Figure 1: Global Digital Claims Management Revenue Breakdown (billion, %) by Region 2025 & 2033
- Figure 2: North America Digital Claims Management Revenue (billion), by Application 2025 & 2033
- Figure 3: North America Digital Claims Management Revenue Share (%), by Application 2025 & 2033
- Figure 4: North America Digital Claims Management Revenue (billion), by Type 2025 & 2033
- Figure 5: North America Digital Claims Management Revenue Share (%), by Type 2025 & 2033
- Figure 6: North America Digital Claims Management Revenue (billion), by Country 2025 & 2033
- Figure 7: North America Digital Claims Management Revenue Share (%), by Country 2025 & 2033
- Figure 8: South America Digital Claims Management Revenue (billion), by Application 2025 & 2033
- Figure 9: South America Digital Claims Management Revenue Share (%), by Application 2025 & 2033
- Figure 10: South America Digital Claims Management Revenue (billion), by Type 2025 & 2033
- Figure 11: South America Digital Claims Management Revenue Share (%), by Type 2025 & 2033
- Figure 12: South America Digital Claims Management Revenue (billion), by Country 2025 & 2033
- Figure 13: South America Digital Claims Management Revenue Share (%), by Country 2025 & 2033
- Figure 14: Europe Digital Claims Management Revenue (billion), by Application 2025 & 2033
- Figure 15: Europe Digital Claims Management Revenue Share (%), by Application 2025 & 2033
- Figure 16: Europe Digital Claims Management Revenue (billion), by Type 2025 & 2033
- Figure 17: Europe Digital Claims Management Revenue Share (%), by Type 2025 & 2033
- Figure 18: Europe Digital Claims Management Revenue (billion), by Country 2025 & 2033
- Figure 19: Europe Digital Claims Management Revenue Share (%), by Country 2025 & 2033
- Figure 20: Middle East & Africa Digital Claims Management Revenue (billion), by Application 2025 & 2033
- Figure 21: Middle East & Africa Digital Claims Management Revenue Share (%), by Application 2025 & 2033
- Figure 22: Middle East & Africa Digital Claims Management Revenue (billion), by Type 2025 & 2033
- Figure 23: Middle East & Africa Digital Claims Management Revenue Share (%), by Type 2025 & 2033
- Figure 24: Middle East & Africa Digital Claims Management Revenue (billion), by Country 2025 & 2033
- Figure 25: Middle East & Africa Digital Claims Management Revenue Share (%), by Country 2025 & 2033
- Figure 26: Asia Pacific Digital Claims Management Revenue (billion), by Application 2025 & 2033
- Figure 27: Asia Pacific Digital Claims Management Revenue Share (%), by Application 2025 & 2033
- Figure 28: Asia Pacific Digital Claims Management Revenue (billion), by Type 2025 & 2033
- Figure 29: Asia Pacific Digital Claims Management Revenue Share (%), by Type 2025 & 2033
- Figure 30: Asia Pacific Digital Claims Management Revenue (billion), by Country 2025 & 2033
- Figure 31: Asia Pacific Digital Claims Management Revenue Share (%), by Country 2025 & 2033
List of Tables
- Table 1: Global Digital Claims Management Revenue billion Forecast, by Application 2020 & 2033
- Table 2: Global Digital Claims Management Revenue billion Forecast, by Type 2020 & 2033
- Table 3: Global Digital Claims Management Revenue billion Forecast, by Region 2020 & 2033
- Table 4: Global Digital Claims Management Revenue billion Forecast, by Application 2020 & 2033
- Table 5: Global Digital Claims Management Revenue billion Forecast, by Type 2020 & 2033
- Table 6: Global Digital Claims Management Revenue billion Forecast, by Country 2020 & 2033
- Table 7: United States Digital Claims Management Revenue (billion) Forecast, by Application 2020 & 2033
- Table 8: Canada Digital Claims Management Revenue (billion) Forecast, by Application 2020 & 2033
- Table 9: Mexico Digital Claims Management Revenue (billion) Forecast, by Application 2020 & 2033
- Table 10: Global Digital Claims Management Revenue billion Forecast, by Application 2020 & 2033
- Table 11: Global Digital Claims Management Revenue billion Forecast, by Type 2020 & 2033
- Table 12: Global Digital Claims Management Revenue billion Forecast, by Country 2020 & 2033
- Table 13: Brazil Digital Claims Management Revenue (billion) Forecast, by Application 2020 & 2033
- Table 14: Argentina Digital Claims Management Revenue (billion) Forecast, by Application 2020 & 2033
- Table 15: Rest of South America Digital Claims Management Revenue (billion) Forecast, by Application 2020 & 2033
- Table 16: Global Digital Claims Management Revenue billion Forecast, by Application 2020 & 2033
- Table 17: Global Digital Claims Management Revenue billion Forecast, by Type 2020 & 2033
- Table 18: Global Digital Claims Management Revenue billion Forecast, by Country 2020 & 2033
- Table 19: United Kingdom Digital Claims Management Revenue (billion) Forecast, by Application 2020 & 2033
- Table 20: Germany Digital Claims Management Revenue (billion) Forecast, by Application 2020 & 2033
- Table 21: France Digital Claims Management Revenue (billion) Forecast, by Application 2020 & 2033
- Table 22: Italy Digital Claims Management Revenue (billion) Forecast, by Application 2020 & 2033
- Table 23: Spain Digital Claims Management Revenue (billion) Forecast, by Application 2020 & 2033
- Table 24: Russia Digital Claims Management Revenue (billion) Forecast, by Application 2020 & 2033
- Table 25: Benelux Digital Claims Management Revenue (billion) Forecast, by Application 2020 & 2033
- Table 26: Nordics Digital Claims Management Revenue (billion) Forecast, by Application 2020 & 2033
- Table 27: Rest of Europe Digital Claims Management Revenue (billion) Forecast, by Application 2020 & 2033
- Table 28: Global Digital Claims Management Revenue billion Forecast, by Application 2020 & 2033
- Table 29: Global Digital Claims Management Revenue billion Forecast, by Type 2020 & 2033
- Table 30: Global Digital Claims Management Revenue billion Forecast, by Country 2020 & 2033
- Table 31: Turkey Digital Claims Management Revenue (billion) Forecast, by Application 2020 & 2033
- Table 32: Israel Digital Claims Management Revenue (billion) Forecast, by Application 2020 & 2033
- Table 33: GCC Digital Claims Management Revenue (billion) Forecast, by Application 2020 & 2033
- Table 34: North Africa Digital Claims Management Revenue (billion) Forecast, by Application 2020 & 2033
- Table 35: South Africa Digital Claims Management Revenue (billion) Forecast, by Application 2020 & 2033
- Table 36: Rest of Middle East & Africa Digital Claims Management Revenue (billion) Forecast, by Application 2020 & 2033
- Table 37: Global Digital Claims Management Revenue billion Forecast, by Application 2020 & 2033
- Table 38: Global Digital Claims Management Revenue billion Forecast, by Type 2020 & 2033
- Table 39: Global Digital Claims Management Revenue billion Forecast, by Country 2020 & 2033
- Table 40: China Digital Claims Management Revenue (billion) Forecast, by Application 2020 & 2033
- Table 41: India Digital Claims Management Revenue (billion) Forecast, by Application 2020 & 2033
- Table 42: Japan Digital Claims Management Revenue (billion) Forecast, by Application 2020 & 2033
- Table 43: South Korea Digital Claims Management Revenue (billion) Forecast, by Application 2020 & 2033
- Table 44: ASEAN Digital Claims Management Revenue (billion) Forecast, by Application 2020 & 2033
- Table 45: Oceania Digital Claims Management Revenue (billion) Forecast, by Application 2020 & 2033
- Table 46: Rest of Asia Pacific Digital Claims Management Revenue (billion) Forecast, by Application 2020 & 2033
Frequently Asked Questions
1. What is the projected Compound Annual Growth Rate (CAGR) of the Digital Claims Management?
The projected CAGR is approximately 7.55%.
2. Which companies are prominent players in the Digital Claims Management?
Key companies in the market include Arvato Financial Solutions, UiPath, Pulpstream, Nuxeo, DAT, ERGO Group AG.
3. What are the main segments of the Digital Claims Management?
The market segments include Application, Type.
4. Can you provide details about the market size?
The market size is estimated to be USD 16.8 billion as of 2022.
5. What are some drivers contributing to market growth?
N/A
6. What are the notable trends driving market growth?
N/A
7. Are there any restraints impacting market growth?
N/A
8. Can you provide examples of recent developments in the market?
N/A
9. What pricing options are available for accessing the report?
Pricing options include single-user, multi-user, and enterprise licenses priced at USD 2900.00, USD 4350.00, and USD 5800.00 respectively.
10. Is the market size provided in terms of value or volume?
The market size is provided in terms of value, measured in billion.
11. Are there any specific market keywords associated with the report?
Yes, the market keyword associated with the report is "Digital Claims Management," which aids in identifying and referencing the specific market segment covered.
12. How do I determine which pricing option suits my needs best?
The pricing options vary based on user requirements and access needs. Individual users may opt for single-user licenses, while businesses requiring broader access may choose multi-user or enterprise licenses for cost-effective access to the report.
13. Are there any additional resources or data provided in the Digital Claims Management report?
While the report offers comprehensive insights, it's advisable to review the specific contents or supplementary materials provided to ascertain if additional resources or data are available.
14. How can I stay updated on further developments or reports in the Digital Claims Management?
To stay informed about further developments, trends, and reports in the Digital Claims Management, consider subscribing to industry newsletters, following relevant companies and organizations, or regularly checking reputable industry news sources and publications.
Methodology
Step 1 - Identification of Relevant Samples Size from Population Database


Step 2 - Approaches for Defining Global Market Size (Value, Volume* & Price*)

Note*: In applicable scenarios
Step 3 - Data Sources
Primary Research
- Web Analytics
- Survey Reports
- Research Institute
- Latest Research Reports
- Opinion Leaders
Secondary Research
- Annual Reports
- White Paper
- Latest Press Release
- Industry Association
- Paid Database
- Investor Presentations

Step 4 - Data Triangulation
Involves using different sources of information in order to increase the validity of a study
These sources are likely to be stakeholders in a program - participants, other researchers, program staff, other community members, and so on.
Then we put all data in single framework & apply various statistical tools to find out the dynamic on the market.
During the analysis stage, feedback from the stakeholder groups would be compared to determine areas of agreement as well as areas of divergence