

Key Insights
The global commercial scales market is experiencing robust growth, driven by the expanding retail and food service sectors. Automation in logistics and supply chain management, coupled with increasing demand for accurate weight measurement in various industries, fuels this expansion. The market is segmented by application (retail, restaurant, other) and type (mechanical, digital), with digital scales dominating due to their precision, efficiency, and advanced features like data logging and connectivity. Technological advancements, such as the integration of smart sensors and IoT capabilities, are transforming the market, enabling real-time data analysis and inventory management. The rising adoption of these sophisticated scales, particularly in larger retail chains and automated warehouses, is a significant growth driver. Furthermore, stringent regulations concerning accurate weighing practices in various countries are also contributing to the market’s expansion. Competition is intense, with established players like Bizerba, Mettler Toledo, and Ohaus vying for market share alongside smaller, specialized manufacturers. Geographic expansion, especially in developing economies with burgeoning retail and food processing industries, presents significant opportunities for growth. However, the market faces some challenges, including the relatively high initial investment cost of advanced digital scales, and the potential for technological obsolescence as newer, more efficient models are introduced.
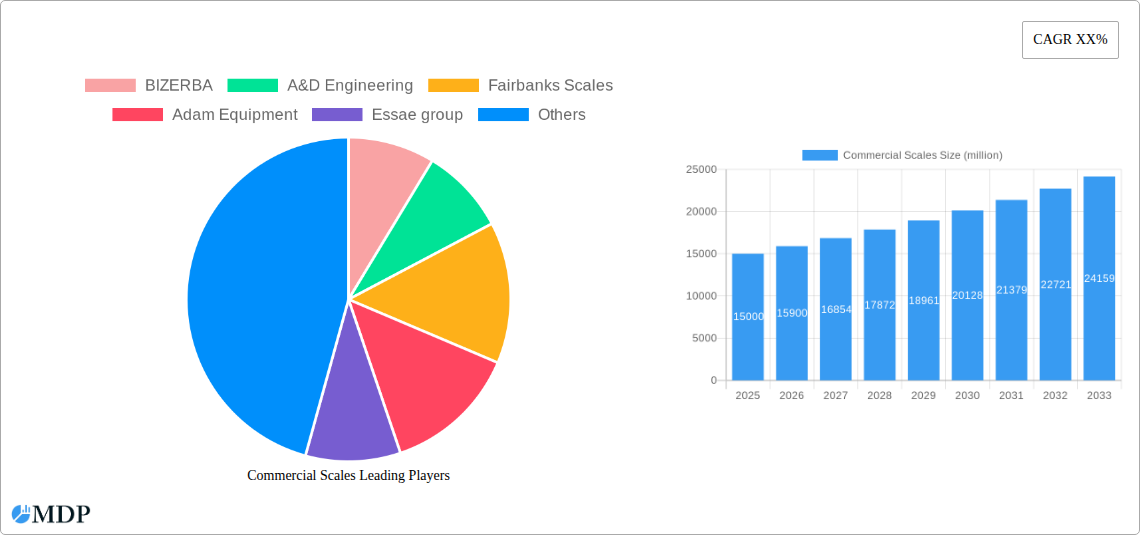
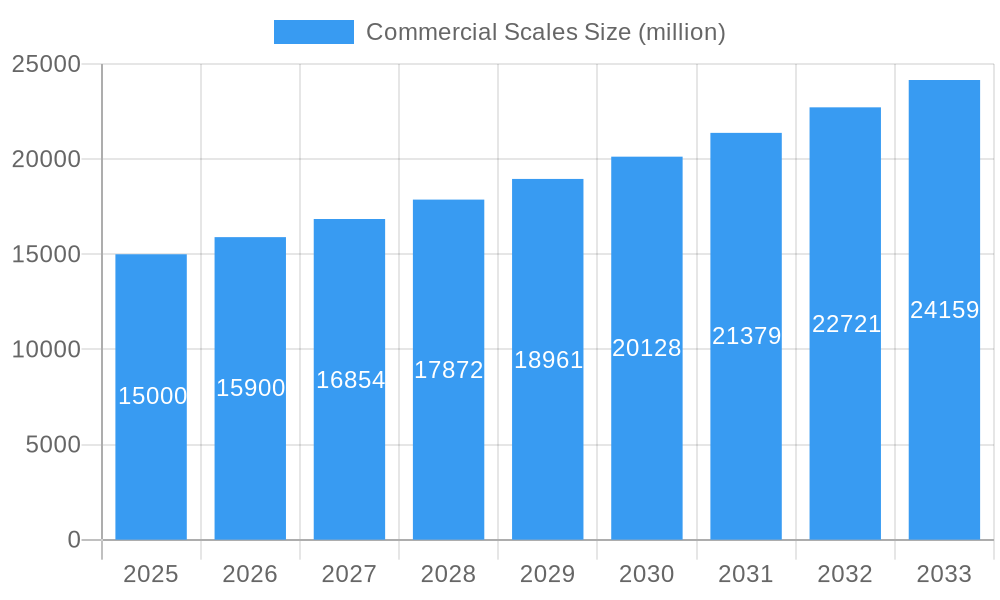
Commercial Scales Market Size (In Billion)
Despite these challenges, the long-term outlook for the commercial scales market remains positive. The sustained growth in e-commerce and the continued demand for precise weight measurements across diverse industries ensure consistent market demand. The market's evolution towards increased automation and digitalization will further drive growth, creating opportunities for innovative solutions and technological advancements. The market's regional distribution reflects global economic trends, with North America and Europe currently holding significant market share, while Asia-Pacific is projected to experience the fastest growth due to rapid industrialization and economic expansion. The focus on improving supply chain efficiency and enhancing customer experience will continue to be key factors influencing market dynamics.
Commercial Scales Company Market Share
Commercial Scales Market Report: A Comprehensive Analysis (2019-2033)
This in-depth report provides a comprehensive analysis of the global commercial scales market, projecting a market value exceeding $XX million by 2033. The report covers the period 2019-2033, with a focus on the estimated year 2025 and a forecast period of 2025-2033. Key players like BIZERBA, A&D Engineering, and Mettler Toledo are analyzed, along with market trends and growth opportunities across retail, restaurant, and other segments. This detailed analysis is crucial for stakeholders seeking to understand market dynamics, identify growth opportunities, and make informed strategic decisions.
Commercial Scales Market Dynamics & Concentration
The global commercial scales market exhibits a moderately concentrated landscape, with the top ten players holding an estimated XX% market share in 2025. Market concentration is influenced by several factors, including:
Innovation Drivers: Continuous advancements in weighing technology, such as increased accuracy, improved connectivity (IoT integration), and enhanced data analytics capabilities, are driving market growth and shaping competitive dynamics. Companies are investing heavily in R&D to develop advanced features like automatic calibration and cloud-based data management.
Regulatory Frameworks: Stringent regulations regarding weight and measure accuracy in various industries, especially food and pharmaceuticals, are a key driver, forcing companies to adopt advanced, compliant scales. Variations in regulations across different geographies create opportunities and challenges for market players.
Product Substitutes: While digital scales are largely replacing mechanical scales, the presence of less sophisticated alternatives, such as simple balance scales, particularly in certain niche markets, poses a minor competitive challenge.
End-User Trends: Growing demand for automation, efficiency, and traceability in retail, food processing, and logistics sectors is driving adoption of advanced commercial scales. Consumers are also increasingly demanding accurate and reliable weighing solutions.
M&A Activities: Consolidation within the industry is a notable trend, with an estimated XX M&A deals recorded between 2019 and 2024, suggesting an increasing focus on market share expansion and technological integration among major players. These mergers have resulted in a more consolidated market landscape, favoring larger players.
Commercial Scales Industry Trends & Analysis
The global commercial scales market is projected to experience a Compound Annual Growth Rate (CAGR) of XX% during the forecast period (2025-2033). This growth is fueled by several key factors:
The increasing adoption of digital scales, driven by their superior accuracy, ease of use, and data management capabilities, is a significant driver. Technological advancements, such as the incorporation of IoT capabilities and cloud connectivity, are further enhancing the appeal of digital scales, particularly in large retail establishments and industrial settings. This trend is accompanied by a decline in the market penetration of mechanical scales, with their market share expected to decrease to XX% by 2033. The preference for digital scales is particularly pronounced in developed economies due to higher technological adoption rates and strong demand for efficient weighing solutions.
Competitive dynamics are intense, with leading players focusing on innovation, strategic partnerships, and global expansion strategies. Market growth is further influenced by economic growth in developing economies, increasing urbanization, and the expansion of retail and food service industries. Consumer preferences are shifting toward digitally enabled solutions, necessitating robust software and data analytics components integrated with weighing systems.
Leading Markets & Segments in Commercial Scales
The retail segment is projected to dominate the commercial scales market throughout the forecast period, with an estimated XX% market share in 2025. This dominance is driven by:
Retail: High volume transactions and need for accurate weight measurement in supermarkets, grocery stores, and retail outlets. Strong demand for point-of-sale (POS) integration and data analytics capabilities.
Restaurant: Growing restaurant chains and demand for efficient kitchen management systems drive adoption, particularly among fast-food chains and restaurants utilizing self-service kiosks.
Other: This segment includes various sectors like industrial, healthcare, and logistics. Growth within this segment is propelled by the need for precise weighing in manufacturing, warehousing, and other specialized applications.
Digital Scales: The global dominance of digital scales over mechanical scales is undeniable, driven by the significant advantages in accuracy, data analysis capabilities, and ease of integration with other systems.
Key drivers for regional dominance vary, but robust infrastructure and government support for technological upgrades in regions like North America and Europe contribute significantly to higher adoption rates. Developing economies present a growing market opportunity, but challenges remain in terms of affordability and infrastructure development.
Commercial Scales Product Developments
Recent product developments focus on improving accuracy, connectivity, and data analytics capabilities. Integration with cloud-based platforms and software solutions enables seamless data management, inventory control, and reporting. Advanced features like automatic calibration, self-diagnostics, and user-friendly interfaces are enhancing the overall usability and efficiency of commercial scales. This trend towards smart and connected scales is transforming the industry, providing significant competitive advantages to manufacturers.
Key Drivers of Commercial Scales Growth
Several factors contribute to the growth of the commercial scales market. Technological advancements, like the development of highly accurate and reliable sensors and improved data processing capabilities, are key drivers. Economic growth in emerging markets, coupled with increased infrastructure investment and rising consumer spending, further boosts demand. Stringent regulatory requirements for accurate weight measurement, especially in the food and pharmaceutical industries, also play a critical role. Finally, the growing preference for automation in various sectors is driving adoption of sophisticated commercial scales with advanced functionalities.
Challenges in the Commercial Scales Market
The market faces challenges such as increased competition from new entrants, supply chain disruptions impacting component availability and costs, and complex regulatory frameworks across different regions. These factors can significantly impact profitability and time-to-market for new products. Furthermore, maintaining high accuracy standards and ensuring compliance with evolving regulatory requirements present ongoing challenges for manufacturers. The impact of these challenges is estimated to reduce overall market growth by approximately XX% annually.
Emerging Opportunities in Commercial Scales
Long-term growth opportunities exist in developing markets, where infrastructure development is creating demand for reliable weighing solutions. The integration of commercial scales with other technologies, such as RFID and blockchain, presents significant growth potential. Strategic partnerships with software providers and data analytics companies are also driving innovation and creating new revenue streams. Moreover, the rising demand for sustainable and environmentally friendly products is opening up new opportunities for manufacturers offering energy-efficient and recyclable commercial scales.
Leading Players in the Commercial Scales Sector
- BIZERBA
- A&D Engineering
- Fairbanks Scales
- Adam Equipment
- Essae group
- KERN & SOHN GmbH
- Mettler Toledo
- Contech Instruments Ltd.
- Avery Weigh-Tronix LLC
- Rice Lake Weighing Systems
- Cardinal Scale Manufacturing Company
- Doran Scales, Inc.
- Italiana Macchi
- KERN & SOHN
- Ohaus
- TorRey
- Universal Scales
Key Milestones in Commercial Scales Industry
- 2020: Increased adoption of digital scales driven by the pandemic's impact on e-commerce.
- 2021: Several key players launched scales with enhanced IoT capabilities.
- 2022: Significant investments in R&D focusing on improved accuracy and data analytics.
- 2023: Several mergers and acquisitions aimed at market consolidation.
- 2024: Introduction of new regulatory standards for commercial scales in several regions.
Strategic Outlook for Commercial Scales Market
The commercial scales market is poised for continued growth, driven by ongoing technological advancements, expanding applications in diverse industries, and strong demand from emerging markets. Strategic opportunities exist for companies focusing on innovation, strategic partnerships, and efficient supply chain management. The focus on digital transformation, data analytics, and sustainability will further shape the industry landscape. The market's future success hinges on adapting to evolving consumer preferences and regulatory landscapes, and continually enhancing product functionalities to meet diverse customer needs.
Commercial Scales Segmentation
-
1. Application
- 1.1. Retail
- 1.2. Restaurant
- 1.3. Other
-
2. Types
- 2.1. Mechanical Scales
- 2.2. Digital Scales
Commercial Scales Segmentation By Geography
-
1. North America
- 1.1. United States
- 1.2. Canada
- 1.3. Mexico
-
2. South America
- 2.1. Brazil
- 2.2. Argentina
- 2.3. Rest of South America
-
3. Europe
- 3.1. United Kingdom
- 3.2. Germany
- 3.3. France
- 3.4. Italy
- 3.5. Spain
- 3.6. Russia
- 3.7. Benelux
- 3.8. Nordics
- 3.9. Rest of Europe
-
4. Middle East & Africa
- 4.1. Turkey
- 4.2. Israel
- 4.3. GCC
- 4.4. North Africa
- 4.5. South Africa
- 4.6. Rest of Middle East & Africa
-
5. Asia Pacific
- 5.1. China
- 5.2. India
- 5.3. Japan
- 5.4. South Korea
- 5.5. ASEAN
- 5.6. Oceania
- 5.7. Rest of Asia Pacific
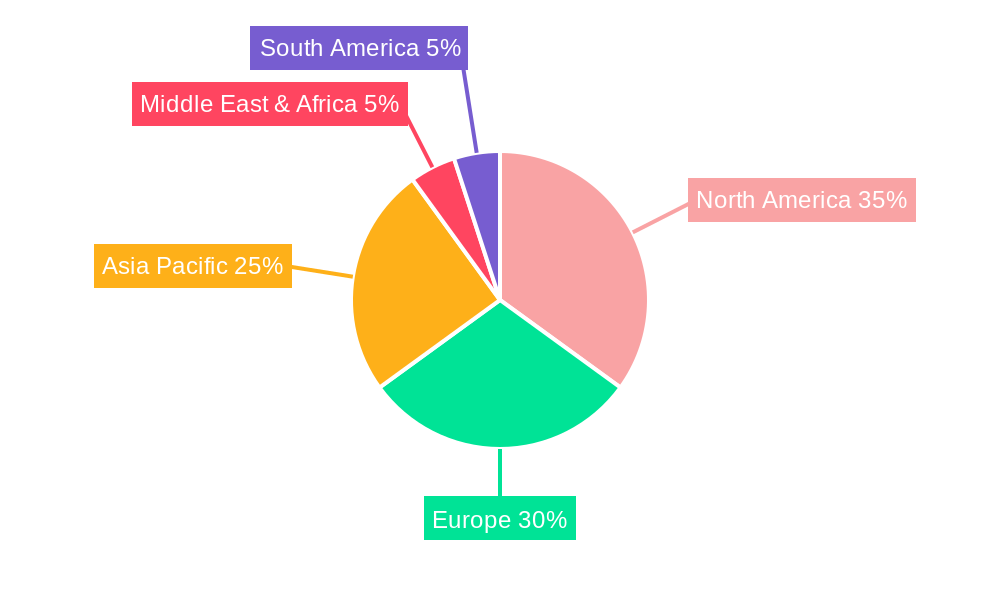
Commercial Scales Regional Market Share
Geographic Coverage of Commercial Scales
Commercial Scales REPORT HIGHLIGHTS
| Aspects | Details |
|---|---|
| Study Period | 2020-2034 |
| Base Year | 2025 |
| Estimated Year | 2026 |
| Forecast Period | 2026-2034 |
| Historical Period | 2020-2025 |
| Growth Rate | CAGR of XX% from 2020-2034 |
| Segmentation |
|
Table of Contents
- 1. Introduction
- 1.1. Research Scope
- 1.2. Market Segmentation
- 1.3. Research Methodology
- 1.4. Definitions and Assumptions
- 2. Executive Summary
- 2.1. Introduction
- 3. Market Dynamics
- 3.1. Introduction
- 3.2. Market Drivers
- 3.3. Market Restrains
- 3.4. Market Trends
- 4. Market Factor Analysis
- 4.1. Porters Five Forces
- 4.2. Supply/Value Chain
- 4.3. PESTEL analysis
- 4.4. Market Entropy
- 4.5. Patent/Trademark Analysis
- 5. Global Commercial Scales Analysis, Insights and Forecast, 2020-2032
- 5.1. Market Analysis, Insights and Forecast - by Application
- 5.1.1. Retail
- 5.1.2. Restaurant
- 5.1.3. Other
- 5.2. Market Analysis, Insights and Forecast - by Types
- 5.2.1. Mechanical Scales
- 5.2.2. Digital Scales
- 5.3. Market Analysis, Insights and Forecast - by Region
- 5.3.1. North America
- 5.3.2. South America
- 5.3.3. Europe
- 5.3.4. Middle East & Africa
- 5.3.5. Asia Pacific
- 5.1. Market Analysis, Insights and Forecast - by Application
- 6. North America Commercial Scales Analysis, Insights and Forecast, 2020-2032
- 6.1. Market Analysis, Insights and Forecast - by Application
- 6.1.1. Retail
- 6.1.2. Restaurant
- 6.1.3. Other
- 6.2. Market Analysis, Insights and Forecast - by Types
- 6.2.1. Mechanical Scales
- 6.2.2. Digital Scales
- 6.1. Market Analysis, Insights and Forecast - by Application
- 7. South America Commercial Scales Analysis, Insights and Forecast, 2020-2032
- 7.1. Market Analysis, Insights and Forecast - by Application
- 7.1.1. Retail
- 7.1.2. Restaurant
- 7.1.3. Other
- 7.2. Market Analysis, Insights and Forecast - by Types
- 7.2.1. Mechanical Scales
- 7.2.2. Digital Scales
- 7.1. Market Analysis, Insights and Forecast - by Application
- 8. Europe Commercial Scales Analysis, Insights and Forecast, 2020-2032
- 8.1. Market Analysis, Insights and Forecast - by Application
- 8.1.1. Retail
- 8.1.2. Restaurant
- 8.1.3. Other
- 8.2. Market Analysis, Insights and Forecast - by Types
- 8.2.1. Mechanical Scales
- 8.2.2. Digital Scales
- 8.1. Market Analysis, Insights and Forecast - by Application
- 9. Middle East & Africa Commercial Scales Analysis, Insights and Forecast, 2020-2032
- 9.1. Market Analysis, Insights and Forecast - by Application
- 9.1.1. Retail
- 9.1.2. Restaurant
- 9.1.3. Other
- 9.2. Market Analysis, Insights and Forecast - by Types
- 9.2.1. Mechanical Scales
- 9.2.2. Digital Scales
- 9.1. Market Analysis, Insights and Forecast - by Application
- 10. Asia Pacific Commercial Scales Analysis, Insights and Forecast, 2020-2032
- 10.1. Market Analysis, Insights and Forecast - by Application
- 10.1.1. Retail
- 10.1.2. Restaurant
- 10.1.3. Other
- 10.2. Market Analysis, Insights and Forecast - by Types
- 10.2.1. Mechanical Scales
- 10.2.2. Digital Scales
- 10.1. Market Analysis, Insights and Forecast - by Application
- 11. Competitive Analysis
- 11.1. Global Market Share Analysis 2025
- 11.2. Company Profiles
- 11.2.1 BIZERBA
- 11.2.1.1. Overview
- 11.2.1.2. Products
- 11.2.1.3. SWOT Analysis
- 11.2.1.4. Recent Developments
- 11.2.1.5. Financials (Based on Availability)
- 11.2.2 A&D Engineering
- 11.2.2.1. Overview
- 11.2.2.2. Products
- 11.2.2.3. SWOT Analysis
- 11.2.2.4. Recent Developments
- 11.2.2.5. Financials (Based on Availability)
- 11.2.3 Fairbanks Scales
- 11.2.3.1. Overview
- 11.2.3.2. Products
- 11.2.3.3. SWOT Analysis
- 11.2.3.4. Recent Developments
- 11.2.3.5. Financials (Based on Availability)
- 11.2.4 Adam Equipment
- 11.2.4.1. Overview
- 11.2.4.2. Products
- 11.2.4.3. SWOT Analysis
- 11.2.4.4. Recent Developments
- 11.2.4.5. Financials (Based on Availability)
- 11.2.5 Essae group
- 11.2.5.1. Overview
- 11.2.5.2. Products
- 11.2.5.3. SWOT Analysis
- 11.2.5.4. Recent Developments
- 11.2.5.5. Financials (Based on Availability)
- 11.2.6 KERN & SOHN GmbH
- 11.2.6.1. Overview
- 11.2.6.2. Products
- 11.2.6.3. SWOT Analysis
- 11.2.6.4. Recent Developments
- 11.2.6.5. Financials (Based on Availability)
- 11.2.7 Mettler Toredo
- 11.2.7.1. Overview
- 11.2.7.2. Products
- 11.2.7.3. SWOT Analysis
- 11.2.7.4. Recent Developments
- 11.2.7.5. Financials (Based on Availability)
- 11.2.8 Contech Instruments Ltd.
- 11.2.8.1. Overview
- 11.2.8.2. Products
- 11.2.8.3. SWOT Analysis
- 11.2.8.4. Recent Developments
- 11.2.8.5. Financials (Based on Availability)
- 11.2.9 Avery Weigh Tronix LLC
- 11.2.9.1. Overview
- 11.2.9.2. Products
- 11.2.9.3. SWOT Analysis
- 11.2.9.4. Recent Developments
- 11.2.9.5. Financials (Based on Availability)
- 11.2.10 Rice Lake Weighing Systems
- 11.2.10.1. Overview
- 11.2.10.2. Products
- 11.2.10.3. SWOT Analysis
- 11.2.10.4. Recent Developments
- 11.2.10.5. Financials (Based on Availability)
- 11.2.11 Cardinal Scale Manufacturing Company
- 11.2.11.1. Overview
- 11.2.11.2. Products
- 11.2.11.3. SWOT Analysis
- 11.2.11.4. Recent Developments
- 11.2.11.5. Financials (Based on Availability)
- 11.2.12 Doran Scales
- 11.2.12.1. Overview
- 11.2.12.2. Products
- 11.2.12.3. SWOT Analysis
- 11.2.12.4. Recent Developments
- 11.2.12.5. Financials (Based on Availability)
- 11.2.13 Inc.
- 11.2.13.1. Overview
- 11.2.13.2. Products
- 11.2.13.3. SWOT Analysis
- 11.2.13.4. Recent Developments
- 11.2.13.5. Financials (Based on Availability)
- 11.2.14 Italiana Macchi
- 11.2.14.1. Overview
- 11.2.14.2. Products
- 11.2.14.3. SWOT Analysis
- 11.2.14.4. Recent Developments
- 11.2.14.5. Financials (Based on Availability)
- 11.2.15 KERN & SOHN
- 11.2.15.1. Overview
- 11.2.15.2. Products
- 11.2.15.3. SWOT Analysis
- 11.2.15.4. Recent Developments
- 11.2.15.5. Financials (Based on Availability)
- 11.2.16 Ohaus
- 11.2.16.1. Overview
- 11.2.16.2. Products
- 11.2.16.3. SWOT Analysis
- 11.2.16.4. Recent Developments
- 11.2.16.5. Financials (Based on Availability)
- 11.2.17 TorRey
- 11.2.17.1. Overview
- 11.2.17.2. Products
- 11.2.17.3. SWOT Analysis
- 11.2.17.4. Recent Developments
- 11.2.17.5. Financials (Based on Availability)
- 11.2.18 Universal Scales
- 11.2.18.1. Overview
- 11.2.18.2. Products
- 11.2.18.3. SWOT Analysis
- 11.2.18.4. Recent Developments
- 11.2.18.5. Financials (Based on Availability)
- 11.2.1 BIZERBA
List of Figures
- Figure 1: Global Commercial Scales Revenue Breakdown (million, %) by Region 2025 & 2033
- Figure 2: North America Commercial Scales Revenue (million), by Application 2025 & 2033
- Figure 3: North America Commercial Scales Revenue Share (%), by Application 2025 & 2033
- Figure 4: North America Commercial Scales Revenue (million), by Types 2025 & 2033
- Figure 5: North America Commercial Scales Revenue Share (%), by Types 2025 & 2033
- Figure 6: North America Commercial Scales Revenue (million), by Country 2025 & 2033
- Figure 7: North America Commercial Scales Revenue Share (%), by Country 2025 & 2033
- Figure 8: South America Commercial Scales Revenue (million), by Application 2025 & 2033
- Figure 9: South America Commercial Scales Revenue Share (%), by Application 2025 & 2033
- Figure 10: South America Commercial Scales Revenue (million), by Types 2025 & 2033
- Figure 11: South America Commercial Scales Revenue Share (%), by Types 2025 & 2033
- Figure 12: South America Commercial Scales Revenue (million), by Country 2025 & 2033
- Figure 13: South America Commercial Scales Revenue Share (%), by Country 2025 & 2033
- Figure 14: Europe Commercial Scales Revenue (million), by Application 2025 & 2033
- Figure 15: Europe Commercial Scales Revenue Share (%), by Application 2025 & 2033
- Figure 16: Europe Commercial Scales Revenue (million), by Types 2025 & 2033
- Figure 17: Europe Commercial Scales Revenue Share (%), by Types 2025 & 2033
- Figure 18: Europe Commercial Scales Revenue (million), by Country 2025 & 2033
- Figure 19: Europe Commercial Scales Revenue Share (%), by Country 2025 & 2033
- Figure 20: Middle East & Africa Commercial Scales Revenue (million), by Application 2025 & 2033
- Figure 21: Middle East & Africa Commercial Scales Revenue Share (%), by Application 2025 & 2033
- Figure 22: Middle East & Africa Commercial Scales Revenue (million), by Types 2025 & 2033
- Figure 23: Middle East & Africa Commercial Scales Revenue Share (%), by Types 2025 & 2033
- Figure 24: Middle East & Africa Commercial Scales Revenue (million), by Country 2025 & 2033
- Figure 25: Middle East & Africa Commercial Scales Revenue Share (%), by Country 2025 & 2033
- Figure 26: Asia Pacific Commercial Scales Revenue (million), by Application 2025 & 2033
- Figure 27: Asia Pacific Commercial Scales Revenue Share (%), by Application 2025 & 2033
- Figure 28: Asia Pacific Commercial Scales Revenue (million), by Types 2025 & 2033
- Figure 29: Asia Pacific Commercial Scales Revenue Share (%), by Types 2025 & 2033
- Figure 30: Asia Pacific Commercial Scales Revenue (million), by Country 2025 & 2033
- Figure 31: Asia Pacific Commercial Scales Revenue Share (%), by Country 2025 & 2033
List of Tables
- Table 1: Global Commercial Scales Revenue million Forecast, by Application 2020 & 2033
- Table 2: Global Commercial Scales Revenue million Forecast, by Types 2020 & 2033
- Table 3: Global Commercial Scales Revenue million Forecast, by Region 2020 & 2033
- Table 4: Global Commercial Scales Revenue million Forecast, by Application 2020 & 2033
- Table 5: Global Commercial Scales Revenue million Forecast, by Types 2020 & 2033
- Table 6: Global Commercial Scales Revenue million Forecast, by Country 2020 & 2033
- Table 7: United States Commercial Scales Revenue (million) Forecast, by Application 2020 & 2033
- Table 8: Canada Commercial Scales Revenue (million) Forecast, by Application 2020 & 2033
- Table 9: Mexico Commercial Scales Revenue (million) Forecast, by Application 2020 & 2033
- Table 10: Global Commercial Scales Revenue million Forecast, by Application 2020 & 2033
- Table 11: Global Commercial Scales Revenue million Forecast, by Types 2020 & 2033
- Table 12: Global Commercial Scales Revenue million Forecast, by Country 2020 & 2033
- Table 13: Brazil Commercial Scales Revenue (million) Forecast, by Application 2020 & 2033
- Table 14: Argentina Commercial Scales Revenue (million) Forecast, by Application 2020 & 2033
- Table 15: Rest of South America Commercial Scales Revenue (million) Forecast, by Application 2020 & 2033
- Table 16: Global Commercial Scales Revenue million Forecast, by Application 2020 & 2033
- Table 17: Global Commercial Scales Revenue million Forecast, by Types 2020 & 2033
- Table 18: Global Commercial Scales Revenue million Forecast, by Country 2020 & 2033
- Table 19: United Kingdom Commercial Scales Revenue (million) Forecast, by Application 2020 & 2033
- Table 20: Germany Commercial Scales Revenue (million) Forecast, by Application 2020 & 2033
- Table 21: France Commercial Scales Revenue (million) Forecast, by Application 2020 & 2033
- Table 22: Italy Commercial Scales Revenue (million) Forecast, by Application 2020 & 2033
- Table 23: Spain Commercial Scales Revenue (million) Forecast, by Application 2020 & 2033
- Table 24: Russia Commercial Scales Revenue (million) Forecast, by Application 2020 & 2033
- Table 25: Benelux Commercial Scales Revenue (million) Forecast, by Application 2020 & 2033
- Table 26: Nordics Commercial Scales Revenue (million) Forecast, by Application 2020 & 2033
- Table 27: Rest of Europe Commercial Scales Revenue (million) Forecast, by Application 2020 & 2033
- Table 28: Global Commercial Scales Revenue million Forecast, by Application 2020 & 2033
- Table 29: Global Commercial Scales Revenue million Forecast, by Types 2020 & 2033
- Table 30: Global Commercial Scales Revenue million Forecast, by Country 2020 & 2033
- Table 31: Turkey Commercial Scales Revenue (million) Forecast, by Application 2020 & 2033
- Table 32: Israel Commercial Scales Revenue (million) Forecast, by Application 2020 & 2033
- Table 33: GCC Commercial Scales Revenue (million) Forecast, by Application 2020 & 2033
- Table 34: North Africa Commercial Scales Revenue (million) Forecast, by Application 2020 & 2033
- Table 35: South Africa Commercial Scales Revenue (million) Forecast, by Application 2020 & 2033
- Table 36: Rest of Middle East & Africa Commercial Scales Revenue (million) Forecast, by Application 2020 & 2033
- Table 37: Global Commercial Scales Revenue million Forecast, by Application 2020 & 2033
- Table 38: Global Commercial Scales Revenue million Forecast, by Types 2020 & 2033
- Table 39: Global Commercial Scales Revenue million Forecast, by Country 2020 & 2033
- Table 40: China Commercial Scales Revenue (million) Forecast, by Application 2020 & 2033
- Table 41: India Commercial Scales Revenue (million) Forecast, by Application 2020 & 2033
- Table 42: Japan Commercial Scales Revenue (million) Forecast, by Application 2020 & 2033
- Table 43: South Korea Commercial Scales Revenue (million) Forecast, by Application 2020 & 2033
- Table 44: ASEAN Commercial Scales Revenue (million) Forecast, by Application 2020 & 2033
- Table 45: Oceania Commercial Scales Revenue (million) Forecast, by Application 2020 & 2033
- Table 46: Rest of Asia Pacific Commercial Scales Revenue (million) Forecast, by Application 2020 & 2033
Frequently Asked Questions
1. What is the projected Compound Annual Growth Rate (CAGR) of the Commercial Scales?
The projected CAGR is approximately XX%.
2. Which companies are prominent players in the Commercial Scales?
Key companies in the market include BIZERBA, A&D Engineering, Fairbanks Scales, Adam Equipment, Essae group, KERN & SOHN GmbH, Mettler Toredo, Contech Instruments Ltd., Avery Weigh Tronix LLC, Rice Lake Weighing Systems, Cardinal Scale Manufacturing Company, Doran Scales, Inc., Italiana Macchi, KERN & SOHN, Ohaus, TorRey, Universal Scales.
3. What are the main segments of the Commercial Scales?
The market segments include Application, Types.
4. Can you provide details about the market size?
The market size is estimated to be USD XXX million as of 2022.
5. What are some drivers contributing to market growth?
N/A
6. What are the notable trends driving market growth?
N/A
7. Are there any restraints impacting market growth?
N/A
8. Can you provide examples of recent developments in the market?
N/A
9. What pricing options are available for accessing the report?
Pricing options include single-user, multi-user, and enterprise licenses priced at USD 4900.00, USD 7350.00, and USD 9800.00 respectively.
10. Is the market size provided in terms of value or volume?
The market size is provided in terms of value, measured in million.
11. Are there any specific market keywords associated with the report?
Yes, the market keyword associated with the report is "Commercial Scales," which aids in identifying and referencing the specific market segment covered.
12. How do I determine which pricing option suits my needs best?
The pricing options vary based on user requirements and access needs. Individual users may opt for single-user licenses, while businesses requiring broader access may choose multi-user or enterprise licenses for cost-effective access to the report.
13. Are there any additional resources or data provided in the Commercial Scales report?
While the report offers comprehensive insights, it's advisable to review the specific contents or supplementary materials provided to ascertain if additional resources or data are available.
14. How can I stay updated on further developments or reports in the Commercial Scales?
To stay informed about further developments, trends, and reports in the Commercial Scales, consider subscribing to industry newsletters, following relevant companies and organizations, or regularly checking reputable industry news sources and publications.
Methodology
Step 1 - Identification of Relevant Samples Size from Population Database


Step 2 - Approaches for Defining Global Market Size (Value, Volume* & Price*)

Note*: In applicable scenarios
Step 3 - Data Sources
Primary Research
- Web Analytics
- Survey Reports
- Research Institute
- Latest Research Reports
- Opinion Leaders
Secondary Research
- Annual Reports
- White Paper
- Latest Press Release
- Industry Association
- Paid Database
- Investor Presentations

Step 4 - Data Triangulation
Involves using different sources of information in order to increase the validity of a study
These sources are likely to be stakeholders in a program - participants, other researchers, program staff, other community members, and so on.
Then we put all data in single framework & apply various statistical tools to find out the dynamic on the market.
During the analysis stage, feedback from the stakeholder groups would be compared to determine areas of agreement as well as areas of divergence