

Key Insights
The global Commercial Exercise Bike market is poised for steady expansion, projected to reach $0.7 billion in 2025. This growth is fueled by an increasing health consciousness among individuals and a rising trend of adopting fitness facilities by businesses and clubs to promote employee well-being and attract members. The market is expected to witness a Compound Annual Growth Rate (CAGR) of 3.9% from 2025 to 2033, indicating a robust and sustained upward trajectory. The burgeoning demand for advanced and feature-rich exercise bikes, including those with interactive features and personalized training programs, is a significant driver. Furthermore, the expansion of the fitness industry in emerging economies, coupled with increased disposable incomes, is contributing to market growth. Commercial entities are investing in high-quality fitness equipment to differentiate themselves and cater to a discerning clientele, thereby bolstering the demand for commercial exercise bikes.
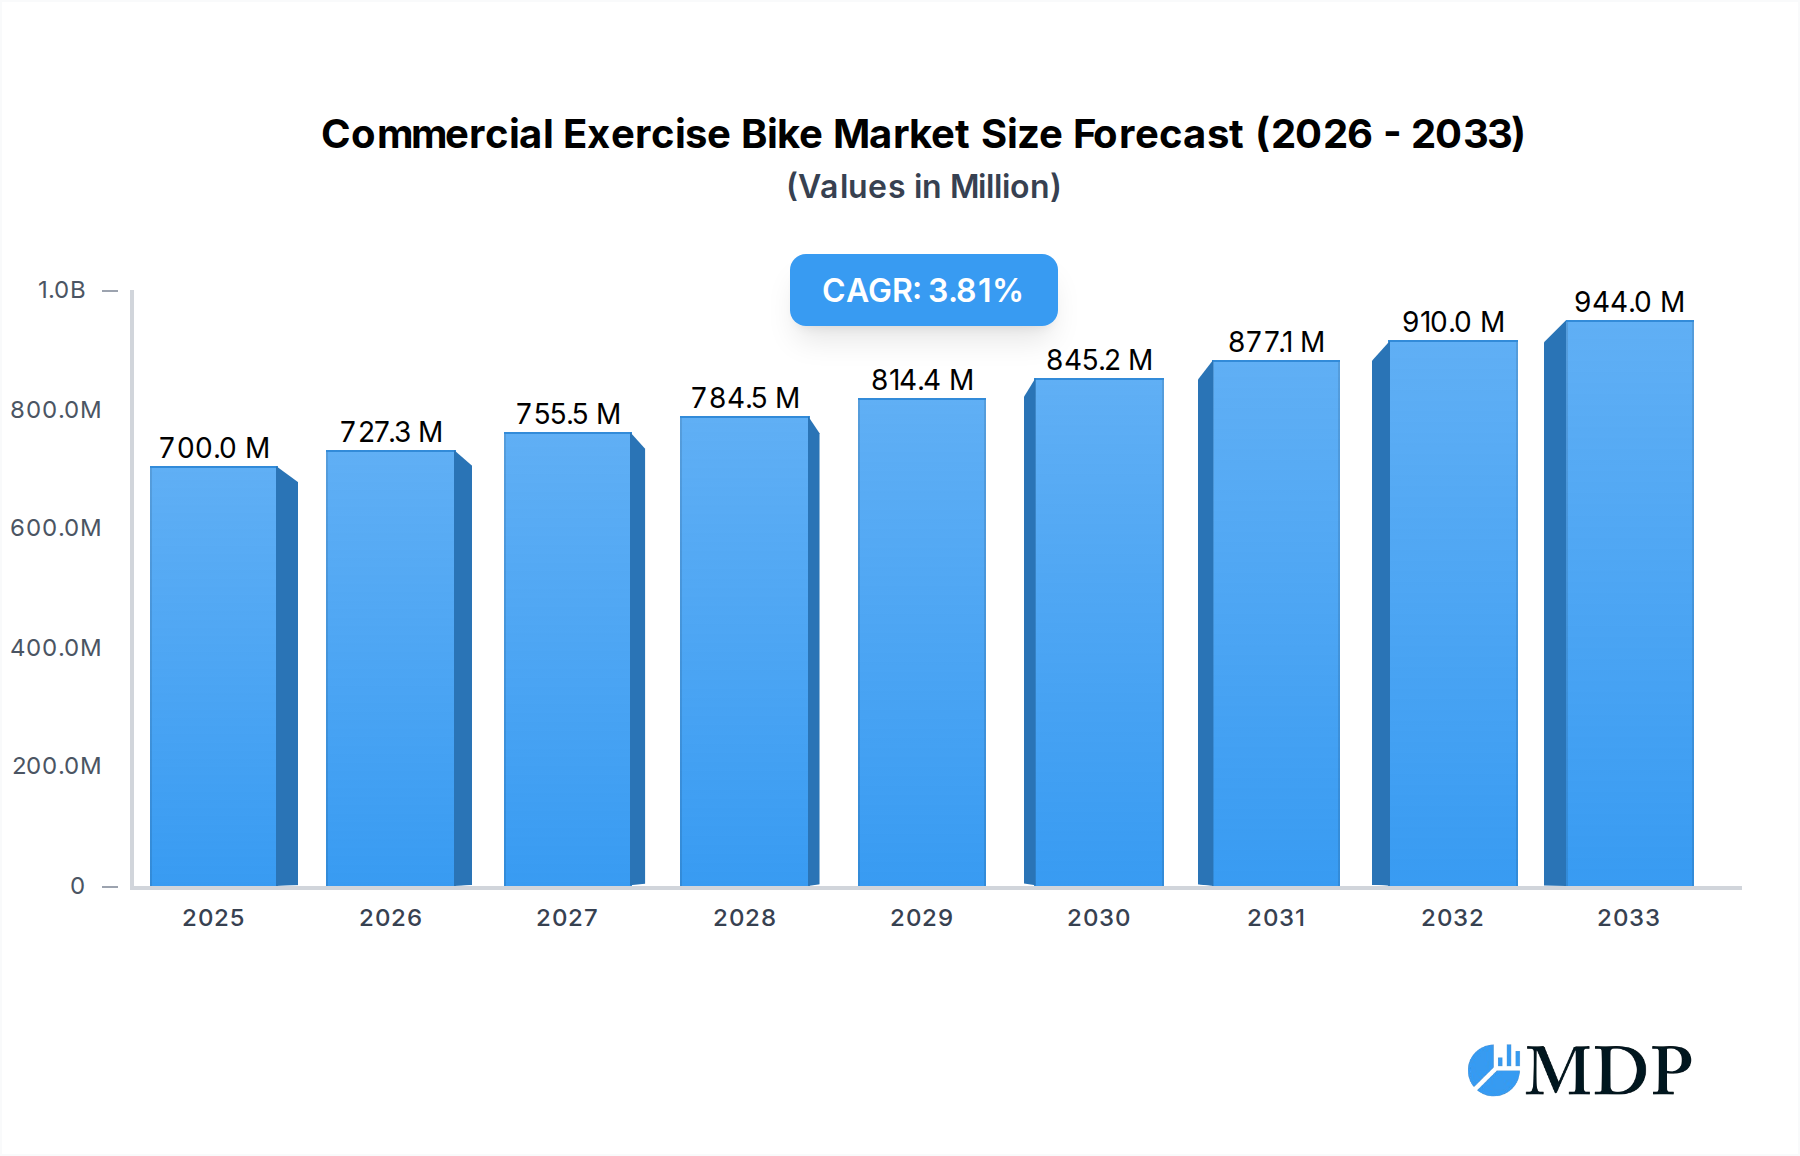
Commercial Exercise Bike Market Size (In Million)
The market landscape is characterized by evolving trends such as the integration of smart technology for data tracking and virtual reality experiences, enhancing user engagement and workout effectiveness. While the market demonstrates strong growth potential, certain factors may influence its trajectory. Intensifying competition among key players and the potential for market saturation in developed regions could present challenges. However, the continuous innovation in product design, incorporating ergonomic features and diverse training modes, alongside strategic collaborations and expanding distribution networks, are expected to mitigate these restraints. The market is segmented into various applications, including gyms and business clubs, and by types such as upright and back-to-back exercise bikes, catering to a wide spectrum of commercial fitness needs. This dynamic market environment offers significant opportunities for both established and emerging companies.

Commercial Exercise Bike Company Market Share
Unlocking the Future of Fitness: A Comprehensive Report on the Global Commercial Exercise Bike Market (2019-2033)
This in-depth report provides an unparalleled analysis of the global commercial exercise bike market, offering critical insights for industry stakeholders, investors, and manufacturers. Delving into market dynamics, trends, leading players, and future projections, this study covers the period from 2019 to 2033, with a base and estimated year of 2025 and a forecast period from 2025 to 2033. With an estimated market size expected to reach billions, this report is an indispensable resource for navigating this rapidly evolving sector.
Commercial Exercise Bike Market Dynamics & Concentration
The global commercial exercise bike market is characterized by a moderate concentration, with several key players dominating market share, which is estimated to be worth over 5 billion. Innovation is a primary driver, fueled by advancements in connected fitness technology, interactive training programs, and ergonomic design. Regulatory frameworks, while generally supportive of health and wellness, can impact product standards and certifications, requiring manufacturers to adhere to evolving safety and quality guidelines. Product substitutes, including other cardio equipment like treadmills and ellipticals, and the burgeoning home-fitness segment, present ongoing competitive pressures. End-user trends reveal a growing demand for feature-rich, connected, and personalized workout experiences in gyms and business clubs, pushing manufacturers to integrate smart technology and immersive content. Mergers and acquisitions (M&A) activity, with approximately 50 significant deals recorded historically, indicates strategic consolidation and expansion efforts by leading companies.
Commercial Exercise Bike Industry Trends & Analysis
The commercial exercise bike industry is poised for substantial growth, driven by a confluence of factors including increasing health consciousness among a global population exceeding 8 billion and a rising disposable income of approximately 12 trillion. The market is projected to grow at a Compound Annual Growth Rate (CAGR) of over 7.5% during the forecast period. Technological disruptions are a major trend, with the integration of AI-powered personalized training, virtual reality (VR) immersive experiences, and advanced biometric tracking revolutionizing user engagement. Consumer preferences are shifting towards connected fitness solutions that offer real-time performance data, interactive classes, and gamified workouts, fostering greater adherence and satisfaction. Competitive dynamics are intensifying, with established brands investing heavily in R&D and digital platforms to maintain market leadership, while new entrants are disrupting the space with innovative, budget-friendly solutions. Market penetration in developed economies is already significant, exceeding 60%, while emerging markets present substantial untapped potential, with an estimated addressable market exceeding 7 billion. The focus on preventative healthcare and the growing prevalence of sedentary lifestyles further amplify the demand for effective and accessible fitness solutions.
Leading Markets & Segments in Commercial Exercise Bike
The Gym application segment is the dominant force in the commercial exercise bike market, driven by its pervasive presence in fitness facilities catering to a vast user base. This segment alone accounts for an estimated 70% of the total market revenue, projected to surpass 4 billion by 2025.
- Key Drivers for Gym Dominance:
- Widespread Infrastructure: The sheer number of gyms globally provides a ready marketplace for commercial exercise bikes.
- Health & Wellness Trends: Increasing public awareness of health benefits drives gym memberships and equipment demand.
- Technological Integration: Gyms are early adopters of smart and connected fitness equipment to attract and retain members.
- Economies of Scale: Bulk purchasing by gym chains allows for competitive pricing and widespread availability.
Within the Types segment, the Upright exercise bike continues to hold significant market share, estimated at over 55% of the total exercise bike market, valued at approximately 3 billion. Its versatility, compact design, and familiar form factor make it a staple in diverse fitness environments.
- Key Drivers for Upright Dominance:
- User Familiarity: The intuitive design of upright bikes makes them accessible to users of all fitness levels.
- Space Efficiency: Their relatively smaller footprint compared to other types of exercise bikes makes them ideal for space-constrained gyms.
- Cost-Effectiveness: Upright bikes generally offer a more budget-friendly option for gym owners.
- Versatile Workout: They provide an effective cardiovascular workout that targets lower body muscles.
The Business Club segment, while smaller than the gym segment, is demonstrating robust growth, driven by corporate wellness initiatives and an increasing number of exclusive fitness offerings within business premises. This segment is estimated to grow at a CAGR of over 8% during the forecast period.
- Key Drivers for Business Club Growth:
- Corporate Wellness Programs: Companies are investing in on-site fitness facilities to promote employee health and productivity.
- Premium User Experience: Business clubs prioritize high-quality, technologically advanced equipment for their discerning clientele.
- Demand for Convenience: Offering fitness solutions within the workplace reduces barriers to exercise.
The Others application segment, encompassing hospitality, healthcare, and educational institutions, also presents a growing market, with an estimated market size of over 1 billion.
- Key Drivers for Others Segment Growth:
- Hospitality Demand: Hotels and resorts are increasingly equipping their fitness centers to cater to leisure and business travelers.
- Rehabilitation Centers: Exercise bikes are vital tools in physical therapy and rehabilitation programs.
- Educational Institutions: Universities and schools are investing in fitness equipment to promote student well-being.
The Back-to-back (recumbent) exercise bike segment, though currently holding a smaller market share of approximately 30%, is experiencing a steady increase in demand due to its emphasis on comfort and reduced strain on the back and joints, making it an attractive option for a broader demographic, including seniors and individuals with specific physical needs.
Commercial Exercise Bike Product Developments
Recent product developments in the commercial exercise bike market are heavily focused on enhancing user engagement and performance tracking. Innovations include the integration of high-definition touchscreens with immersive virtual reality environments, personalized AI-driven workout routines that adapt to individual fitness levels and goals, and advanced biometric sensors that provide real-time feedback on heart rate, calorie burn, and power output. Many new models also incorporate adjustable resistance systems that mimic real-world cycling terrains and offer seamless connectivity to popular fitness apps and platforms, allowing for progress monitoring and social interaction. These advancements not only improve the user experience but also provide gyms and fitness centers with valuable data to optimize class offerings and member retention.
Key Drivers of Commercial Exercise Bike Growth
The commercial exercise bike market is propelled by several significant growth drivers. Technologically, the advent of connected fitness and interactive training platforms has transformed the user experience, making workouts more engaging and personalized. Economically, a rising global disposable income and a growing emphasis on preventative healthcare are empowering individuals and institutions to invest in fitness equipment. Furthermore, government initiatives promoting physical activity and the increasing popularity of boutique fitness studios and corporate wellness programs are creating sustained demand. The expansion of the hospitality sector also contributes, as hotels equip their facilities to attract health-conscious travelers.
Challenges in the Commercial Exercise Bike Market
Despite its robust growth, the commercial exercise bike market faces several challenges. High initial investment costs for premium, technologically advanced equipment can be a barrier for smaller businesses. Rapid technological obsolescence necessitates continuous upgrades, adding to operational expenses. Intense competition from both established brands and emerging players, including the rapidly growing direct-to-consumer home fitness market, puts pressure on pricing and innovation. Supply chain disruptions and fluctuations in raw material costs can impact manufacturing and profitability. Furthermore, evolving user preferences require manufacturers to constantly adapt their product offerings to stay relevant.
Emerging Opportunities in Commercial Exercise Bike
Emerging opportunities in the commercial exercise bike market lie in the continued innovation of virtual reality and augmented reality integrated fitness experiences, which offer highly immersive and engaging workouts. The expansion of AI-powered personalized coaching and predictive analytics presents a significant avenue for differentiation and value creation. Strategic partnerships between equipment manufacturers and digital content providers will be crucial for delivering compelling fitness programming. Furthermore, the untapped potential in emerging economies and the growing demand for specialized equipment in rehabilitation and elder care facilities offer substantial long-term growth prospects.
Leading Players in the Commercial Exercise Bike Sector
- Brunswick
- Anta
- Nautilus
- Johnson Health
- Dyaco
- Jinjiang Shuhua Investment Development
- True Fitness
- Shanxi Orient
- Monark Exercise
- Loctek
- LifeCORE Fitness
Key Milestones in Commercial Exercise Bike Industry
- 2019: Introduction of advanced AI-driven workout personalization features, enhancing user experience.
- 2020: Significant surge in demand for connected fitness solutions driven by global health events.
- 2021: Increased investment in R&D for virtual reality and augmented reality integrated exercise bikes.
- 2022: Emergence of subscription-based content models for interactive fitness platforms, boosting recurring revenue.
- 2023: Growing adoption of sustainability practices in manufacturing and product design.
- 2024: Expansion of smart features, including advanced health monitoring and gamified fitness challenges.
Strategic Outlook for Commercial Exercise Bike Market
The strategic outlook for the commercial exercise bike market is exceptionally positive, driven by sustained consumer interest in health and fitness, coupled with rapid technological advancements. Key growth accelerators include the continued integration of smart technology, the expansion of subscription-based content models, and the increasing demand for personalized and immersive workout experiences. Manufacturers and industry stakeholders should focus on developing innovative products that cater to evolving user preferences, exploring strategic partnerships to enhance digital offerings, and capitalizing on the growth potential in emerging markets and specialized application segments to ensure long-term success and market leadership.
Commercial Exercise Bike Segmentation
-
1. Application
- 1.1. Gym
- 1.2. Business Club
- 1.3. Others
-
2. Types
- 2.1. Upright
- 2.2. Back-to-back
Commercial Exercise Bike Segmentation By Geography
-
1. North America
- 1.1. United States
- 1.2. Canada
- 1.3. Mexico
-
2. South America
- 2.1. Brazil
- 2.2. Argentina
- 2.3. Rest of South America
-
3. Europe
- 3.1. United Kingdom
- 3.2. Germany
- 3.3. France
- 3.4. Italy
- 3.5. Spain
- 3.6. Russia
- 3.7. Benelux
- 3.8. Nordics
- 3.9. Rest of Europe
-
4. Middle East & Africa
- 4.1. Turkey
- 4.2. Israel
- 4.3. GCC
- 4.4. North Africa
- 4.5. South Africa
- 4.6. Rest of Middle East & Africa
-
5. Asia Pacific
- 5.1. China
- 5.2. India
- 5.3. Japan
- 5.4. South Korea
- 5.5. ASEAN
- 5.6. Oceania
- 5.7. Rest of Asia Pacific
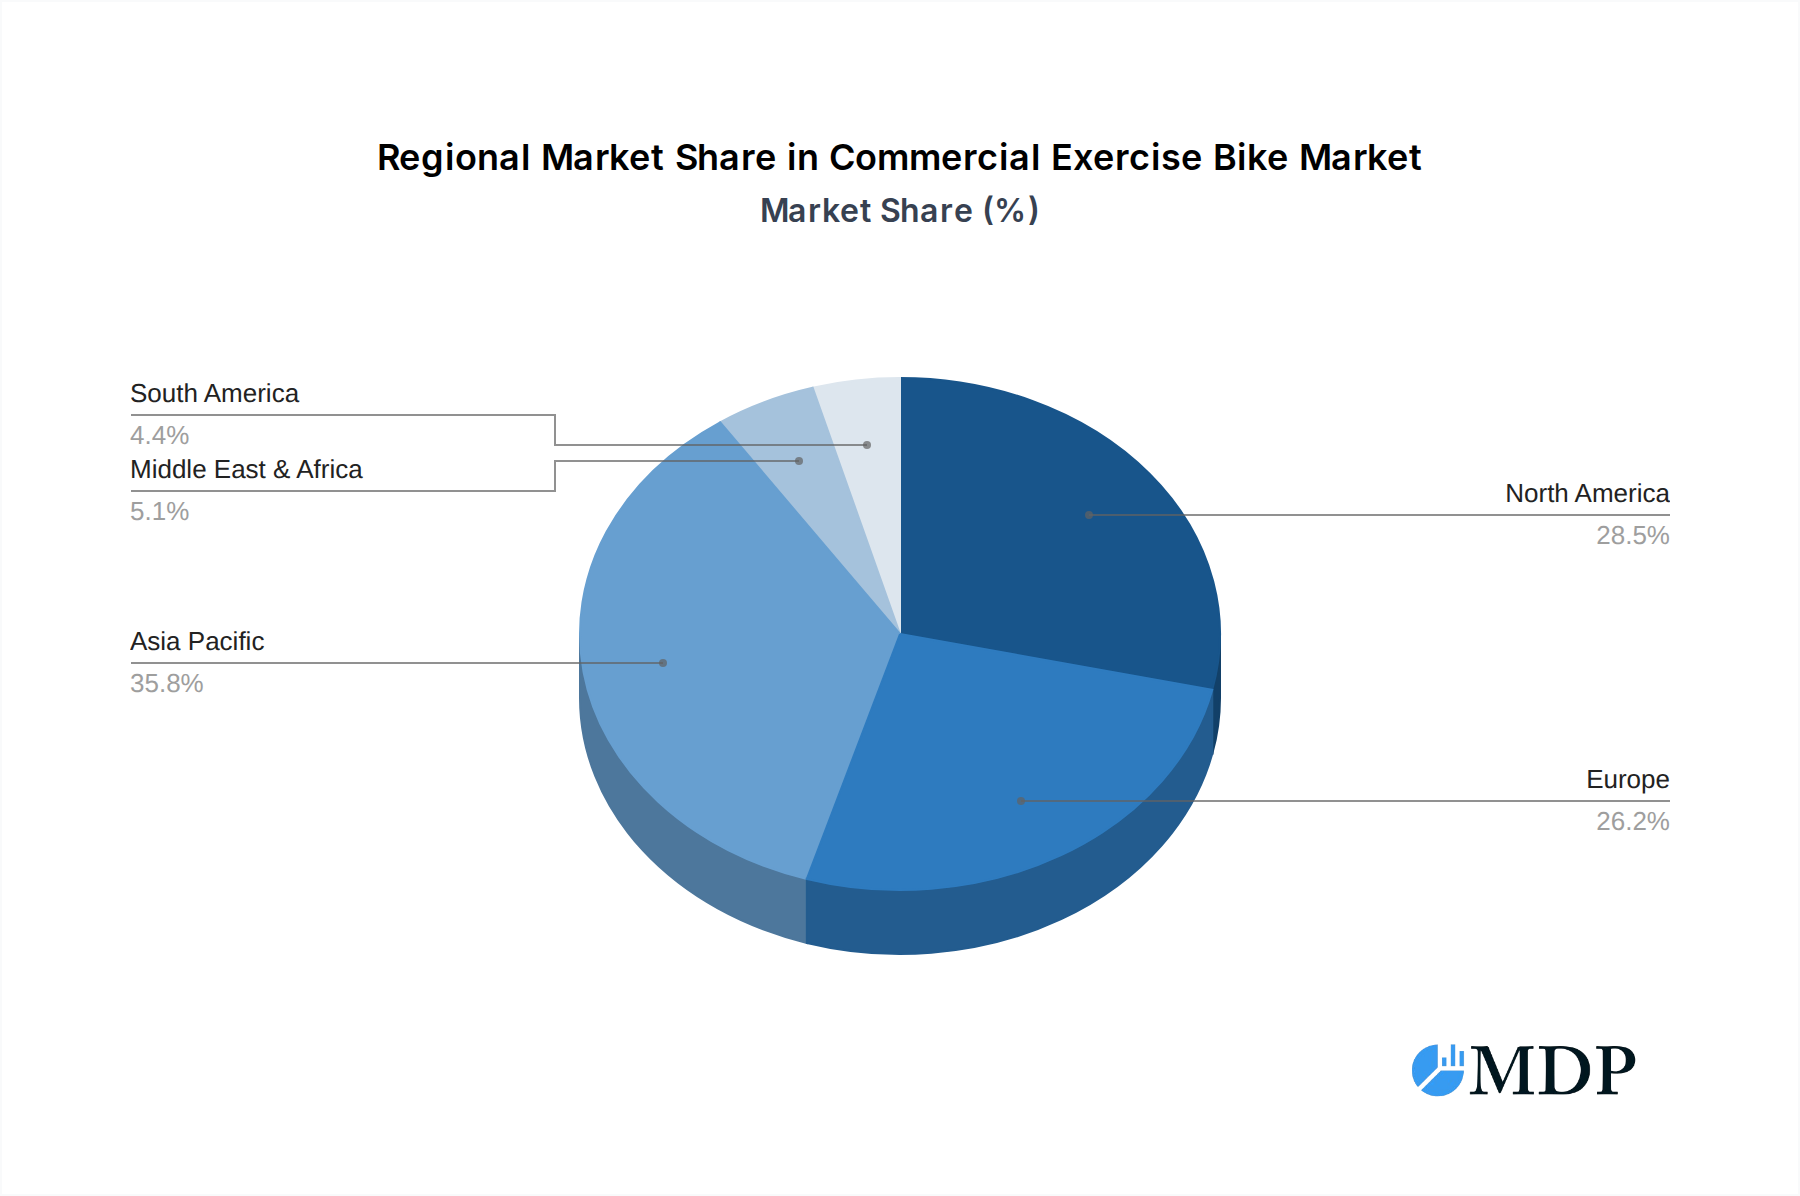
Commercial Exercise Bike Regional Market Share
Geographic Coverage of Commercial Exercise Bike
Commercial Exercise Bike REPORT HIGHLIGHTS
| Aspects | Details |
|---|---|
| Study Period | 2020-2034 |
| Base Year | 2025 |
| Estimated Year | 2026 |
| Forecast Period | 2026-2034 |
| Historical Period | 2020-2025 |
| Growth Rate | CAGR of 3.9% from 2020-2034 |
| Segmentation |
|
Table of Contents
- 1. Introduction
- 1.1. Research Scope
- 1.2. Market Segmentation
- 1.3. Research Methodology
- 1.4. Definitions and Assumptions
- 2. Executive Summary
- 2.1. Introduction
- 3. Market Dynamics
- 3.1. Introduction
- 3.2. Market Drivers
- 3.3. Market Restrains
- 3.4. Market Trends
- 4. Market Factor Analysis
- 4.1. Porters Five Forces
- 4.2. Supply/Value Chain
- 4.3. PESTEL analysis
- 4.4. Market Entropy
- 4.5. Patent/Trademark Analysis
- 5. Global Commercial Exercise Bike Analysis, Insights and Forecast, 2020-2032
- 5.1. Market Analysis, Insights and Forecast - by Application
- 5.1.1. Gym
- 5.1.2. Business Club
- 5.1.3. Others
- 5.2. Market Analysis, Insights and Forecast - by Types
- 5.2.1. Upright
- 5.2.2. Back-to-back
- 5.3. Market Analysis, Insights and Forecast - by Region
- 5.3.1. North America
- 5.3.2. South America
- 5.3.3. Europe
- 5.3.4. Middle East & Africa
- 5.3.5. Asia Pacific
- 5.1. Market Analysis, Insights and Forecast - by Application
- 6. North America Commercial Exercise Bike Analysis, Insights and Forecast, 2020-2032
- 6.1. Market Analysis, Insights and Forecast - by Application
- 6.1.1. Gym
- 6.1.2. Business Club
- 6.1.3. Others
- 6.2. Market Analysis, Insights and Forecast - by Types
- 6.2.1. Upright
- 6.2.2. Back-to-back
- 6.1. Market Analysis, Insights and Forecast - by Application
- 7. South America Commercial Exercise Bike Analysis, Insights and Forecast, 2020-2032
- 7.1. Market Analysis, Insights and Forecast - by Application
- 7.1.1. Gym
- 7.1.2. Business Club
- 7.1.3. Others
- 7.2. Market Analysis, Insights and Forecast - by Types
- 7.2.1. Upright
- 7.2.2. Back-to-back
- 7.1. Market Analysis, Insights and Forecast - by Application
- 8. Europe Commercial Exercise Bike Analysis, Insights and Forecast, 2020-2032
- 8.1. Market Analysis, Insights and Forecast - by Application
- 8.1.1. Gym
- 8.1.2. Business Club
- 8.1.3. Others
- 8.2. Market Analysis, Insights and Forecast - by Types
- 8.2.1. Upright
- 8.2.2. Back-to-back
- 8.1. Market Analysis, Insights and Forecast - by Application
- 9. Middle East & Africa Commercial Exercise Bike Analysis, Insights and Forecast, 2020-2032
- 9.1. Market Analysis, Insights and Forecast - by Application
- 9.1.1. Gym
- 9.1.2. Business Club
- 9.1.3. Others
- 9.2. Market Analysis, Insights and Forecast - by Types
- 9.2.1. Upright
- 9.2.2. Back-to-back
- 9.1. Market Analysis, Insights and Forecast - by Application
- 10. Asia Pacific Commercial Exercise Bike Analysis, Insights and Forecast, 2020-2032
- 10.1. Market Analysis, Insights and Forecast - by Application
- 10.1.1. Gym
- 10.1.2. Business Club
- 10.1.3. Others
- 10.2. Market Analysis, Insights and Forecast - by Types
- 10.2.1. Upright
- 10.2.2. Back-to-back
- 10.1. Market Analysis, Insights and Forecast - by Application
- 11. Competitive Analysis
- 11.1. Global Market Share Analysis 2025
- 11.2. Company Profiles
- 11.2.1 Brunswick
- 11.2.1.1. Overview
- 11.2.1.2. Products
- 11.2.1.3. SWOT Analysis
- 11.2.1.4. Recent Developments
- 11.2.1.5. Financials (Based on Availability)
- 11.2.2 Anta
- 11.2.2.1. Overview
- 11.2.2.2. Products
- 11.2.2.3. SWOT Analysis
- 11.2.2.4. Recent Developments
- 11.2.2.5. Financials (Based on Availability)
- 11.2.3 Nautilus
- 11.2.3.1. Overview
- 11.2.3.2. Products
- 11.2.3.3. SWOT Analysis
- 11.2.3.4. Recent Developments
- 11.2.3.5. Financials (Based on Availability)
- 11.2.4 Johnson Health
- 11.2.4.1. Overview
- 11.2.4.2. Products
- 11.2.4.3. SWOT Analysis
- 11.2.4.4. Recent Developments
- 11.2.4.5. Financials (Based on Availability)
- 11.2.5 Dyaco
- 11.2.5.1. Overview
- 11.2.5.2. Products
- 11.2.5.3. SWOT Analysis
- 11.2.5.4. Recent Developments
- 11.2.5.5. Financials (Based on Availability)
- 11.2.6 Jinjiang Shuhua Investment Development
- 11.2.6.1. Overview
- 11.2.6.2. Products
- 11.2.6.3. SWOT Analysis
- 11.2.6.4. Recent Developments
- 11.2.6.5. Financials (Based on Availability)
- 11.2.7 True Fitness
- 11.2.7.1. Overview
- 11.2.7.2. Products
- 11.2.7.3. SWOT Analysis
- 11.2.7.4. Recent Developments
- 11.2.7.5. Financials (Based on Availability)
- 11.2.8 Shanxi Orient
- 11.2.8.1. Overview
- 11.2.8.2. Products
- 11.2.8.3. SWOT Analysis
- 11.2.8.4. Recent Developments
- 11.2.8.5. Financials (Based on Availability)
- 11.2.9 Monark Exercise
- 11.2.9.1. Overview
- 11.2.9.2. Products
- 11.2.9.3. SWOT Analysis
- 11.2.9.4. Recent Developments
- 11.2.9.5. Financials (Based on Availability)
- 11.2.10 Loctek
- 11.2.10.1. Overview
- 11.2.10.2. Products
- 11.2.10.3. SWOT Analysis
- 11.2.10.4. Recent Developments
- 11.2.10.5. Financials (Based on Availability)
- 11.2.11 LifeCORE Fitness
- 11.2.11.1. Overview
- 11.2.11.2. Products
- 11.2.11.3. SWOT Analysis
- 11.2.11.4. Recent Developments
- 11.2.11.5. Financials (Based on Availability)
- 11.2.1 Brunswick
List of Figures
- Figure 1: Global Commercial Exercise Bike Revenue Breakdown (undefined, %) by Region 2025 & 2033
- Figure 2: Global Commercial Exercise Bike Volume Breakdown (K, %) by Region 2025 & 2033
- Figure 3: North America Commercial Exercise Bike Revenue (undefined), by Application 2025 & 2033
- Figure 4: North America Commercial Exercise Bike Volume (K), by Application 2025 & 2033
- Figure 5: North America Commercial Exercise Bike Revenue Share (%), by Application 2025 & 2033
- Figure 6: North America Commercial Exercise Bike Volume Share (%), by Application 2025 & 2033
- Figure 7: North America Commercial Exercise Bike Revenue (undefined), by Types 2025 & 2033
- Figure 8: North America Commercial Exercise Bike Volume (K), by Types 2025 & 2033
- Figure 9: North America Commercial Exercise Bike Revenue Share (%), by Types 2025 & 2033
- Figure 10: North America Commercial Exercise Bike Volume Share (%), by Types 2025 & 2033
- Figure 11: North America Commercial Exercise Bike Revenue (undefined), by Country 2025 & 2033
- Figure 12: North America Commercial Exercise Bike Volume (K), by Country 2025 & 2033
- Figure 13: North America Commercial Exercise Bike Revenue Share (%), by Country 2025 & 2033
- Figure 14: North America Commercial Exercise Bike Volume Share (%), by Country 2025 & 2033
- Figure 15: South America Commercial Exercise Bike Revenue (undefined), by Application 2025 & 2033
- Figure 16: South America Commercial Exercise Bike Volume (K), by Application 2025 & 2033
- Figure 17: South America Commercial Exercise Bike Revenue Share (%), by Application 2025 & 2033
- Figure 18: South America Commercial Exercise Bike Volume Share (%), by Application 2025 & 2033
- Figure 19: South America Commercial Exercise Bike Revenue (undefined), by Types 2025 & 2033
- Figure 20: South America Commercial Exercise Bike Volume (K), by Types 2025 & 2033
- Figure 21: South America Commercial Exercise Bike Revenue Share (%), by Types 2025 & 2033
- Figure 22: South America Commercial Exercise Bike Volume Share (%), by Types 2025 & 2033
- Figure 23: South America Commercial Exercise Bike Revenue (undefined), by Country 2025 & 2033
- Figure 24: South America Commercial Exercise Bike Volume (K), by Country 2025 & 2033
- Figure 25: South America Commercial Exercise Bike Revenue Share (%), by Country 2025 & 2033
- Figure 26: South America Commercial Exercise Bike Volume Share (%), by Country 2025 & 2033
- Figure 27: Europe Commercial Exercise Bike Revenue (undefined), by Application 2025 & 2033
- Figure 28: Europe Commercial Exercise Bike Volume (K), by Application 2025 & 2033
- Figure 29: Europe Commercial Exercise Bike Revenue Share (%), by Application 2025 & 2033
- Figure 30: Europe Commercial Exercise Bike Volume Share (%), by Application 2025 & 2033
- Figure 31: Europe Commercial Exercise Bike Revenue (undefined), by Types 2025 & 2033
- Figure 32: Europe Commercial Exercise Bike Volume (K), by Types 2025 & 2033
- Figure 33: Europe Commercial Exercise Bike Revenue Share (%), by Types 2025 & 2033
- Figure 34: Europe Commercial Exercise Bike Volume Share (%), by Types 2025 & 2033
- Figure 35: Europe Commercial Exercise Bike Revenue (undefined), by Country 2025 & 2033
- Figure 36: Europe Commercial Exercise Bike Volume (K), by Country 2025 & 2033
- Figure 37: Europe Commercial Exercise Bike Revenue Share (%), by Country 2025 & 2033
- Figure 38: Europe Commercial Exercise Bike Volume Share (%), by Country 2025 & 2033
- Figure 39: Middle East & Africa Commercial Exercise Bike Revenue (undefined), by Application 2025 & 2033
- Figure 40: Middle East & Africa Commercial Exercise Bike Volume (K), by Application 2025 & 2033
- Figure 41: Middle East & Africa Commercial Exercise Bike Revenue Share (%), by Application 2025 & 2033
- Figure 42: Middle East & Africa Commercial Exercise Bike Volume Share (%), by Application 2025 & 2033
- Figure 43: Middle East & Africa Commercial Exercise Bike Revenue (undefined), by Types 2025 & 2033
- Figure 44: Middle East & Africa Commercial Exercise Bike Volume (K), by Types 2025 & 2033
- Figure 45: Middle East & Africa Commercial Exercise Bike Revenue Share (%), by Types 2025 & 2033
- Figure 46: Middle East & Africa Commercial Exercise Bike Volume Share (%), by Types 2025 & 2033
- Figure 47: Middle East & Africa Commercial Exercise Bike Revenue (undefined), by Country 2025 & 2033
- Figure 48: Middle East & Africa Commercial Exercise Bike Volume (K), by Country 2025 & 2033
- Figure 49: Middle East & Africa Commercial Exercise Bike Revenue Share (%), by Country 2025 & 2033
- Figure 50: Middle East & Africa Commercial Exercise Bike Volume Share (%), by Country 2025 & 2033
- Figure 51: Asia Pacific Commercial Exercise Bike Revenue (undefined), by Application 2025 & 2033
- Figure 52: Asia Pacific Commercial Exercise Bike Volume (K), by Application 2025 & 2033
- Figure 53: Asia Pacific Commercial Exercise Bike Revenue Share (%), by Application 2025 & 2033
- Figure 54: Asia Pacific Commercial Exercise Bike Volume Share (%), by Application 2025 & 2033
- Figure 55: Asia Pacific Commercial Exercise Bike Revenue (undefined), by Types 2025 & 2033
- Figure 56: Asia Pacific Commercial Exercise Bike Volume (K), by Types 2025 & 2033
- Figure 57: Asia Pacific Commercial Exercise Bike Revenue Share (%), by Types 2025 & 2033
- Figure 58: Asia Pacific Commercial Exercise Bike Volume Share (%), by Types 2025 & 2033
- Figure 59: Asia Pacific Commercial Exercise Bike Revenue (undefined), by Country 2025 & 2033
- Figure 60: Asia Pacific Commercial Exercise Bike Volume (K), by Country 2025 & 2033
- Figure 61: Asia Pacific Commercial Exercise Bike Revenue Share (%), by Country 2025 & 2033
- Figure 62: Asia Pacific Commercial Exercise Bike Volume Share (%), by Country 2025 & 2033
List of Tables
- Table 1: Global Commercial Exercise Bike Revenue undefined Forecast, by Application 2020 & 2033
- Table 2: Global Commercial Exercise Bike Volume K Forecast, by Application 2020 & 2033
- Table 3: Global Commercial Exercise Bike Revenue undefined Forecast, by Types 2020 & 2033
- Table 4: Global Commercial Exercise Bike Volume K Forecast, by Types 2020 & 2033
- Table 5: Global Commercial Exercise Bike Revenue undefined Forecast, by Region 2020 & 2033
- Table 6: Global Commercial Exercise Bike Volume K Forecast, by Region 2020 & 2033
- Table 7: Global Commercial Exercise Bike Revenue undefined Forecast, by Application 2020 & 2033
- Table 8: Global Commercial Exercise Bike Volume K Forecast, by Application 2020 & 2033
- Table 9: Global Commercial Exercise Bike Revenue undefined Forecast, by Types 2020 & 2033
- Table 10: Global Commercial Exercise Bike Volume K Forecast, by Types 2020 & 2033
- Table 11: Global Commercial Exercise Bike Revenue undefined Forecast, by Country 2020 & 2033
- Table 12: Global Commercial Exercise Bike Volume K Forecast, by Country 2020 & 2033
- Table 13: United States Commercial Exercise Bike Revenue (undefined) Forecast, by Application 2020 & 2033
- Table 14: United States Commercial Exercise Bike Volume (K) Forecast, by Application 2020 & 2033
- Table 15: Canada Commercial Exercise Bike Revenue (undefined) Forecast, by Application 2020 & 2033
- Table 16: Canada Commercial Exercise Bike Volume (K) Forecast, by Application 2020 & 2033
- Table 17: Mexico Commercial Exercise Bike Revenue (undefined) Forecast, by Application 2020 & 2033
- Table 18: Mexico Commercial Exercise Bike Volume (K) Forecast, by Application 2020 & 2033
- Table 19: Global Commercial Exercise Bike Revenue undefined Forecast, by Application 2020 & 2033
- Table 20: Global Commercial Exercise Bike Volume K Forecast, by Application 2020 & 2033
- Table 21: Global Commercial Exercise Bike Revenue undefined Forecast, by Types 2020 & 2033
- Table 22: Global Commercial Exercise Bike Volume K Forecast, by Types 2020 & 2033
- Table 23: Global Commercial Exercise Bike Revenue undefined Forecast, by Country 2020 & 2033
- Table 24: Global Commercial Exercise Bike Volume K Forecast, by Country 2020 & 2033
- Table 25: Brazil Commercial Exercise Bike Revenue (undefined) Forecast, by Application 2020 & 2033
- Table 26: Brazil Commercial Exercise Bike Volume (K) Forecast, by Application 2020 & 2033
- Table 27: Argentina Commercial Exercise Bike Revenue (undefined) Forecast, by Application 2020 & 2033
- Table 28: Argentina Commercial Exercise Bike Volume (K) Forecast, by Application 2020 & 2033
- Table 29: Rest of South America Commercial Exercise Bike Revenue (undefined) Forecast, by Application 2020 & 2033
- Table 30: Rest of South America Commercial Exercise Bike Volume (K) Forecast, by Application 2020 & 2033
- Table 31: Global Commercial Exercise Bike Revenue undefined Forecast, by Application 2020 & 2033
- Table 32: Global Commercial Exercise Bike Volume K Forecast, by Application 2020 & 2033
- Table 33: Global Commercial Exercise Bike Revenue undefined Forecast, by Types 2020 & 2033
- Table 34: Global Commercial Exercise Bike Volume K Forecast, by Types 2020 & 2033
- Table 35: Global Commercial Exercise Bike Revenue undefined Forecast, by Country 2020 & 2033
- Table 36: Global Commercial Exercise Bike Volume K Forecast, by Country 2020 & 2033
- Table 37: United Kingdom Commercial Exercise Bike Revenue (undefined) Forecast, by Application 2020 & 2033
- Table 38: United Kingdom Commercial Exercise Bike Volume (K) Forecast, by Application 2020 & 2033
- Table 39: Germany Commercial Exercise Bike Revenue (undefined) Forecast, by Application 2020 & 2033
- Table 40: Germany Commercial Exercise Bike Volume (K) Forecast, by Application 2020 & 2033
- Table 41: France Commercial Exercise Bike Revenue (undefined) Forecast, by Application 2020 & 2033
- Table 42: France Commercial Exercise Bike Volume (K) Forecast, by Application 2020 & 2033
- Table 43: Italy Commercial Exercise Bike Revenue (undefined) Forecast, by Application 2020 & 2033
- Table 44: Italy Commercial Exercise Bike Volume (K) Forecast, by Application 2020 & 2033
- Table 45: Spain Commercial Exercise Bike Revenue (undefined) Forecast, by Application 2020 & 2033
- Table 46: Spain Commercial Exercise Bike Volume (K) Forecast, by Application 2020 & 2033
- Table 47: Russia Commercial Exercise Bike Revenue (undefined) Forecast, by Application 2020 & 2033
- Table 48: Russia Commercial Exercise Bike Volume (K) Forecast, by Application 2020 & 2033
- Table 49: Benelux Commercial Exercise Bike Revenue (undefined) Forecast, by Application 2020 & 2033
- Table 50: Benelux Commercial Exercise Bike Volume (K) Forecast, by Application 2020 & 2033
- Table 51: Nordics Commercial Exercise Bike Revenue (undefined) Forecast, by Application 2020 & 2033
- Table 52: Nordics Commercial Exercise Bike Volume (K) Forecast, by Application 2020 & 2033
- Table 53: Rest of Europe Commercial Exercise Bike Revenue (undefined) Forecast, by Application 2020 & 2033
- Table 54: Rest of Europe Commercial Exercise Bike Volume (K) Forecast, by Application 2020 & 2033
- Table 55: Global Commercial Exercise Bike Revenue undefined Forecast, by Application 2020 & 2033
- Table 56: Global Commercial Exercise Bike Volume K Forecast, by Application 2020 & 2033
- Table 57: Global Commercial Exercise Bike Revenue undefined Forecast, by Types 2020 & 2033
- Table 58: Global Commercial Exercise Bike Volume K Forecast, by Types 2020 & 2033
- Table 59: Global Commercial Exercise Bike Revenue undefined Forecast, by Country 2020 & 2033
- Table 60: Global Commercial Exercise Bike Volume K Forecast, by Country 2020 & 2033
- Table 61: Turkey Commercial Exercise Bike Revenue (undefined) Forecast, by Application 2020 & 2033
- Table 62: Turkey Commercial Exercise Bike Volume (K) Forecast, by Application 2020 & 2033
- Table 63: Israel Commercial Exercise Bike Revenue (undefined) Forecast, by Application 2020 & 2033
- Table 64: Israel Commercial Exercise Bike Volume (K) Forecast, by Application 2020 & 2033
- Table 65: GCC Commercial Exercise Bike Revenue (undefined) Forecast, by Application 2020 & 2033
- Table 66: GCC Commercial Exercise Bike Volume (K) Forecast, by Application 2020 & 2033
- Table 67: North Africa Commercial Exercise Bike Revenue (undefined) Forecast, by Application 2020 & 2033
- Table 68: North Africa Commercial Exercise Bike Volume (K) Forecast, by Application 2020 & 2033
- Table 69: South Africa Commercial Exercise Bike Revenue (undefined) Forecast, by Application 2020 & 2033
- Table 70: South Africa Commercial Exercise Bike Volume (K) Forecast, by Application 2020 & 2033
- Table 71: Rest of Middle East & Africa Commercial Exercise Bike Revenue (undefined) Forecast, by Application 2020 & 2033
- Table 72: Rest of Middle East & Africa Commercial Exercise Bike Volume (K) Forecast, by Application 2020 & 2033
- Table 73: Global Commercial Exercise Bike Revenue undefined Forecast, by Application 2020 & 2033
- Table 74: Global Commercial Exercise Bike Volume K Forecast, by Application 2020 & 2033
- Table 75: Global Commercial Exercise Bike Revenue undefined Forecast, by Types 2020 & 2033
- Table 76: Global Commercial Exercise Bike Volume K Forecast, by Types 2020 & 2033
- Table 77: Global Commercial Exercise Bike Revenue undefined Forecast, by Country 2020 & 2033
- Table 78: Global Commercial Exercise Bike Volume K Forecast, by Country 2020 & 2033
- Table 79: China Commercial Exercise Bike Revenue (undefined) Forecast, by Application 2020 & 2033
- Table 80: China Commercial Exercise Bike Volume (K) Forecast, by Application 2020 & 2033
- Table 81: India Commercial Exercise Bike Revenue (undefined) Forecast, by Application 2020 & 2033
- Table 82: India Commercial Exercise Bike Volume (K) Forecast, by Application 2020 & 2033
- Table 83: Japan Commercial Exercise Bike Revenue (undefined) Forecast, by Application 2020 & 2033
- Table 84: Japan Commercial Exercise Bike Volume (K) Forecast, by Application 2020 & 2033
- Table 85: South Korea Commercial Exercise Bike Revenue (undefined) Forecast, by Application 2020 & 2033
- Table 86: South Korea Commercial Exercise Bike Volume (K) Forecast, by Application 2020 & 2033
- Table 87: ASEAN Commercial Exercise Bike Revenue (undefined) Forecast, by Application 2020 & 2033
- Table 88: ASEAN Commercial Exercise Bike Volume (K) Forecast, by Application 2020 & 2033
- Table 89: Oceania Commercial Exercise Bike Revenue (undefined) Forecast, by Application 2020 & 2033
- Table 90: Oceania Commercial Exercise Bike Volume (K) Forecast, by Application 2020 & 2033
- Table 91: Rest of Asia Pacific Commercial Exercise Bike Revenue (undefined) Forecast, by Application 2020 & 2033
- Table 92: Rest of Asia Pacific Commercial Exercise Bike Volume (K) Forecast, by Application 2020 & 2033
Frequently Asked Questions
1. What is the projected Compound Annual Growth Rate (CAGR) of the Commercial Exercise Bike?
The projected CAGR is approximately 3.9%.
2. Which companies are prominent players in the Commercial Exercise Bike?
Key companies in the market include Brunswick, Anta, Nautilus, Johnson Health, Dyaco, Jinjiang Shuhua Investment Development, True Fitness, Shanxi Orient, Monark Exercise, Loctek, LifeCORE Fitness.
3. What are the main segments of the Commercial Exercise Bike?
The market segments include Application, Types.
4. Can you provide details about the market size?
The market size is estimated to be USD XXX N/A as of 2022.
5. What are some drivers contributing to market growth?
N/A
6. What are the notable trends driving market growth?
N/A
7. Are there any restraints impacting market growth?
N/A
8. Can you provide examples of recent developments in the market?
N/A
9. What pricing options are available for accessing the report?
Pricing options include single-user, multi-user, and enterprise licenses priced at USD 3950.00, USD 5925.00, and USD 7900.00 respectively.
10. Is the market size provided in terms of value or volume?
The market size is provided in terms of value, measured in N/A and volume, measured in K.
11. Are there any specific market keywords associated with the report?
Yes, the market keyword associated with the report is "Commercial Exercise Bike," which aids in identifying and referencing the specific market segment covered.
12. How do I determine which pricing option suits my needs best?
The pricing options vary based on user requirements and access needs. Individual users may opt for single-user licenses, while businesses requiring broader access may choose multi-user or enterprise licenses for cost-effective access to the report.
13. Are there any additional resources or data provided in the Commercial Exercise Bike report?
While the report offers comprehensive insights, it's advisable to review the specific contents or supplementary materials provided to ascertain if additional resources or data are available.
14. How can I stay updated on further developments or reports in the Commercial Exercise Bike?
To stay informed about further developments, trends, and reports in the Commercial Exercise Bike, consider subscribing to industry newsletters, following relevant companies and organizations, or regularly checking reputable industry news sources and publications.
Methodology
Step 1 - Identification of Relevant Samples Size from Population Database


Step 2 - Approaches for Defining Global Market Size (Value, Volume* & Price*)

Note*: In applicable scenarios
Step 3 - Data Sources
Primary Research
- Web Analytics
- Survey Reports
- Research Institute
- Latest Research Reports
- Opinion Leaders
Secondary Research
- Annual Reports
- White Paper
- Latest Press Release
- Industry Association
- Paid Database
- Investor Presentations

Step 4 - Data Triangulation
Involves using different sources of information in order to increase the validity of a study
These sources are likely to be stakeholders in a program - participants, other researchers, program staff, other community members, and so on.
Then we put all data in single framework & apply various statistical tools to find out the dynamic on the market.
During the analysis stage, feedback from the stakeholder groups would be compared to determine areas of agreement as well as areas of divergence