

Key Insights
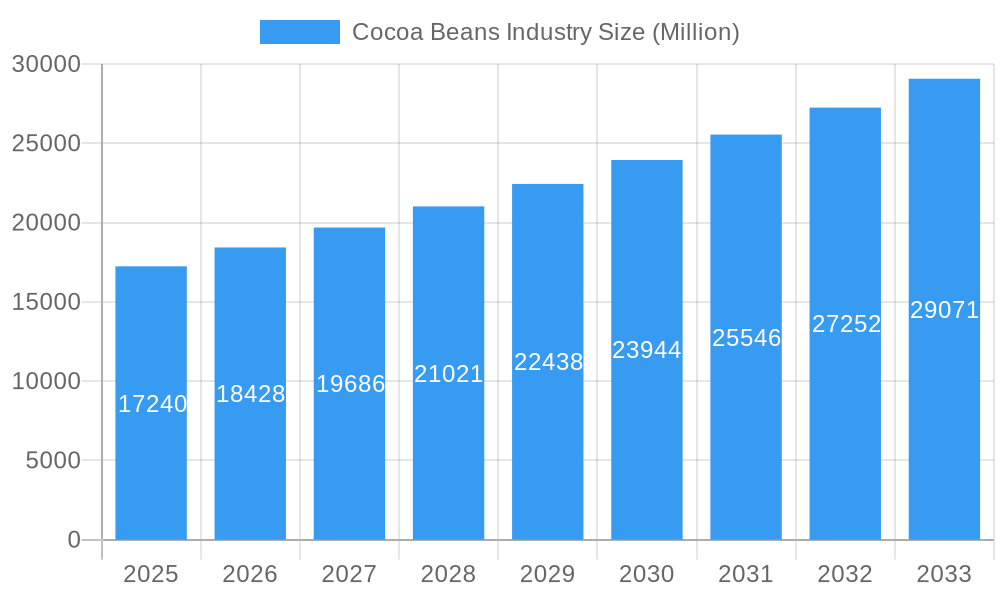
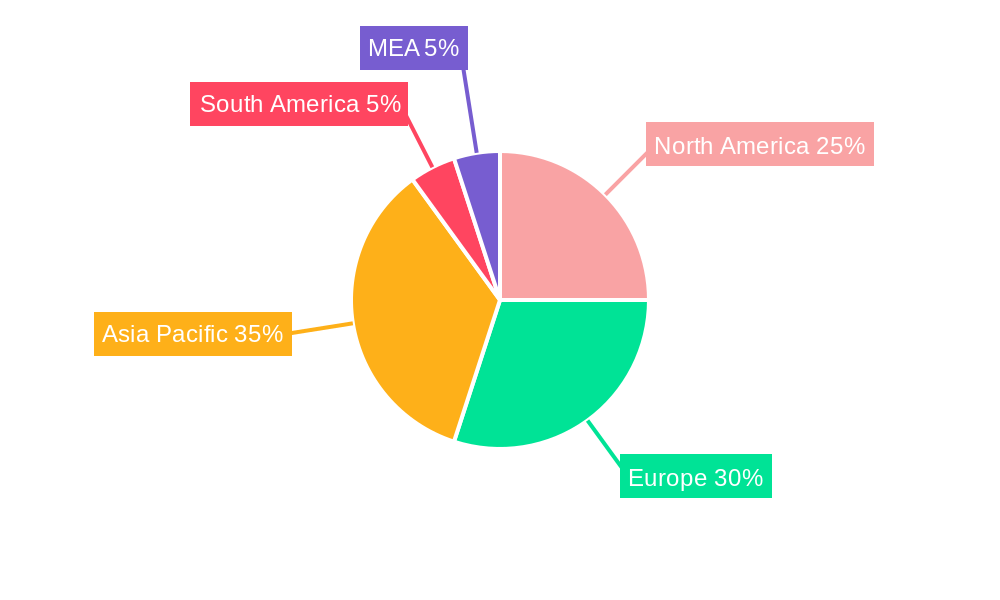
The global cocoa beans market, valued at $17.24 billion in 2025, is projected to experience robust growth, driven by rising consumer demand for chocolate and cocoa-based products. This growth is fueled by several factors, including increasing disposable incomes in developing economies, a growing preference for premium chocolate varieties, and the expanding popularity of cocoa-infused beverages and bakery items. The confectionery industry remains the dominant end-user sector, followed by beverages and bakery products. The market is segmented by product type (bulk cocoa beans, cocoa butter, cocoa powder, chocolate), processing type (fermented and non-fermented), and sales channels (online retail, supermarkets/hypermarkets, and specialty stores). Major players like Cargill, Mars, Mondelez International, Olam International, and Barry Callebaut dominate the market landscape, leveraging their extensive supply chains and established brand recognition to capture significant market share. Geographical distribution shows a strong presence across North America, Europe, and Asia-Pacific, with emerging markets in Asia and South America presenting significant growth opportunities. The market's sustained growth trajectory is expected to continue, propelled by innovation in product offerings and a focus on sustainable sourcing practices.
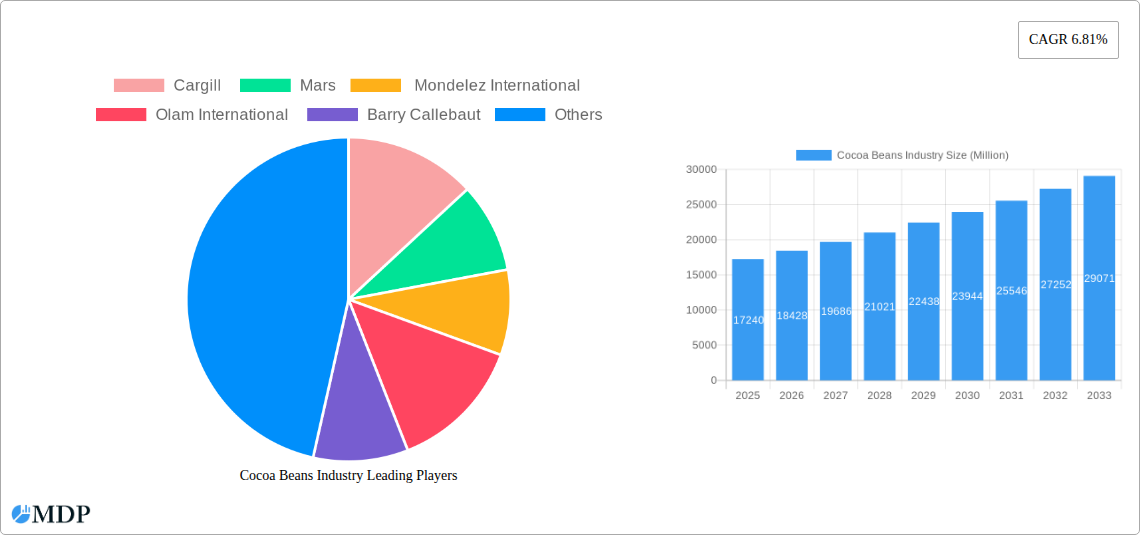
Cocoa Beans Industry Market Size (In Billion)
Further analysis reveals a dynamic interplay of factors influencing the market's future trajectory. The increasing awareness of health benefits associated with moderate cocoa consumption could further boost demand. However, challenges like fluctuations in cocoa bean prices due to climatic conditions and geopolitical instability present potential headwinds. The ongoing shift towards sustainable and ethical sourcing, driven by consumer preferences and regulatory pressures, is impacting production and supply chain management strategies for market leaders. Companies are increasingly investing in traceability initiatives and collaborating with farmers to ensure responsible sourcing practices, which is expected to influence long-term market stability and growth. Competitive dynamics are characterized by mergers, acquisitions, and strategic alliances aimed at enhancing market penetration and product diversification. The market's future will depend on effectively navigating these challenges and opportunities to maintain the projected CAGR of 6.81% during the forecast period (2025-2033).
Cocoa Beans Industry Company Market Share
Cocoa Beans Industry: A Comprehensive Market Report (2019-2033)
This comprehensive report provides a detailed analysis of the global cocoa beans industry, covering market dynamics, trends, leading players, and future prospects. With a study period spanning 2019-2033, a base year of 2025, and a forecast period of 2025-2033, this report offers invaluable insights for industry stakeholders, investors, and businesses operating within this dynamic sector. This report leverages high-impact keywords like "cocoa beans market," "cocoa processing," "chocolate industry," "cocoa butter," and "cocoa powder" to ensure maximum search engine visibility.
Cocoa Beans Industry Market Dynamics & Concentration
The global cocoa beans market, a vital component of the confectionery and food industries, is a dynamic landscape shaped by a complex interplay of supply, demand, innovation, and a growing emphasis on ethical sourcing. Valued at an estimated [Insert Current Market Value Here, e.g., $50,000 Million] in 2024, the market is characterized by a moderate level of concentration. Key global players such as Cargill, Mars, Mondelez International, Olam International, and Barry Callebaut exert significant influence, shaping market trends through their extensive supply chains, processing capabilities, and brand recognition. The industry is in a constant state of evolution, driven by advancements in cultivation and processing, shifting regulatory environments, and an increasingly discerning global consumer base that prioritizes both quality and sustainability.
- Market Concentration: In 2024, the top 5 industry leaders collectively command approximately [Insert Percentage Here, e.g., 65]% of the global market share, signifying a moderately consolidated market. This structural balance is anticipated to persist, with minor shifts likely due to strategic acquisitions and market entry of specialized producers.
- Innovation Drivers: A paramount driver of innovation is the escalating demand for sustainable cocoa. Initiatives focused on combating deforestation, eradicating child labor, and promoting fair wages throughout the supply chain are transforming sourcing and processing methodologies. Concurrently, technological breakthroughs in areas like controlled fermentation, advanced roasting profiles, and innovative processing techniques are continuously enhancing the quality, flavor complexity, and yield efficiency of cocoa beans.
- Regulatory Frameworks: The cocoa beans industry is significantly influenced by a web of international and national regulations. Fluctuations in import/export duties, as exemplified by changes in fiscal policies in key consuming nations, can directly impact market access and pricing. Furthermore, the tightening of sustainability regulations, particularly those being implemented by major markets like the European Union, is compelling industry stakeholders to adopt more transparent and responsible practices.
- Product Substitutes: While direct substitutes for cocoa in its primary applications are limited, the burgeoning interest in plant-based and alternative chocolate formulations presents a long-term, evolving competitive consideration. The industry is responding by emphasizing the unique sensory attributes and perceived health benefits of traditional cocoa.
- End-User Trends: The market is experiencing robust growth fueled by a strong consumer appetite for premium chocolate products, artisanal confections, and sophisticated cocoa-based beverages. A notable trend is the increasing demand for cocoa products recognized for their high antioxidant content and potential health benefits, catering to a more health-conscious demographic.
- M&A Activities: Over the past five years, the industry has witnessed approximately [Insert Number of Deals Here, e.g., 15] Mergers and Acquisitions. These strategic consolidations have primarily aimed at securing resilient supply chains, gaining access to critical production regions, and expanding global market reach. This trend is expected to continue at a measured pace as companies seek to optimize their operations and competitive positioning.
Cocoa Beans Industry Industry Trends & Analysis
The global cocoa beans market is poised for significant growth, driven by a robust CAGR of xx% from 2025 to 2033. This growth is fueled by several key factors:
- Market Growth Drivers: Rising disposable incomes in emerging economies, particularly in Asia, are boosting cocoa consumption. The increasing popularity of chocolate confectionery and cocoa-based beverages worldwide is another significant driver.
- Technological Disruptions: Automation and improved processing technologies enhance efficiency and product quality, lowering production costs. Traceability technologies are improving supply chain transparency and addressing sustainability concerns.
- Consumer Preferences: Premiumization is a significant trend, with consumers increasingly seeking high-quality, ethically sourced cocoa products. Health and wellness trends are driving demand for cocoa products with proven health benefits.
- Competitive Dynamics: The market is characterized by intense competition among major players, leading to innovation, strategic partnerships, and ongoing efforts to secure sustainable supply chains. Market penetration of new products and technologies will be a key aspect of competitive positioning.
Leading Markets & Segments in Cocoa Beans Industry
- Dominant Region: West Africa, with Ivory Coast and Ghana leading the charge, unequivocally remains the epicenter of global cocoa bean production. This dominance is attributed to the region's optimal climatic conditions and established agricultural expertise in cocoa cultivation.
- Dominant Product Type: Bulk cocoa beans continue to represent the largest market segment, accounting for approximately [Insert Percentage Here, e.g., 70]% of the global market share in 2024. However, significant growth potential is observed in value-added segments such as cocoa butter, cocoa powder, and particularly, refined chocolate products.
- Dominant Processing Type: Fermented cocoa beans command a substantial market share due to the superior flavor profiles and enhanced quality attributes they possess, a direct result of carefully controlled fermentation processes.
- Dominant End-User Industry: The confectionery sector remains the primary consumer of cocoa beans. Nonetheless, the beverage industry, particularly for hot chocolate and specialty drinks, and the bakery sector, featuring a wide array of cocoa-infused products, are exhibiting strong and consistent growth.
- Dominant Sales Channel: Supermarkets and hypermarkets continue to be the leading sales channels for cocoa bean-derived products, leveraging their extensive geographical reach, accessibility, and ability to cater to a broad consumer base.
Key Drivers:
- Economic Policies: Supportive government policies, including incentives for cocoa farmers, investment in agricultural research, and favorable international trade agreements, are critical catalysts for both increased production and enhanced market access.
- Infrastructure Development: Continuous improvements in transportation networks (roads, ports), modern storage facilities, and processing infrastructure are essential for ensuring the efficient movement of cocoa beans from farm to consumer, thereby reducing post-harvest losses and improving overall market competitiveness.
Cocoa Beans Industry Product Developments
The cocoa beans industry is actively embracing innovation to meet evolving market demands and address sustainability imperatives. Recent product developments are centered on elevating cocoa bean quality through improved cultivation practices and post-harvest handling. There's a notable surge in the development of novel cocoa-based products, including functional foods and beverages fortified with beneficial compounds, and the creation of unique flavor profiles. Furthermore, significant advancements are being made in fermentation and processing technologies, leading to higher yields, more consistent quality, and the ability to extract a wider spectrum of desirable flavor compounds. The overarching goal is to create premium, value-added products that resonate with discerning consumers and provide a distinct competitive advantage for producers and manufacturers within the global market.
Key Drivers of Cocoa Beans Industry Growth
Several factors contribute to the cocoa beans industry's growth trajectory. These include:
- Technological advancements: Improved farming practices and processing techniques boost productivity and quality.
- Economic growth: Rising disposable incomes in developing nations fuel demand for cocoa products.
- Favorable government policies: Incentives for cocoa production and trade liberalization foster industry growth. For instance, India's reduced custom duty on cocoa beans is a positive example.
Challenges in the Cocoa Beans Industry Market
The cocoa beans industry navigates a complex terrain marked by several significant challenges that require ongoing strategic attention:
- Sustainability Concerns: The imperative to address deeply ingrained issues such as child labor, deforestation, and farmer poverty is paramount for the long-term ethical and economic viability of the industry. Initiatives like the substantial USD 442 Million investment from the EU underscore the global commitment to tackling these challenges, yet their resolution remains a persistent and multifaceted undertaking.
- Climate Change Impact: Cocoa cultivation is highly sensitive to climatic variations. Fluctuations in temperature, rainfall patterns, and increased occurrences of extreme weather events pose substantial risks to crop yields, bean quality, and the overall stability of supply.
- Supply Chain Disruptions: The global nature of the cocoa supply chain makes it vulnerable to a range of disruptions, including geopolitical instability, trade disputes, pandemics, and logistical bottlenecks. These events can lead to volatile price fluctuations, impact the availability of raw materials, and ultimately affect the profitability and operational continuity of businesses across the value chain.
Emerging Opportunities in Cocoa Beans Industry
The cocoa beans industry is ripe with opportunities for forward-thinking stakeholders poised to leverage innovation and strategic foresight:
- Technological Innovations: The adoption of advanced technologies, including precision agriculture techniques for optimized cultivation, the use of AI in crop monitoring and disease prediction, and the implementation of cutting-edge processing technologies, offers significant potential to enhance efficiency, reduce waste, and improve the quality and traceability of cocoa beans.
- Strategic Partnerships: Fostering robust collaborations among cocoa farmers, cooperatives, processors, manufacturers, and retailers is crucial. These partnerships can drive greater supply chain transparency, facilitate the implementation of sustainable practices, and ensure fair remuneration for all stakeholders.
- Market Expansion: Exploring and penetrating new consumer segments, particularly in emerging economies with growing middle classes, and developing niche markets for specialized cocoa products represent significant avenues for revenue growth. The burgeoning field of cocoa-based functional foods and beverages, leveraging the perceived health benefits of cocoa, presents a particularly promising area for future development and market expansion.
Leading Players in the Cocoa Beans Industry Sector
Key Milestones in Cocoa Beans Industry Industry
- June 2021: Ivory Coast initiates a biomass plant powered by cocoa waste, enhancing sustainability.
- February 2022: India reduces cocoa bean import duty to 15%, stimulating market growth.
- October 2022: The EU and partners commit USD 442 Million to combat child labor and deforestation in the Ivory Coast cocoa sector.
Strategic Outlook for Cocoa Beans Industry Market
The future of the cocoa beans industry is promising, with substantial growth potential driven by increasing consumer demand, technological advancements, and ongoing efforts to improve sustainability. Strategic investments in sustainable sourcing, innovative product development, and efficient supply chain management will be crucial for success in this dynamic market.
Cocoa Beans Industry Segmentation
-
1. North America
- 1.1. United States
- 1.2. Canada
-
2. Europe
- 2.1. Germany
- 2.2. Netherland
- 2.3. United Kingdom
- 2.4. France
- 2.5. Belgium
- 2.6. Russia
-
3. Asia-Pacific
- 3.1. India
- 3.2. Malaysia
- 3.3. Indonesia
- 3.4. Singapore
- 3.5. Japan
-
4. South America
- 4.1. Brazil
- 4.2. Ecuador
-
5. Africa
- 5.1. Ghana
- 5.2. Ivory Coast
- 5.3. Nigeria
- 5.4. Cote D'lvoire
- 5.5. Cameroon
-
6. North America
- 6.1. United States
- 6.2. Canada
-
7. Europe
- 7.1. Germany
- 7.2. Netherland
- 7.3. United Kingdom
- 7.4. France
- 7.5. Belgium
- 7.6. Russia
-
8. Asia-Pacific
- 8.1. India
- 8.2. Malaysia
- 8.3. Indonesia
- 8.4. Singapore
- 8.5. Japan
-
9. South America
- 9.1. Brazil
- 9.2. Ecuador
-
10. Africa
- 10.1. Ghana
- 10.2. Ivory Coast
- 10.3. Nigeria
- 10.4. Cote D'lvoire
- 10.5. Cameroon
Cocoa Beans Industry Segmentation By Geography
-
1. North America
- 1.1. United States
- 1.2. Canada
- 1.3. Mexico
-
2. South America
- 2.1. Brazil
- 2.2. Argentina
- 2.3. Rest of South America
-
3. Europe
- 3.1. United Kingdom
- 3.2. Germany
- 3.3. France
- 3.4. Italy
- 3.5. Spain
- 3.6. Russia
- 3.7. Benelux
- 3.8. Nordics
- 3.9. Rest of Europe
-
4. Middle East & Africa
- 4.1. Turkey
- 4.2. Israel
- 4.3. GCC
- 4.4. North Africa
- 4.5. South Africa
- 4.6. Rest of Middle East & Africa
-
5. Asia Pacific
- 5.1. China
- 5.2. India
- 5.3. Japan
- 5.4. South Korea
- 5.5. ASEAN
- 5.6. Oceania
- 5.7. Rest of Asia Pacific
Cocoa Beans Industry Regional Market Share
Geographic Coverage of Cocoa Beans Industry
Cocoa Beans Industry REPORT HIGHLIGHTS
| Aspects | Details |
|---|---|
| Study Period | 2020-2034 |
| Base Year | 2025 |
| Estimated Year | 2026 |
| Forecast Period | 2026-2034 |
| Historical Period | 2020-2025 |
| Growth Rate | CAGR of 6.81% from 2020-2034 |
| Segmentation |
|
Table of Contents
- 1. Introduction
- 1.1. Research Scope
- 1.2. Market Segmentation
- 1.3. Research Methodology
- 1.4. Definitions and Assumptions
- 2. Executive Summary
- 2.1. Introduction
- 3. Market Dynamics
- 3.1. Introduction
- 3.2. Market Drivers
- 3.2.1. Increasing Demand for Indian Rice; Enhancing Production Capacities; Increasing Government Initiatives
- 3.3. Market Restrains
- 3.3.1. Abiotic and Biotic Stresses in Rice Cultivation; High Market Entry Costs
- 3.4. Market Trends
- 3.4.1. Wide Application of Cocoa in Different End-user Industries
- 4. Market Factor Analysis
- 4.1. Porters Five Forces
- 4.2. Supply/Value Chain
- 4.3. PESTEL analysis
- 4.4. Market Entropy
- 4.5. Patent/Trademark Analysis
- 5. Global Cocoa Beans Industry Analysis, Insights and Forecast, 2020-2032
- 5.1. Market Analysis, Insights and Forecast - by North America
- 5.1.1. United States
- 5.1.2. Canada
- 5.2. Market Analysis, Insights and Forecast - by Europe
- 5.2.1. Germany
- 5.2.2. Netherland
- 5.2.3. United Kingdom
- 5.2.4. France
- 5.2.5. Belgium
- 5.2.6. Russia
- 5.3. Market Analysis, Insights and Forecast - by Asia-Pacific
- 5.3.1. India
- 5.3.2. Malaysia
- 5.3.3. Indonesia
- 5.3.4. Singapore
- 5.3.5. Japan
- 5.4. Market Analysis, Insights and Forecast - by South America
- 5.4.1. Brazil
- 5.4.2. Ecuador
- 5.5. Market Analysis, Insights and Forecast - by Africa
- 5.5.1. Ghana
- 5.5.2. Ivory Coast
- 5.5.3. Nigeria
- 5.5.4. Cote D'lvoire
- 5.5.5. Cameroon
- 5.6. Market Analysis, Insights and Forecast - by North America
- 5.6.1. United States
- 5.6.2. Canada
- 5.7. Market Analysis, Insights and Forecast - by Europe
- 5.7.1. Germany
- 5.7.2. Netherland
- 5.7.3. United Kingdom
- 5.7.4. France
- 5.7.5. Belgium
- 5.7.6. Russia
- 5.8. Market Analysis, Insights and Forecast - by Asia-Pacific
- 5.8.1. India
- 5.8.2. Malaysia
- 5.8.3. Indonesia
- 5.8.4. Singapore
- 5.8.5. Japan
- 5.9. Market Analysis, Insights and Forecast - by South America
- 5.9.1. Brazil
- 5.9.2. Ecuador
- 5.10. Market Analysis, Insights and Forecast - by Africa
- 5.10.1. Ghana
- 5.10.2. Ivory Coast
- 5.10.3. Nigeria
- 5.10.4. Cote D'lvoire
- 5.10.5. Cameroon
- 5.11. Market Analysis, Insights and Forecast - by Region
- 5.11.1. North America
- 5.11.2. South America
- 5.11.3. Europe
- 5.11.4. Middle East & Africa
- 5.11.5. Asia Pacific
- 5.1. Market Analysis, Insights and Forecast - by North America
- 6. North America Cocoa Beans Industry Analysis, Insights and Forecast, 2020-2032
- 6.1. Market Analysis, Insights and Forecast - by North America
- 6.1.1. United States
- 6.1.2. Canada
- 6.2. Market Analysis, Insights and Forecast - by Europe
- 6.2.1. Germany
- 6.2.2. Netherland
- 6.2.3. United Kingdom
- 6.2.4. France
- 6.2.5. Belgium
- 6.2.6. Russia
- 6.3. Market Analysis, Insights and Forecast - by Asia-Pacific
- 6.3.1. India
- 6.3.2. Malaysia
- 6.3.3. Indonesia
- 6.3.4. Singapore
- 6.3.5. Japan
- 6.4. Market Analysis, Insights and Forecast - by South America
- 6.4.1. Brazil
- 6.4.2. Ecuador
- 6.5. Market Analysis, Insights and Forecast - by Africa
- 6.5.1. Ghana
- 6.5.2. Ivory Coast
- 6.5.3. Nigeria
- 6.5.4. Cote D'lvoire
- 6.5.5. Cameroon
- 6.6. Market Analysis, Insights and Forecast - by North America
- 6.6.1. United States
- 6.6.2. Canada
- 6.7. Market Analysis, Insights and Forecast - by Europe
- 6.7.1. Germany
- 6.7.2. Netherland
- 6.7.3. United Kingdom
- 6.7.4. France
- 6.7.5. Belgium
- 6.7.6. Russia
- 6.8. Market Analysis, Insights and Forecast - by Asia-Pacific
- 6.8.1. India
- 6.8.2. Malaysia
- 6.8.3. Indonesia
- 6.8.4. Singapore
- 6.8.5. Japan
- 6.9. Market Analysis, Insights and Forecast - by South America
- 6.9.1. Brazil
- 6.9.2. Ecuador
- 6.10. Market Analysis, Insights and Forecast - by Africa
- 6.10.1. Ghana
- 6.10.2. Ivory Coast
- 6.10.3. Nigeria
- 6.10.4. Cote D'lvoire
- 6.10.5. Cameroon
- 6.1. Market Analysis, Insights and Forecast - by North America
- 7. South America Cocoa Beans Industry Analysis, Insights and Forecast, 2020-2032
- 7.1. Market Analysis, Insights and Forecast - by North America
- 7.1.1. United States
- 7.1.2. Canada
- 7.2. Market Analysis, Insights and Forecast - by Europe
- 7.2.1. Germany
- 7.2.2. Netherland
- 7.2.3. United Kingdom
- 7.2.4. France
- 7.2.5. Belgium
- 7.2.6. Russia
- 7.3. Market Analysis, Insights and Forecast - by Asia-Pacific
- 7.3.1. India
- 7.3.2. Malaysia
- 7.3.3. Indonesia
- 7.3.4. Singapore
- 7.3.5. Japan
- 7.4. Market Analysis, Insights and Forecast - by South America
- 7.4.1. Brazil
- 7.4.2. Ecuador
- 7.5. Market Analysis, Insights and Forecast - by Africa
- 7.5.1. Ghana
- 7.5.2. Ivory Coast
- 7.5.3. Nigeria
- 7.5.4. Cote D'lvoire
- 7.5.5. Cameroon
- 7.6. Market Analysis, Insights and Forecast - by North America
- 7.6.1. United States
- 7.6.2. Canada
- 7.7. Market Analysis, Insights and Forecast - by Europe
- 7.7.1. Germany
- 7.7.2. Netherland
- 7.7.3. United Kingdom
- 7.7.4. France
- 7.7.5. Belgium
- 7.7.6. Russia
- 7.8. Market Analysis, Insights and Forecast - by Asia-Pacific
- 7.8.1. India
- 7.8.2. Malaysia
- 7.8.3. Indonesia
- 7.8.4. Singapore
- 7.8.5. Japan
- 7.9. Market Analysis, Insights and Forecast - by South America
- 7.9.1. Brazil
- 7.9.2. Ecuador
- 7.10. Market Analysis, Insights and Forecast - by Africa
- 7.10.1. Ghana
- 7.10.2. Ivory Coast
- 7.10.3. Nigeria
- 7.10.4. Cote D'lvoire
- 7.10.5. Cameroon
- 7.1. Market Analysis, Insights and Forecast - by North America
- 8. Europe Cocoa Beans Industry Analysis, Insights and Forecast, 2020-2032
- 8.1. Market Analysis, Insights and Forecast - by North America
- 8.1.1. United States
- 8.1.2. Canada
- 8.2. Market Analysis, Insights and Forecast - by Europe
- 8.2.1. Germany
- 8.2.2. Netherland
- 8.2.3. United Kingdom
- 8.2.4. France
- 8.2.5. Belgium
- 8.2.6. Russia
- 8.3. Market Analysis, Insights and Forecast - by Asia-Pacific
- 8.3.1. India
- 8.3.2. Malaysia
- 8.3.3. Indonesia
- 8.3.4. Singapore
- 8.3.5. Japan
- 8.4. Market Analysis, Insights and Forecast - by South America
- 8.4.1. Brazil
- 8.4.2. Ecuador
- 8.5. Market Analysis, Insights and Forecast - by Africa
- 8.5.1. Ghana
- 8.5.2. Ivory Coast
- 8.5.3. Nigeria
- 8.5.4. Cote D'lvoire
- 8.5.5. Cameroon
- 8.6. Market Analysis, Insights and Forecast - by North America
- 8.6.1. United States
- 8.6.2. Canada
- 8.7. Market Analysis, Insights and Forecast - by Europe
- 8.7.1. Germany
- 8.7.2. Netherland
- 8.7.3. United Kingdom
- 8.7.4. France
- 8.7.5. Belgium
- 8.7.6. Russia
- 8.8. Market Analysis, Insights and Forecast - by Asia-Pacific
- 8.8.1. India
- 8.8.2. Malaysia
- 8.8.3. Indonesia
- 8.8.4. Singapore
- 8.8.5. Japan
- 8.9. Market Analysis, Insights and Forecast - by South America
- 8.9.1. Brazil
- 8.9.2. Ecuador
- 8.10. Market Analysis, Insights and Forecast - by Africa
- 8.10.1. Ghana
- 8.10.2. Ivory Coast
- 8.10.3. Nigeria
- 8.10.4. Cote D'lvoire
- 8.10.5. Cameroon
- 8.1. Market Analysis, Insights and Forecast - by North America
- 9. Middle East & Africa Cocoa Beans Industry Analysis, Insights and Forecast, 2020-2032
- 9.1. Market Analysis, Insights and Forecast - by North America
- 9.1.1. United States
- 9.1.2. Canada
- 9.2. Market Analysis, Insights and Forecast - by Europe
- 9.2.1. Germany
- 9.2.2. Netherland
- 9.2.3. United Kingdom
- 9.2.4. France
- 9.2.5. Belgium
- 9.2.6. Russia
- 9.3. Market Analysis, Insights and Forecast - by Asia-Pacific
- 9.3.1. India
- 9.3.2. Malaysia
- 9.3.3. Indonesia
- 9.3.4. Singapore
- 9.3.5. Japan
- 9.4. Market Analysis, Insights and Forecast - by South America
- 9.4.1. Brazil
- 9.4.2. Ecuador
- 9.5. Market Analysis, Insights and Forecast - by Africa
- 9.5.1. Ghana
- 9.5.2. Ivory Coast
- 9.5.3. Nigeria
- 9.5.4. Cote D'lvoire
- 9.5.5. Cameroon
- 9.6. Market Analysis, Insights and Forecast - by North America
- 9.6.1. United States
- 9.6.2. Canada
- 9.7. Market Analysis, Insights and Forecast - by Europe
- 9.7.1. Germany
- 9.7.2. Netherland
- 9.7.3. United Kingdom
- 9.7.4. France
- 9.7.5. Belgium
- 9.7.6. Russia
- 9.8. Market Analysis, Insights and Forecast - by Asia-Pacific
- 9.8.1. India
- 9.8.2. Malaysia
- 9.8.3. Indonesia
- 9.8.4. Singapore
- 9.8.5. Japan
- 9.9. Market Analysis, Insights and Forecast - by South America
- 9.9.1. Brazil
- 9.9.2. Ecuador
- 9.10. Market Analysis, Insights and Forecast - by Africa
- 9.10.1. Ghana
- 9.10.2. Ivory Coast
- 9.10.3. Nigeria
- 9.10.4. Cote D'lvoire
- 9.10.5. Cameroon
- 9.1. Market Analysis, Insights and Forecast - by North America
- 10. Asia Pacific Cocoa Beans Industry Analysis, Insights and Forecast, 2020-2032
- 10.1. Market Analysis, Insights and Forecast - by North America
- 10.1.1. United States
- 10.1.2. Canada
- 10.2. Market Analysis, Insights and Forecast - by Europe
- 10.2.1. Germany
- 10.2.2. Netherland
- 10.2.3. United Kingdom
- 10.2.4. France
- 10.2.5. Belgium
- 10.2.6. Russia
- 10.3. Market Analysis, Insights and Forecast - by Asia-Pacific
- 10.3.1. India
- 10.3.2. Malaysia
- 10.3.3. Indonesia
- 10.3.4. Singapore
- 10.3.5. Japan
- 10.4. Market Analysis, Insights and Forecast - by South America
- 10.4.1. Brazil
- 10.4.2. Ecuador
- 10.5. Market Analysis, Insights and Forecast - by Africa
- 10.5.1. Ghana
- 10.5.2. Ivory Coast
- 10.5.3. Nigeria
- 10.5.4. Cote D'lvoire
- 10.5.5. Cameroon
- 10.6. Market Analysis, Insights and Forecast - by North America
- 10.6.1. United States
- 10.6.2. Canada
- 10.7. Market Analysis, Insights and Forecast - by Europe
- 10.7.1. Germany
- 10.7.2. Netherland
- 10.7.3. United Kingdom
- 10.7.4. France
- 10.7.5. Belgium
- 10.7.6. Russia
- 10.8. Market Analysis, Insights and Forecast - by Asia-Pacific
- 10.8.1. India
- 10.8.2. Malaysia
- 10.8.3. Indonesia
- 10.8.4. Singapore
- 10.8.5. Japan
- 10.9. Market Analysis, Insights and Forecast - by South America
- 10.9.1. Brazil
- 10.9.2. Ecuador
- 10.10. Market Analysis, Insights and Forecast - by Africa
- 10.10.1. Ghana
- 10.10.2. Ivory Coast
- 10.10.3. Nigeria
- 10.10.4. Cote D'lvoire
- 10.10.5. Cameroon
- 10.1. Market Analysis, Insights and Forecast - by North America
- 11. Competitive Analysis
- 11.1. Global Market Share Analysis 2025
- 11.2. Company Profiles
- 11.2.1 Cargill
- 11.2.1.1. Overview
- 11.2.1.2. Products
- 11.2.1.3. SWOT Analysis
- 11.2.1.4. Recent Developments
- 11.2.1.5. Financials (Based on Availability)
- 11.2.2 Mars
- 11.2.2.1. Overview
- 11.2.2.2. Products
- 11.2.2.3. SWOT Analysis
- 11.2.2.4. Recent Developments
- 11.2.2.5. Financials (Based on Availability)
- 11.2.3 Mondelez International
- 11.2.3.1. Overview
- 11.2.3.2. Products
- 11.2.3.3. SWOT Analysis
- 11.2.3.4. Recent Developments
- 11.2.3.5. Financials (Based on Availability)
- 11.2.4 Olam International
- 11.2.4.1. Overview
- 11.2.4.2. Products
- 11.2.4.3. SWOT Analysis
- 11.2.4.4. Recent Developments
- 11.2.4.5. Financials (Based on Availability)
- 11.2.5 Barry Callebaut
- 11.2.5.1. Overview
- 11.2.5.2. Products
- 11.2.5.3. SWOT Analysis
- 11.2.5.4. Recent Developments
- 11.2.5.5. Financials (Based on Availability)
- 11.2.1 Cargill
List of Figures
- Figure 1: Global Cocoa Beans Industry Revenue Breakdown (Million, %) by Region 2025 & 2033
- Figure 2: North America Cocoa Beans Industry Revenue (Million), by North America 2025 & 2033
- Figure 3: North America Cocoa Beans Industry Revenue Share (%), by North America 2025 & 2033
- Figure 4: North America Cocoa Beans Industry Revenue (Million), by Europe 2025 & 2033
- Figure 5: North America Cocoa Beans Industry Revenue Share (%), by Europe 2025 & 2033
- Figure 6: North America Cocoa Beans Industry Revenue (Million), by Asia-Pacific 2025 & 2033
- Figure 7: North America Cocoa Beans Industry Revenue Share (%), by Asia-Pacific 2025 & 2033
- Figure 8: North America Cocoa Beans Industry Revenue (Million), by South America 2025 & 2033
- Figure 9: North America Cocoa Beans Industry Revenue Share (%), by South America 2025 & 2033
- Figure 10: North America Cocoa Beans Industry Revenue (Million), by Africa 2025 & 2033
- Figure 11: North America Cocoa Beans Industry Revenue Share (%), by Africa 2025 & 2033
- Figure 12: North America Cocoa Beans Industry Revenue (Million), by North America 2025 & 2033
- Figure 13: North America Cocoa Beans Industry Revenue Share (%), by North America 2025 & 2033
- Figure 14: North America Cocoa Beans Industry Revenue (Million), by Europe 2025 & 2033
- Figure 15: North America Cocoa Beans Industry Revenue Share (%), by Europe 2025 & 2033
- Figure 16: North America Cocoa Beans Industry Revenue (Million), by Asia-Pacific 2025 & 2033
- Figure 17: North America Cocoa Beans Industry Revenue Share (%), by Asia-Pacific 2025 & 2033
- Figure 18: North America Cocoa Beans Industry Revenue (Million), by South America 2025 & 2033
- Figure 19: North America Cocoa Beans Industry Revenue Share (%), by South America 2025 & 2033
- Figure 20: North America Cocoa Beans Industry Revenue (Million), by Africa 2025 & 2033
- Figure 21: North America Cocoa Beans Industry Revenue Share (%), by Africa 2025 & 2033
- Figure 22: North America Cocoa Beans Industry Revenue (Million), by Country 2025 & 2033
- Figure 23: North America Cocoa Beans Industry Revenue Share (%), by Country 2025 & 2033
- Figure 24: South America Cocoa Beans Industry Revenue (Million), by North America 2025 & 2033
- Figure 25: South America Cocoa Beans Industry Revenue Share (%), by North America 2025 & 2033
- Figure 26: South America Cocoa Beans Industry Revenue (Million), by Europe 2025 & 2033
- Figure 27: South America Cocoa Beans Industry Revenue Share (%), by Europe 2025 & 2033
- Figure 28: South America Cocoa Beans Industry Revenue (Million), by Asia-Pacific 2025 & 2033
- Figure 29: South America Cocoa Beans Industry Revenue Share (%), by Asia-Pacific 2025 & 2033
- Figure 30: South America Cocoa Beans Industry Revenue (Million), by South America 2025 & 2033
- Figure 31: South America Cocoa Beans Industry Revenue Share (%), by South America 2025 & 2033
- Figure 32: South America Cocoa Beans Industry Revenue (Million), by Africa 2025 & 2033
- Figure 33: South America Cocoa Beans Industry Revenue Share (%), by Africa 2025 & 2033
- Figure 34: South America Cocoa Beans Industry Revenue (Million), by North America 2025 & 2033
- Figure 35: South America Cocoa Beans Industry Revenue Share (%), by North America 2025 & 2033
- Figure 36: South America Cocoa Beans Industry Revenue (Million), by Europe 2025 & 2033
- Figure 37: South America Cocoa Beans Industry Revenue Share (%), by Europe 2025 & 2033
- Figure 38: South America Cocoa Beans Industry Revenue (Million), by Asia-Pacific 2025 & 2033
- Figure 39: South America Cocoa Beans Industry Revenue Share (%), by Asia-Pacific 2025 & 2033
- Figure 40: South America Cocoa Beans Industry Revenue (Million), by South America 2025 & 2033
- Figure 41: South America Cocoa Beans Industry Revenue Share (%), by South America 2025 & 2033
- Figure 42: South America Cocoa Beans Industry Revenue (Million), by Africa 2025 & 2033
- Figure 43: South America Cocoa Beans Industry Revenue Share (%), by Africa 2025 & 2033
- Figure 44: South America Cocoa Beans Industry Revenue (Million), by Country 2025 & 2033
- Figure 45: South America Cocoa Beans Industry Revenue Share (%), by Country 2025 & 2033
- Figure 46: Europe Cocoa Beans Industry Revenue (Million), by North America 2025 & 2033
- Figure 47: Europe Cocoa Beans Industry Revenue Share (%), by North America 2025 & 2033
- Figure 48: Europe Cocoa Beans Industry Revenue (Million), by Europe 2025 & 2033
- Figure 49: Europe Cocoa Beans Industry Revenue Share (%), by Europe 2025 & 2033
- Figure 50: Europe Cocoa Beans Industry Revenue (Million), by Asia-Pacific 2025 & 2033
- Figure 51: Europe Cocoa Beans Industry Revenue Share (%), by Asia-Pacific 2025 & 2033
- Figure 52: Europe Cocoa Beans Industry Revenue (Million), by South America 2025 & 2033
- Figure 53: Europe Cocoa Beans Industry Revenue Share (%), by South America 2025 & 2033
- Figure 54: Europe Cocoa Beans Industry Revenue (Million), by Africa 2025 & 2033
- Figure 55: Europe Cocoa Beans Industry Revenue Share (%), by Africa 2025 & 2033
- Figure 56: Europe Cocoa Beans Industry Revenue (Million), by North America 2025 & 2033
- Figure 57: Europe Cocoa Beans Industry Revenue Share (%), by North America 2025 & 2033
- Figure 58: Europe Cocoa Beans Industry Revenue (Million), by Europe 2025 & 2033
- Figure 59: Europe Cocoa Beans Industry Revenue Share (%), by Europe 2025 & 2033
- Figure 60: Europe Cocoa Beans Industry Revenue (Million), by Asia-Pacific 2025 & 2033
- Figure 61: Europe Cocoa Beans Industry Revenue Share (%), by Asia-Pacific 2025 & 2033
- Figure 62: Europe Cocoa Beans Industry Revenue (Million), by South America 2025 & 2033
- Figure 63: Europe Cocoa Beans Industry Revenue Share (%), by South America 2025 & 2033
- Figure 64: Europe Cocoa Beans Industry Revenue (Million), by Africa 2025 & 2033
- Figure 65: Europe Cocoa Beans Industry Revenue Share (%), by Africa 2025 & 2033
- Figure 66: Europe Cocoa Beans Industry Revenue (Million), by Country 2025 & 2033
- Figure 67: Europe Cocoa Beans Industry Revenue Share (%), by Country 2025 & 2033
- Figure 68: Middle East & Africa Cocoa Beans Industry Revenue (Million), by North America 2025 & 2033
- Figure 69: Middle East & Africa Cocoa Beans Industry Revenue Share (%), by North America 2025 & 2033
- Figure 70: Middle East & Africa Cocoa Beans Industry Revenue (Million), by Europe 2025 & 2033
- Figure 71: Middle East & Africa Cocoa Beans Industry Revenue Share (%), by Europe 2025 & 2033
- Figure 72: Middle East & Africa Cocoa Beans Industry Revenue (Million), by Asia-Pacific 2025 & 2033
- Figure 73: Middle East & Africa Cocoa Beans Industry Revenue Share (%), by Asia-Pacific 2025 & 2033
- Figure 74: Middle East & Africa Cocoa Beans Industry Revenue (Million), by South America 2025 & 2033
- Figure 75: Middle East & Africa Cocoa Beans Industry Revenue Share (%), by South America 2025 & 2033
- Figure 76: Middle East & Africa Cocoa Beans Industry Revenue (Million), by Africa 2025 & 2033
- Figure 77: Middle East & Africa Cocoa Beans Industry Revenue Share (%), by Africa 2025 & 2033
- Figure 78: Middle East & Africa Cocoa Beans Industry Revenue (Million), by North America 2025 & 2033
- Figure 79: Middle East & Africa Cocoa Beans Industry Revenue Share (%), by North America 2025 & 2033
- Figure 80: Middle East & Africa Cocoa Beans Industry Revenue (Million), by Europe 2025 & 2033
- Figure 81: Middle East & Africa Cocoa Beans Industry Revenue Share (%), by Europe 2025 & 2033
- Figure 82: Middle East & Africa Cocoa Beans Industry Revenue (Million), by Asia-Pacific 2025 & 2033
- Figure 83: Middle East & Africa Cocoa Beans Industry Revenue Share (%), by Asia-Pacific 2025 & 2033
- Figure 84: Middle East & Africa Cocoa Beans Industry Revenue (Million), by South America 2025 & 2033
- Figure 85: Middle East & Africa Cocoa Beans Industry Revenue Share (%), by South America 2025 & 2033
- Figure 86: Middle East & Africa Cocoa Beans Industry Revenue (Million), by Africa 2025 & 2033
- Figure 87: Middle East & Africa Cocoa Beans Industry Revenue Share (%), by Africa 2025 & 2033
- Figure 88: Middle East & Africa Cocoa Beans Industry Revenue (Million), by Country 2025 & 2033
- Figure 89: Middle East & Africa Cocoa Beans Industry Revenue Share (%), by Country 2025 & 2033
- Figure 90: Asia Pacific Cocoa Beans Industry Revenue (Million), by North America 2025 & 2033
- Figure 91: Asia Pacific Cocoa Beans Industry Revenue Share (%), by North America 2025 & 2033
- Figure 92: Asia Pacific Cocoa Beans Industry Revenue (Million), by Europe 2025 & 2033
- Figure 93: Asia Pacific Cocoa Beans Industry Revenue Share (%), by Europe 2025 & 2033
- Figure 94: Asia Pacific Cocoa Beans Industry Revenue (Million), by Asia-Pacific 2025 & 2033
- Figure 95: Asia Pacific Cocoa Beans Industry Revenue Share (%), by Asia-Pacific 2025 & 2033
- Figure 96: Asia Pacific Cocoa Beans Industry Revenue (Million), by South America 2025 & 2033
- Figure 97: Asia Pacific Cocoa Beans Industry Revenue Share (%), by South America 2025 & 2033
- Figure 98: Asia Pacific Cocoa Beans Industry Revenue (Million), by Africa 2025 & 2033
- Figure 99: Asia Pacific Cocoa Beans Industry Revenue Share (%), by Africa 2025 & 2033
- Figure 100: Asia Pacific Cocoa Beans Industry Revenue (Million), by North America 2025 & 2033
- Figure 101: Asia Pacific Cocoa Beans Industry Revenue Share (%), by North America 2025 & 2033
- Figure 102: Asia Pacific Cocoa Beans Industry Revenue (Million), by Europe 2025 & 2033
- Figure 103: Asia Pacific Cocoa Beans Industry Revenue Share (%), by Europe 2025 & 2033
- Figure 104: Asia Pacific Cocoa Beans Industry Revenue (Million), by Asia-Pacific 2025 & 2033
- Figure 105: Asia Pacific Cocoa Beans Industry Revenue Share (%), by Asia-Pacific 2025 & 2033
- Figure 106: Asia Pacific Cocoa Beans Industry Revenue (Million), by South America 2025 & 2033
- Figure 107: Asia Pacific Cocoa Beans Industry Revenue Share (%), by South America 2025 & 2033
- Figure 108: Asia Pacific Cocoa Beans Industry Revenue (Million), by Africa 2025 & 2033
- Figure 109: Asia Pacific Cocoa Beans Industry Revenue Share (%), by Africa 2025 & 2033
- Figure 110: Asia Pacific Cocoa Beans Industry Revenue (Million), by Country 2025 & 2033
- Figure 111: Asia Pacific Cocoa Beans Industry Revenue Share (%), by Country 2025 & 2033
List of Tables
- Table 1: Global Cocoa Beans Industry Revenue Million Forecast, by North America 2020 & 2033
- Table 2: Global Cocoa Beans Industry Revenue Million Forecast, by Europe 2020 & 2033
- Table 3: Global Cocoa Beans Industry Revenue Million Forecast, by Asia-Pacific 2020 & 2033
- Table 4: Global Cocoa Beans Industry Revenue Million Forecast, by South America 2020 & 2033
- Table 5: Global Cocoa Beans Industry Revenue Million Forecast, by Africa 2020 & 2033
- Table 6: Global Cocoa Beans Industry Revenue Million Forecast, by North America 2020 & 2033
- Table 7: Global Cocoa Beans Industry Revenue Million Forecast, by Europe 2020 & 2033
- Table 8: Global Cocoa Beans Industry Revenue Million Forecast, by Asia-Pacific 2020 & 2033
- Table 9: Global Cocoa Beans Industry Revenue Million Forecast, by South America 2020 & 2033
- Table 10: Global Cocoa Beans Industry Revenue Million Forecast, by Africa 2020 & 2033
- Table 11: Global Cocoa Beans Industry Revenue Million Forecast, by Region 2020 & 2033
- Table 12: Global Cocoa Beans Industry Revenue Million Forecast, by North America 2020 & 2033
- Table 13: Global Cocoa Beans Industry Revenue Million Forecast, by Europe 2020 & 2033
- Table 14: Global Cocoa Beans Industry Revenue Million Forecast, by Asia-Pacific 2020 & 2033
- Table 15: Global Cocoa Beans Industry Revenue Million Forecast, by South America 2020 & 2033
- Table 16: Global Cocoa Beans Industry Revenue Million Forecast, by Africa 2020 & 2033
- Table 17: Global Cocoa Beans Industry Revenue Million Forecast, by North America 2020 & 2033
- Table 18: Global Cocoa Beans Industry Revenue Million Forecast, by Europe 2020 & 2033
- Table 19: Global Cocoa Beans Industry Revenue Million Forecast, by Asia-Pacific 2020 & 2033
- Table 20: Global Cocoa Beans Industry Revenue Million Forecast, by South America 2020 & 2033
- Table 21: Global Cocoa Beans Industry Revenue Million Forecast, by Africa 2020 & 2033
- Table 22: Global Cocoa Beans Industry Revenue Million Forecast, by Country 2020 & 2033
- Table 23: United States Cocoa Beans Industry Revenue (Million) Forecast, by Application 2020 & 2033
- Table 24: Canada Cocoa Beans Industry Revenue (Million) Forecast, by Application 2020 & 2033
- Table 25: Mexico Cocoa Beans Industry Revenue (Million) Forecast, by Application 2020 & 2033
- Table 26: Global Cocoa Beans Industry Revenue Million Forecast, by North America 2020 & 2033
- Table 27: Global Cocoa Beans Industry Revenue Million Forecast, by Europe 2020 & 2033
- Table 28: Global Cocoa Beans Industry Revenue Million Forecast, by Asia-Pacific 2020 & 2033
- Table 29: Global Cocoa Beans Industry Revenue Million Forecast, by South America 2020 & 2033
- Table 30: Global Cocoa Beans Industry Revenue Million Forecast, by Africa 2020 & 2033
- Table 31: Global Cocoa Beans Industry Revenue Million Forecast, by North America 2020 & 2033
- Table 32: Global Cocoa Beans Industry Revenue Million Forecast, by Europe 2020 & 2033
- Table 33: Global Cocoa Beans Industry Revenue Million Forecast, by Asia-Pacific 2020 & 2033
- Table 34: Global Cocoa Beans Industry Revenue Million Forecast, by South America 2020 & 2033
- Table 35: Global Cocoa Beans Industry Revenue Million Forecast, by Africa 2020 & 2033
- Table 36: Global Cocoa Beans Industry Revenue Million Forecast, by Country 2020 & 2033
- Table 37: Brazil Cocoa Beans Industry Revenue (Million) Forecast, by Application 2020 & 2033
- Table 38: Argentina Cocoa Beans Industry Revenue (Million) Forecast, by Application 2020 & 2033
- Table 39: Rest of South America Cocoa Beans Industry Revenue (Million) Forecast, by Application 2020 & 2033
- Table 40: Global Cocoa Beans Industry Revenue Million Forecast, by North America 2020 & 2033
- Table 41: Global Cocoa Beans Industry Revenue Million Forecast, by Europe 2020 & 2033
- Table 42: Global Cocoa Beans Industry Revenue Million Forecast, by Asia-Pacific 2020 & 2033
- Table 43: Global Cocoa Beans Industry Revenue Million Forecast, by South America 2020 & 2033
- Table 44: Global Cocoa Beans Industry Revenue Million Forecast, by Africa 2020 & 2033
- Table 45: Global Cocoa Beans Industry Revenue Million Forecast, by North America 2020 & 2033
- Table 46: Global Cocoa Beans Industry Revenue Million Forecast, by Europe 2020 & 2033
- Table 47: Global Cocoa Beans Industry Revenue Million Forecast, by Asia-Pacific 2020 & 2033
- Table 48: Global Cocoa Beans Industry Revenue Million Forecast, by South America 2020 & 2033
- Table 49: Global Cocoa Beans Industry Revenue Million Forecast, by Africa 2020 & 2033
- Table 50: Global Cocoa Beans Industry Revenue Million Forecast, by Country 2020 & 2033
- Table 51: United Kingdom Cocoa Beans Industry Revenue (Million) Forecast, by Application 2020 & 2033
- Table 52: Germany Cocoa Beans Industry Revenue (Million) Forecast, by Application 2020 & 2033
- Table 53: France Cocoa Beans Industry Revenue (Million) Forecast, by Application 2020 & 2033
- Table 54: Italy Cocoa Beans Industry Revenue (Million) Forecast, by Application 2020 & 2033
- Table 55: Spain Cocoa Beans Industry Revenue (Million) Forecast, by Application 2020 & 2033
- Table 56: Russia Cocoa Beans Industry Revenue (Million) Forecast, by Application 2020 & 2033
- Table 57: Benelux Cocoa Beans Industry Revenue (Million) Forecast, by Application 2020 & 2033
- Table 58: Nordics Cocoa Beans Industry Revenue (Million) Forecast, by Application 2020 & 2033
- Table 59: Rest of Europe Cocoa Beans Industry Revenue (Million) Forecast, by Application 2020 & 2033
- Table 60: Global Cocoa Beans Industry Revenue Million Forecast, by North America 2020 & 2033
- Table 61: Global Cocoa Beans Industry Revenue Million Forecast, by Europe 2020 & 2033
- Table 62: Global Cocoa Beans Industry Revenue Million Forecast, by Asia-Pacific 2020 & 2033
- Table 63: Global Cocoa Beans Industry Revenue Million Forecast, by South America 2020 & 2033
- Table 64: Global Cocoa Beans Industry Revenue Million Forecast, by Africa 2020 & 2033
- Table 65: Global Cocoa Beans Industry Revenue Million Forecast, by North America 2020 & 2033
- Table 66: Global Cocoa Beans Industry Revenue Million Forecast, by Europe 2020 & 2033
- Table 67: Global Cocoa Beans Industry Revenue Million Forecast, by Asia-Pacific 2020 & 2033
- Table 68: Global Cocoa Beans Industry Revenue Million Forecast, by South America 2020 & 2033
- Table 69: Global Cocoa Beans Industry Revenue Million Forecast, by Africa 2020 & 2033
- Table 70: Global Cocoa Beans Industry Revenue Million Forecast, by Country 2020 & 2033
- Table 71: Turkey Cocoa Beans Industry Revenue (Million) Forecast, by Application 2020 & 2033
- Table 72: Israel Cocoa Beans Industry Revenue (Million) Forecast, by Application 2020 & 2033
- Table 73: GCC Cocoa Beans Industry Revenue (Million) Forecast, by Application 2020 & 2033
- Table 74: North Africa Cocoa Beans Industry Revenue (Million) Forecast, by Application 2020 & 2033
- Table 75: South Africa Cocoa Beans Industry Revenue (Million) Forecast, by Application 2020 & 2033
- Table 76: Rest of Middle East & Africa Cocoa Beans Industry Revenue (Million) Forecast, by Application 2020 & 2033
- Table 77: Global Cocoa Beans Industry Revenue Million Forecast, by North America 2020 & 2033
- Table 78: Global Cocoa Beans Industry Revenue Million Forecast, by Europe 2020 & 2033
- Table 79: Global Cocoa Beans Industry Revenue Million Forecast, by Asia-Pacific 2020 & 2033
- Table 80: Global Cocoa Beans Industry Revenue Million Forecast, by South America 2020 & 2033
- Table 81: Global Cocoa Beans Industry Revenue Million Forecast, by Africa 2020 & 2033
- Table 82: Global Cocoa Beans Industry Revenue Million Forecast, by North America 2020 & 2033
- Table 83: Global Cocoa Beans Industry Revenue Million Forecast, by Europe 2020 & 2033
- Table 84: Global Cocoa Beans Industry Revenue Million Forecast, by Asia-Pacific 2020 & 2033
- Table 85: Global Cocoa Beans Industry Revenue Million Forecast, by South America 2020 & 2033
- Table 86: Global Cocoa Beans Industry Revenue Million Forecast, by Africa 2020 & 2033
- Table 87: Global Cocoa Beans Industry Revenue Million Forecast, by Country 2020 & 2033
- Table 88: China Cocoa Beans Industry Revenue (Million) Forecast, by Application 2020 & 2033
- Table 89: India Cocoa Beans Industry Revenue (Million) Forecast, by Application 2020 & 2033
- Table 90: Japan Cocoa Beans Industry Revenue (Million) Forecast, by Application 2020 & 2033
- Table 91: South Korea Cocoa Beans Industry Revenue (Million) Forecast, by Application 2020 & 2033
- Table 92: ASEAN Cocoa Beans Industry Revenue (Million) Forecast, by Application 2020 & 2033
- Table 93: Oceania Cocoa Beans Industry Revenue (Million) Forecast, by Application 2020 & 2033
- Table 94: Rest of Asia Pacific Cocoa Beans Industry Revenue (Million) Forecast, by Application 2020 & 2033
Frequently Asked Questions
1. What is the projected Compound Annual Growth Rate (CAGR) of the Cocoa Beans Industry?
The projected CAGR is approximately 6.81%.
2. Which companies are prominent players in the Cocoa Beans Industry?
Key companies in the market include Cargill , Mars, Mondelez International , Olam International , Barry Callebaut.
3. What are the main segments of the Cocoa Beans Industry?
The market segments include North America, Europe, Asia-Pacific, South America, Africa, North America, Europe, Asia-Pacific, South America, Africa.
4. Can you provide details about the market size?
The market size is estimated to be USD 17.24 Million as of 2022.
5. What are some drivers contributing to market growth?
Increasing Demand for Indian Rice; Enhancing Production Capacities; Increasing Government Initiatives.
6. What are the notable trends driving market growth?
Wide Application of Cocoa in Different End-user Industries.
7. Are there any restraints impacting market growth?
Abiotic and Biotic Stresses in Rice Cultivation; High Market Entry Costs.
8. Can you provide examples of recent developments in the market?
October 2022: The European Union and its partners have collectively planned to raise 450 million euros (USD442 million) to support Ivory Coast's push to tackle child labor and deforestation linked to cocoa production.
9. What pricing options are available for accessing the report?
Pricing options include single-user, multi-user, and enterprise licenses priced at USD 4750, USD 5250, and USD 8750 respectively.
10. Is the market size provided in terms of value or volume?
The market size is provided in terms of value, measured in Million.
11. Are there any specific market keywords associated with the report?
Yes, the market keyword associated with the report is "Cocoa Beans Industry," which aids in identifying and referencing the specific market segment covered.
12. How do I determine which pricing option suits my needs best?
The pricing options vary based on user requirements and access needs. Individual users may opt for single-user licenses, while businesses requiring broader access may choose multi-user or enterprise licenses for cost-effective access to the report.
13. Are there any additional resources or data provided in the Cocoa Beans Industry report?
While the report offers comprehensive insights, it's advisable to review the specific contents or supplementary materials provided to ascertain if additional resources or data are available.
14. How can I stay updated on further developments or reports in the Cocoa Beans Industry?
To stay informed about further developments, trends, and reports in the Cocoa Beans Industry, consider subscribing to industry newsletters, following relevant companies and organizations, or regularly checking reputable industry news sources and publications.
Methodology
Step 1 - Identification of Relevant Samples Size from Population Database


Step 2 - Approaches for Defining Global Market Size (Value, Volume* & Price*)

Note*: In applicable scenarios
Step 3 - Data Sources
Primary Research
- Web Analytics
- Survey Reports
- Research Institute
- Latest Research Reports
- Opinion Leaders
Secondary Research
- Annual Reports
- White Paper
- Latest Press Release
- Industry Association
- Paid Database
- Investor Presentations

Step 4 - Data Triangulation
Involves using different sources of information in order to increase the validity of a study
These sources are likely to be stakeholders in a program - participants, other researchers, program staff, other community members, and so on.
Then we put all data in single framework & apply various statistical tools to find out the dynamic on the market.
During the analysis stage, feedback from the stakeholder groups would be compared to determine areas of agreement as well as areas of divergence