

Key Insights
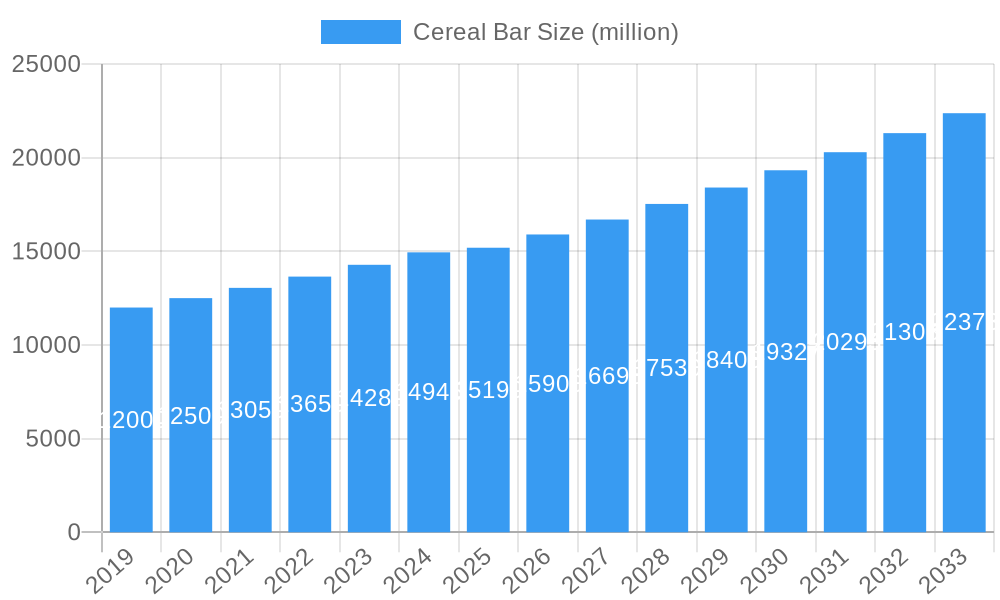
The global Cereal Bar market is projected for substantial expansion, anticipated to reach $24.5 billion by 2025. This growth is fueled by evolving consumer lifestyles and a rising demand for convenient, nutritious on-the-go options. The market is experiencing a strong Compound Annual Growth Rate (CAGR) of 7.4%, driven by increasing health and wellness awareness. Consumers are actively seeking snack alternatives that provide nutritional value, with energy and nutrition bars showing escalating demand for sustained energy throughout the day. Enhanced distribution through supermarkets and hypermarkets, coupled with continuous product innovation, is expanding accessibility and appeal across diverse demographics, including emerging economies.
Cereal Bar Market Size (In Billion)
While the outlook is positive, the market confronts challenges such as intense competition and the need for constant product differentiation in flavors, ingredients, and packaging. Fluctuating raw material costs may also influence pricing strategies. Nevertheless, the overarching trend towards healthier snacking and the inherent convenience of cereal bars are expected to mitigate these challenges, fostering robust industry growth. The Asia Pacific region is anticipated to be a key growth driver due to a growing middle class and increasing adoption of global dietary trends.
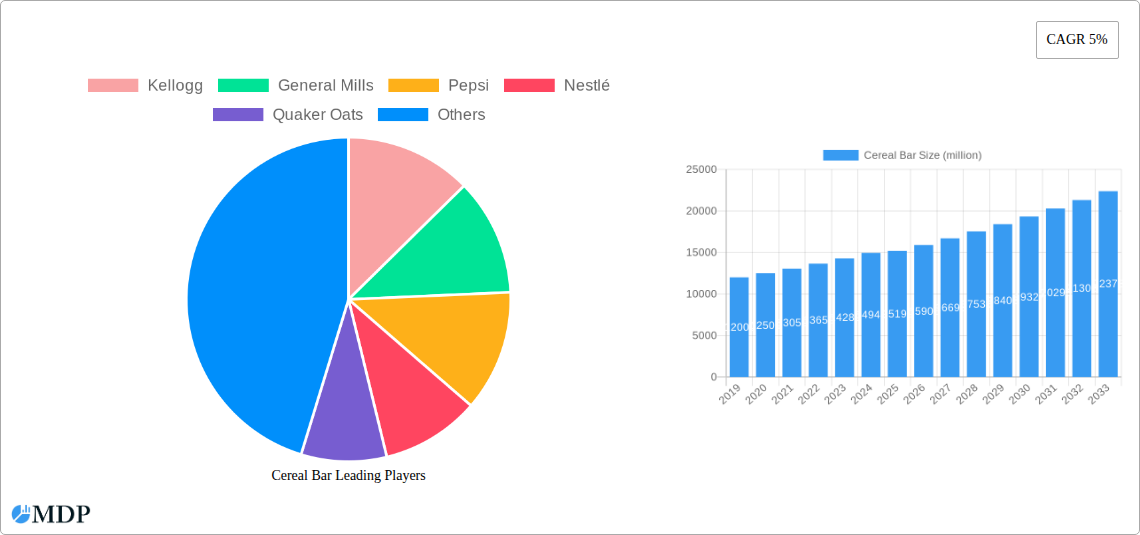
Cereal Bar Company Market Share
This report provides a comprehensive analysis of the global Cereal Bar market, offering strategic insights for industry participants. Covering the period from 2019 to 2033, with 2025 as the base year and a forecast period from 2025 to 2033, it examines market dynamics, key trends, leading segments, product advancements, growth catalysts, obstacles, emerging prospects, and the competitive environment.
Cereal Bar Market Dynamics & Concentration
The global Cereal Bar market exhibits a moderate to high level of concentration, with key players like Kellogg, General Mills, Pepsi, Nestlé, Quaker Oats, Atkins Nutritionals, and Mckee holding significant market share, estimated to be over 60% collectively. Innovation remains a primary driver, fueled by the increasing consumer demand for convenient, healthy, and functional snack options. Regulatory frameworks, particularly those concerning food labeling, nutritional content, and ingredient sourcing, continue to shape market entry and product development. The threat of product substitutes, ranging from other snack bars to fresh fruit and yogurt, necessitates continuous product differentiation and value proposition enhancement. End-user trends are strongly influenced by health and wellness consciousness, with a growing preference for plant-based, gluten-free, and low-sugar options. Mergers and acquisitions (M&A) activity, while not exceptionally high, plays a strategic role in consolidating market share and expanding product portfolios. Over the Historical Period (2019-2024), an estimated 50 M&A deals were recorded, impacting market concentration and innovation trajectories.
Cereal Bar Industry Trends & Analysis
The global cereal bar market is experiencing robust growth, projected to expand at a Compound Annual Growth Rate (CAGR) of approximately 6.5% during the forecast period. This expansion is primarily driven by evolving consumer lifestyles, increased disposable incomes in emerging economies, and a growing awareness of the health benefits associated with nutritious snack options. Technological advancements in food processing and ingredient formulation are enabling the development of innovative products with enhanced nutritional profiles and appealing textures. The rise of e-commerce and direct-to-consumer (DTC) channels is significantly increasing market penetration, allowing brands to reach a wider audience and gather valuable consumer data.
Consumer preferences are shifting towards functional ingredients, such as added protein, fiber, and vitamins, catering to the demand for energy-boosting and performance-enhancing snacks. The "on-the-go" consumption trend continues to be a dominant force, making cereal bars an ideal solution for busy lifestyles. The competitive landscape is characterized by intense brand rivalry, with companies focusing on product diversification, attractive packaging, and targeted marketing campaigns. Sustainability is also emerging as a significant trend, with consumers increasingly favoring brands that demonstrate environmental responsibility in their sourcing and packaging. The market penetration of cereal bars is estimated to reach over 70% in developed regions by the end of the forecast period.
Leading Markets & Segments in Cereal Bar
Supermarkets and Hypermarkets represent the dominant distribution channel for cereal bars, accounting for an estimated 55% of the market share. This dominance is attributed to the high foot traffic, wide product assortment, and convenient shopping experience these retail formats offer. Department Stores, while a smaller segment, contribute significantly to the market, particularly for premium and specialty cereal bars, representing about 20% of sales. The "Others" category, encompassing convenience stores, online retailers, and direct-to-consumer platforms, is experiencing rapid growth, driven by the increasing adoption of online shopping and the demand for immediate access to snacks, holding approximately 25% of the market.
In terms of product type, Snack Bars command the largest market share, estimated at over 60%, due to their versatility and broad appeal as an everyday indulgence and quick energy source. Energy Nutrition Bars follow closely, capturing around 30% of the market, driven by their association with athletic performance and the health and fitness trend. Other Bars, including breakfast bars and specialized dietary bars, represent the remaining 10% but are showing promising growth potential. Economic policies, such as trade agreements and consumer spending patterns, significantly influence regional market performance. Infrastructure development, particularly in logistics and supply chain management, plays a crucial role in ensuring the availability and affordability of cereal bars across different geographies.
Cereal Bar Product Developments
Product innovation in the cereal bar sector is characterized by a strong emphasis on health-conscious formulations, incorporating superfoods, plant-based proteins, and natural sweeteners. Manufacturers are actively developing gluten-free, vegan, and low-sugar variants to cater to diverse dietary needs and preferences. Technological advancements in extrusion and binding processes are enabling the creation of bars with improved textures, extended shelf life, and enhanced nutritional delivery. Competitive advantages are being carved out through unique flavor profiles, functional ingredient combinations, and visually appealing packaging that highlights health benefits and ethical sourcing.
Key Drivers of Cereal Bar Growth
Several key factors are propelling the growth of the cereal bar market. The escalating global demand for convenient and healthy snack options, driven by busy lifestyles and increased health consciousness, is a primary catalyst. Technological advancements in food science are enabling the development of bars with improved nutritional profiles and functional benefits. Supportive government initiatives and evolving dietary guidelines that promote healthier snacking habits also contribute to market expansion. Furthermore, the growing disposable income in emerging economies is making these convenient snacks more accessible to a larger consumer base, fueling overall market growth.
Challenges in the Cereal Bar Market
Despite the positive growth trajectory, the cereal bar market faces several challenges. Intense competition from a wide array of snack alternatives, including confectionery, baked goods, and fresh produce, puts pressure on market share. Volatility in raw material prices, particularly for grains, nuts, and fruits, can impact production costs and profitability. Increasingly stringent regulatory frameworks concerning ingredient sourcing, labeling, and health claims necessitate ongoing compliance efforts and product reformulation. Consumer perception and the need to clearly communicate health benefits while managing sugar content remain critical hurdles for sustained market success.
Emerging Opportunities in Cereal Bar
Significant opportunities exist for growth in the cereal bar market. The rising demand for plant-based and vegan-friendly products presents a substantial avenue for innovation and market expansion. The integration of functional ingredients, such as probiotics, prebiotics, and adaptogens, to offer targeted health benefits (e.g., gut health, stress relief) is another key growth catalyst. Strategic partnerships with fitness centers, corporate wellness programs, and online health platforms can unlock new consumer segments. Furthermore, capitalizing on the increasing demand for sustainable and ethically sourced products will resonate with a growing environmentally conscious consumer base.
Leading Players in the Cereal Bar Sector
- Kellogg
- General Mills
- Pepsi
- Nestlé
- Quaker Oats
- Atkins Nutritionals
- Mckee
Key Milestones in Cereal Bar Industry
- 2019: Launch of a significant range of plant-based cereal bars by multiple key players, reflecting a growing consumer trend.
- 2020: Increased focus on functional ingredients like protein and fiber in new product formulations.
- 2021: Expansion of online sales channels and direct-to-consumer models by leading manufacturers.
- 2022: Growing consumer demand for low-sugar and natural ingredient cereal bars.
- 2023: Strategic partnerships between cereal bar brands and fitness influencers to promote health and performance benefits.
- 2024: Introduction of innovative packaging solutions emphasizing sustainability and recyclability.
Strategic Outlook for Cereal Bar Market
The strategic outlook for the cereal bar market remains exceptionally positive, driven by the enduring consumer preference for convenient and healthy snacking. Future growth will be accelerated by continuous product innovation, particularly in the areas of plant-based formulations and functional ingredient integration. Companies that effectively leverage digital marketing and e-commerce channels to enhance customer engagement and reach new demographics will gain a competitive edge. Strategic collaborations and potential acquisitions will continue to shape the market landscape, fostering innovation and expanding market reach. The sustained focus on health, wellness, and sustainability will be paramount for long-term success in this dynamic sector.
Cereal Bar Segmentation
-
1. Application
- 1.1. Department Stores
- 1.2. Supermarkets and Hypermarkets
- 1.3. Others
-
2. Type
- 2.1. Snack Bars
- 2.2. Energy Nutrition Bars
- 2.3. Other Bars
Cereal Bar Segmentation By Geography
-
1. North America
- 1.1. United States
- 1.2. Canada
- 1.3. Mexico
-
2. South America
- 2.1. Brazil
- 2.2. Argentina
- 2.3. Rest of South America
-
3. Europe
- 3.1. United Kingdom
- 3.2. Germany
- 3.3. France
- 3.4. Italy
- 3.5. Spain
- 3.6. Russia
- 3.7. Benelux
- 3.8. Nordics
- 3.9. Rest of Europe
-
4. Middle East & Africa
- 4.1. Turkey
- 4.2. Israel
- 4.3. GCC
- 4.4. North Africa
- 4.5. South Africa
- 4.6. Rest of Middle East & Africa
-
5. Asia Pacific
- 5.1. China
- 5.2. India
- 5.3. Japan
- 5.4. South Korea
- 5.5. ASEAN
- 5.6. Oceania
- 5.7. Rest of Asia Pacific
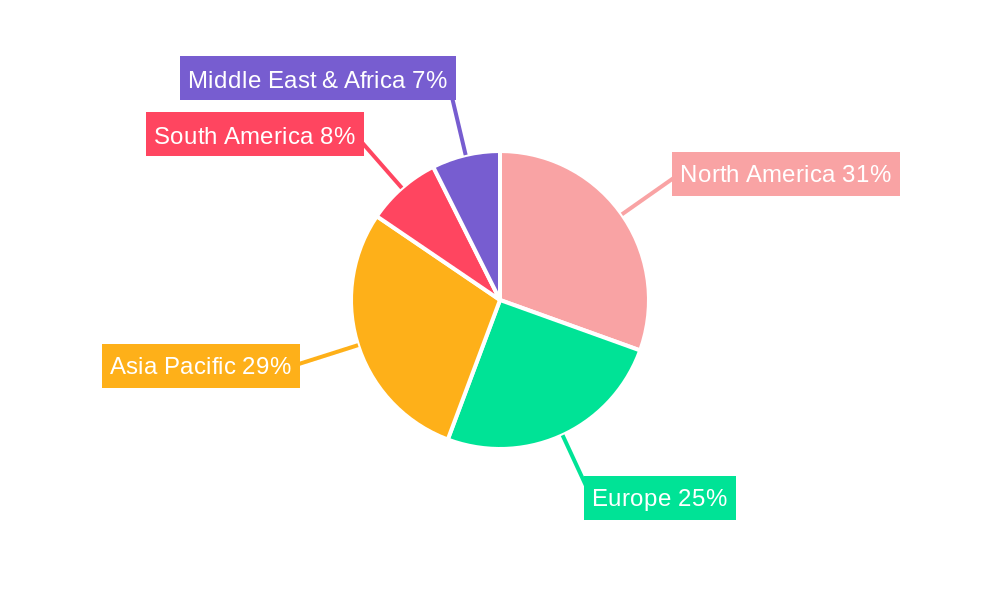
Cereal Bar Regional Market Share
Geographic Coverage of Cereal Bar
Cereal Bar REPORT HIGHLIGHTS
| Aspects | Details |
|---|---|
| Study Period | 2020-2034 |
| Base Year | 2025 |
| Estimated Year | 2026 |
| Forecast Period | 2026-2034 |
| Historical Period | 2020-2025 |
| Growth Rate | CAGR of 7.4% from 2020-2034 |
| Segmentation |
|
Table of Contents
- 1. Introduction
- 1.1. Research Scope
- 1.2. Market Segmentation
- 1.3. Research Methodology
- 1.4. Definitions and Assumptions
- 2. Executive Summary
- 2.1. Introduction
- 3. Market Dynamics
- 3.1. Introduction
- 3.2. Market Drivers
- 3.3. Market Restrains
- 3.4. Market Trends
- 4. Market Factor Analysis
- 4.1. Porters Five Forces
- 4.2. Supply/Value Chain
- 4.3. PESTEL analysis
- 4.4. Market Entropy
- 4.5. Patent/Trademark Analysis
- 5. Global Cereal Bar Analysis, Insights and Forecast, 2020-2032
- 5.1. Market Analysis, Insights and Forecast - by Application
- 5.1.1. Department Stores
- 5.1.2. Supermarkets and Hypermarkets
- 5.1.3. Others
- 5.2. Market Analysis, Insights and Forecast - by Type
- 5.2.1. Snack Bars
- 5.2.2. Energy Nutrition Bars
- 5.2.3. Other Bars
- 5.3. Market Analysis, Insights and Forecast - by Region
- 5.3.1. North America
- 5.3.2. South America
- 5.3.3. Europe
- 5.3.4. Middle East & Africa
- 5.3.5. Asia Pacific
- 5.1. Market Analysis, Insights and Forecast - by Application
- 6. North America Cereal Bar Analysis, Insights and Forecast, 2020-2032
- 6.1. Market Analysis, Insights and Forecast - by Application
- 6.1.1. Department Stores
- 6.1.2. Supermarkets and Hypermarkets
- 6.1.3. Others
- 6.2. Market Analysis, Insights and Forecast - by Type
- 6.2.1. Snack Bars
- 6.2.2. Energy Nutrition Bars
- 6.2.3. Other Bars
- 6.1. Market Analysis, Insights and Forecast - by Application
- 7. South America Cereal Bar Analysis, Insights and Forecast, 2020-2032
- 7.1. Market Analysis, Insights and Forecast - by Application
- 7.1.1. Department Stores
- 7.1.2. Supermarkets and Hypermarkets
- 7.1.3. Others
- 7.2. Market Analysis, Insights and Forecast - by Type
- 7.2.1. Snack Bars
- 7.2.2. Energy Nutrition Bars
- 7.2.3. Other Bars
- 7.1. Market Analysis, Insights and Forecast - by Application
- 8. Europe Cereal Bar Analysis, Insights and Forecast, 2020-2032
- 8.1. Market Analysis, Insights and Forecast - by Application
- 8.1.1. Department Stores
- 8.1.2. Supermarkets and Hypermarkets
- 8.1.3. Others
- 8.2. Market Analysis, Insights and Forecast - by Type
- 8.2.1. Snack Bars
- 8.2.2. Energy Nutrition Bars
- 8.2.3. Other Bars
- 8.1. Market Analysis, Insights and Forecast - by Application
- 9. Middle East & Africa Cereal Bar Analysis, Insights and Forecast, 2020-2032
- 9.1. Market Analysis, Insights and Forecast - by Application
- 9.1.1. Department Stores
- 9.1.2. Supermarkets and Hypermarkets
- 9.1.3. Others
- 9.2. Market Analysis, Insights and Forecast - by Type
- 9.2.1. Snack Bars
- 9.2.2. Energy Nutrition Bars
- 9.2.3. Other Bars
- 9.1. Market Analysis, Insights and Forecast - by Application
- 10. Asia Pacific Cereal Bar Analysis, Insights and Forecast, 2020-2032
- 10.1. Market Analysis, Insights and Forecast - by Application
- 10.1.1. Department Stores
- 10.1.2. Supermarkets and Hypermarkets
- 10.1.3. Others
- 10.2. Market Analysis, Insights and Forecast - by Type
- 10.2.1. Snack Bars
- 10.2.2. Energy Nutrition Bars
- 10.2.3. Other Bars
- 10.1. Market Analysis, Insights and Forecast - by Application
- 11. Competitive Analysis
- 11.1. Global Market Share Analysis 2025
- 11.2. Company Profiles
- 11.2.1 Kellogg
- 11.2.1.1. Overview
- 11.2.1.2. Products
- 11.2.1.3. SWOT Analysis
- 11.2.1.4. Recent Developments
- 11.2.1.5. Financials (Based on Availability)
- 11.2.2 General Mills
- 11.2.2.1. Overview
- 11.2.2.2. Products
- 11.2.2.3. SWOT Analysis
- 11.2.2.4. Recent Developments
- 11.2.2.5. Financials (Based on Availability)
- 11.2.3 Pepsi
- 11.2.3.1. Overview
- 11.2.3.2. Products
- 11.2.3.3. SWOT Analysis
- 11.2.3.4. Recent Developments
- 11.2.3.5. Financials (Based on Availability)
- 11.2.4 Nestlé
- 11.2.4.1. Overview
- 11.2.4.2. Products
- 11.2.4.3. SWOT Analysis
- 11.2.4.4. Recent Developments
- 11.2.4.5. Financials (Based on Availability)
- 11.2.5 Quaker Oats
- 11.2.5.1. Overview
- 11.2.5.2. Products
- 11.2.5.3. SWOT Analysis
- 11.2.5.4. Recent Developments
- 11.2.5.5. Financials (Based on Availability)
- 11.2.6 Atkins Nutritionals
- 11.2.6.1. Overview
- 11.2.6.2. Products
- 11.2.6.3. SWOT Analysis
- 11.2.6.4. Recent Developments
- 11.2.6.5. Financials (Based on Availability)
- 11.2.7 Mckee
- 11.2.7.1. Overview
- 11.2.7.2. Products
- 11.2.7.3. SWOT Analysis
- 11.2.7.4. Recent Developments
- 11.2.7.5. Financials (Based on Availability)
- 11.2.1 Kellogg
List of Figures
- Figure 1: Global Cereal Bar Revenue Breakdown (billion, %) by Region 2025 & 2033
- Figure 2: Global Cereal Bar Volume Breakdown (K, %) by Region 2025 & 2033
- Figure 3: North America Cereal Bar Revenue (billion), by Application 2025 & 2033
- Figure 4: North America Cereal Bar Volume (K), by Application 2025 & 2033
- Figure 5: North America Cereal Bar Revenue Share (%), by Application 2025 & 2033
- Figure 6: North America Cereal Bar Volume Share (%), by Application 2025 & 2033
- Figure 7: North America Cereal Bar Revenue (billion), by Type 2025 & 2033
- Figure 8: North America Cereal Bar Volume (K), by Type 2025 & 2033
- Figure 9: North America Cereal Bar Revenue Share (%), by Type 2025 & 2033
- Figure 10: North America Cereal Bar Volume Share (%), by Type 2025 & 2033
- Figure 11: North America Cereal Bar Revenue (billion), by Country 2025 & 2033
- Figure 12: North America Cereal Bar Volume (K), by Country 2025 & 2033
- Figure 13: North America Cereal Bar Revenue Share (%), by Country 2025 & 2033
- Figure 14: North America Cereal Bar Volume Share (%), by Country 2025 & 2033
- Figure 15: South America Cereal Bar Revenue (billion), by Application 2025 & 2033
- Figure 16: South America Cereal Bar Volume (K), by Application 2025 & 2033
- Figure 17: South America Cereal Bar Revenue Share (%), by Application 2025 & 2033
- Figure 18: South America Cereal Bar Volume Share (%), by Application 2025 & 2033
- Figure 19: South America Cereal Bar Revenue (billion), by Type 2025 & 2033
- Figure 20: South America Cereal Bar Volume (K), by Type 2025 & 2033
- Figure 21: South America Cereal Bar Revenue Share (%), by Type 2025 & 2033
- Figure 22: South America Cereal Bar Volume Share (%), by Type 2025 & 2033
- Figure 23: South America Cereal Bar Revenue (billion), by Country 2025 & 2033
- Figure 24: South America Cereal Bar Volume (K), by Country 2025 & 2033
- Figure 25: South America Cereal Bar Revenue Share (%), by Country 2025 & 2033
- Figure 26: South America Cereal Bar Volume Share (%), by Country 2025 & 2033
- Figure 27: Europe Cereal Bar Revenue (billion), by Application 2025 & 2033
- Figure 28: Europe Cereal Bar Volume (K), by Application 2025 & 2033
- Figure 29: Europe Cereal Bar Revenue Share (%), by Application 2025 & 2033
- Figure 30: Europe Cereal Bar Volume Share (%), by Application 2025 & 2033
- Figure 31: Europe Cereal Bar Revenue (billion), by Type 2025 & 2033
- Figure 32: Europe Cereal Bar Volume (K), by Type 2025 & 2033
- Figure 33: Europe Cereal Bar Revenue Share (%), by Type 2025 & 2033
- Figure 34: Europe Cereal Bar Volume Share (%), by Type 2025 & 2033
- Figure 35: Europe Cereal Bar Revenue (billion), by Country 2025 & 2033
- Figure 36: Europe Cereal Bar Volume (K), by Country 2025 & 2033
- Figure 37: Europe Cereal Bar Revenue Share (%), by Country 2025 & 2033
- Figure 38: Europe Cereal Bar Volume Share (%), by Country 2025 & 2033
- Figure 39: Middle East & Africa Cereal Bar Revenue (billion), by Application 2025 & 2033
- Figure 40: Middle East & Africa Cereal Bar Volume (K), by Application 2025 & 2033
- Figure 41: Middle East & Africa Cereal Bar Revenue Share (%), by Application 2025 & 2033
- Figure 42: Middle East & Africa Cereal Bar Volume Share (%), by Application 2025 & 2033
- Figure 43: Middle East & Africa Cereal Bar Revenue (billion), by Type 2025 & 2033
- Figure 44: Middle East & Africa Cereal Bar Volume (K), by Type 2025 & 2033
- Figure 45: Middle East & Africa Cereal Bar Revenue Share (%), by Type 2025 & 2033
- Figure 46: Middle East & Africa Cereal Bar Volume Share (%), by Type 2025 & 2033
- Figure 47: Middle East & Africa Cereal Bar Revenue (billion), by Country 2025 & 2033
- Figure 48: Middle East & Africa Cereal Bar Volume (K), by Country 2025 & 2033
- Figure 49: Middle East & Africa Cereal Bar Revenue Share (%), by Country 2025 & 2033
- Figure 50: Middle East & Africa Cereal Bar Volume Share (%), by Country 2025 & 2033
- Figure 51: Asia Pacific Cereal Bar Revenue (billion), by Application 2025 & 2033
- Figure 52: Asia Pacific Cereal Bar Volume (K), by Application 2025 & 2033
- Figure 53: Asia Pacific Cereal Bar Revenue Share (%), by Application 2025 & 2033
- Figure 54: Asia Pacific Cereal Bar Volume Share (%), by Application 2025 & 2033
- Figure 55: Asia Pacific Cereal Bar Revenue (billion), by Type 2025 & 2033
- Figure 56: Asia Pacific Cereal Bar Volume (K), by Type 2025 & 2033
- Figure 57: Asia Pacific Cereal Bar Revenue Share (%), by Type 2025 & 2033
- Figure 58: Asia Pacific Cereal Bar Volume Share (%), by Type 2025 & 2033
- Figure 59: Asia Pacific Cereal Bar Revenue (billion), by Country 2025 & 2033
- Figure 60: Asia Pacific Cereal Bar Volume (K), by Country 2025 & 2033
- Figure 61: Asia Pacific Cereal Bar Revenue Share (%), by Country 2025 & 2033
- Figure 62: Asia Pacific Cereal Bar Volume Share (%), by Country 2025 & 2033
List of Tables
- Table 1: Global Cereal Bar Revenue billion Forecast, by Application 2020 & 2033
- Table 2: Global Cereal Bar Volume K Forecast, by Application 2020 & 2033
- Table 3: Global Cereal Bar Revenue billion Forecast, by Type 2020 & 2033
- Table 4: Global Cereal Bar Volume K Forecast, by Type 2020 & 2033
- Table 5: Global Cereal Bar Revenue billion Forecast, by Region 2020 & 2033
- Table 6: Global Cereal Bar Volume K Forecast, by Region 2020 & 2033
- Table 7: Global Cereal Bar Revenue billion Forecast, by Application 2020 & 2033
- Table 8: Global Cereal Bar Volume K Forecast, by Application 2020 & 2033
- Table 9: Global Cereal Bar Revenue billion Forecast, by Type 2020 & 2033
- Table 10: Global Cereal Bar Volume K Forecast, by Type 2020 & 2033
- Table 11: Global Cereal Bar Revenue billion Forecast, by Country 2020 & 2033
- Table 12: Global Cereal Bar Volume K Forecast, by Country 2020 & 2033
- Table 13: United States Cereal Bar Revenue (billion) Forecast, by Application 2020 & 2033
- Table 14: United States Cereal Bar Volume (K) Forecast, by Application 2020 & 2033
- Table 15: Canada Cereal Bar Revenue (billion) Forecast, by Application 2020 & 2033
- Table 16: Canada Cereal Bar Volume (K) Forecast, by Application 2020 & 2033
- Table 17: Mexico Cereal Bar Revenue (billion) Forecast, by Application 2020 & 2033
- Table 18: Mexico Cereal Bar Volume (K) Forecast, by Application 2020 & 2033
- Table 19: Global Cereal Bar Revenue billion Forecast, by Application 2020 & 2033
- Table 20: Global Cereal Bar Volume K Forecast, by Application 2020 & 2033
- Table 21: Global Cereal Bar Revenue billion Forecast, by Type 2020 & 2033
- Table 22: Global Cereal Bar Volume K Forecast, by Type 2020 & 2033
- Table 23: Global Cereal Bar Revenue billion Forecast, by Country 2020 & 2033
- Table 24: Global Cereal Bar Volume K Forecast, by Country 2020 & 2033
- Table 25: Brazil Cereal Bar Revenue (billion) Forecast, by Application 2020 & 2033
- Table 26: Brazil Cereal Bar Volume (K) Forecast, by Application 2020 & 2033
- Table 27: Argentina Cereal Bar Revenue (billion) Forecast, by Application 2020 & 2033
- Table 28: Argentina Cereal Bar Volume (K) Forecast, by Application 2020 & 2033
- Table 29: Rest of South America Cereal Bar Revenue (billion) Forecast, by Application 2020 & 2033
- Table 30: Rest of South America Cereal Bar Volume (K) Forecast, by Application 2020 & 2033
- Table 31: Global Cereal Bar Revenue billion Forecast, by Application 2020 & 2033
- Table 32: Global Cereal Bar Volume K Forecast, by Application 2020 & 2033
- Table 33: Global Cereal Bar Revenue billion Forecast, by Type 2020 & 2033
- Table 34: Global Cereal Bar Volume K Forecast, by Type 2020 & 2033
- Table 35: Global Cereal Bar Revenue billion Forecast, by Country 2020 & 2033
- Table 36: Global Cereal Bar Volume K Forecast, by Country 2020 & 2033
- Table 37: United Kingdom Cereal Bar Revenue (billion) Forecast, by Application 2020 & 2033
- Table 38: United Kingdom Cereal Bar Volume (K) Forecast, by Application 2020 & 2033
- Table 39: Germany Cereal Bar Revenue (billion) Forecast, by Application 2020 & 2033
- Table 40: Germany Cereal Bar Volume (K) Forecast, by Application 2020 & 2033
- Table 41: France Cereal Bar Revenue (billion) Forecast, by Application 2020 & 2033
- Table 42: France Cereal Bar Volume (K) Forecast, by Application 2020 & 2033
- Table 43: Italy Cereal Bar Revenue (billion) Forecast, by Application 2020 & 2033
- Table 44: Italy Cereal Bar Volume (K) Forecast, by Application 2020 & 2033
- Table 45: Spain Cereal Bar Revenue (billion) Forecast, by Application 2020 & 2033
- Table 46: Spain Cereal Bar Volume (K) Forecast, by Application 2020 & 2033
- Table 47: Russia Cereal Bar Revenue (billion) Forecast, by Application 2020 & 2033
- Table 48: Russia Cereal Bar Volume (K) Forecast, by Application 2020 & 2033
- Table 49: Benelux Cereal Bar Revenue (billion) Forecast, by Application 2020 & 2033
- Table 50: Benelux Cereal Bar Volume (K) Forecast, by Application 2020 & 2033
- Table 51: Nordics Cereal Bar Revenue (billion) Forecast, by Application 2020 & 2033
- Table 52: Nordics Cereal Bar Volume (K) Forecast, by Application 2020 & 2033
- Table 53: Rest of Europe Cereal Bar Revenue (billion) Forecast, by Application 2020 & 2033
- Table 54: Rest of Europe Cereal Bar Volume (K) Forecast, by Application 2020 & 2033
- Table 55: Global Cereal Bar Revenue billion Forecast, by Application 2020 & 2033
- Table 56: Global Cereal Bar Volume K Forecast, by Application 2020 & 2033
- Table 57: Global Cereal Bar Revenue billion Forecast, by Type 2020 & 2033
- Table 58: Global Cereal Bar Volume K Forecast, by Type 2020 & 2033
- Table 59: Global Cereal Bar Revenue billion Forecast, by Country 2020 & 2033
- Table 60: Global Cereal Bar Volume K Forecast, by Country 2020 & 2033
- Table 61: Turkey Cereal Bar Revenue (billion) Forecast, by Application 2020 & 2033
- Table 62: Turkey Cereal Bar Volume (K) Forecast, by Application 2020 & 2033
- Table 63: Israel Cereal Bar Revenue (billion) Forecast, by Application 2020 & 2033
- Table 64: Israel Cereal Bar Volume (K) Forecast, by Application 2020 & 2033
- Table 65: GCC Cereal Bar Revenue (billion) Forecast, by Application 2020 & 2033
- Table 66: GCC Cereal Bar Volume (K) Forecast, by Application 2020 & 2033
- Table 67: North Africa Cereal Bar Revenue (billion) Forecast, by Application 2020 & 2033
- Table 68: North Africa Cereal Bar Volume (K) Forecast, by Application 2020 & 2033
- Table 69: South Africa Cereal Bar Revenue (billion) Forecast, by Application 2020 & 2033
- Table 70: South Africa Cereal Bar Volume (K) Forecast, by Application 2020 & 2033
- Table 71: Rest of Middle East & Africa Cereal Bar Revenue (billion) Forecast, by Application 2020 & 2033
- Table 72: Rest of Middle East & Africa Cereal Bar Volume (K) Forecast, by Application 2020 & 2033
- Table 73: Global Cereal Bar Revenue billion Forecast, by Application 2020 & 2033
- Table 74: Global Cereal Bar Volume K Forecast, by Application 2020 & 2033
- Table 75: Global Cereal Bar Revenue billion Forecast, by Type 2020 & 2033
- Table 76: Global Cereal Bar Volume K Forecast, by Type 2020 & 2033
- Table 77: Global Cereal Bar Revenue billion Forecast, by Country 2020 & 2033
- Table 78: Global Cereal Bar Volume K Forecast, by Country 2020 & 2033
- Table 79: China Cereal Bar Revenue (billion) Forecast, by Application 2020 & 2033
- Table 80: China Cereal Bar Volume (K) Forecast, by Application 2020 & 2033
- Table 81: India Cereal Bar Revenue (billion) Forecast, by Application 2020 & 2033
- Table 82: India Cereal Bar Volume (K) Forecast, by Application 2020 & 2033
- Table 83: Japan Cereal Bar Revenue (billion) Forecast, by Application 2020 & 2033
- Table 84: Japan Cereal Bar Volume (K) Forecast, by Application 2020 & 2033
- Table 85: South Korea Cereal Bar Revenue (billion) Forecast, by Application 2020 & 2033
- Table 86: South Korea Cereal Bar Volume (K) Forecast, by Application 2020 & 2033
- Table 87: ASEAN Cereal Bar Revenue (billion) Forecast, by Application 2020 & 2033
- Table 88: ASEAN Cereal Bar Volume (K) Forecast, by Application 2020 & 2033
- Table 89: Oceania Cereal Bar Revenue (billion) Forecast, by Application 2020 & 2033
- Table 90: Oceania Cereal Bar Volume (K) Forecast, by Application 2020 & 2033
- Table 91: Rest of Asia Pacific Cereal Bar Revenue (billion) Forecast, by Application 2020 & 2033
- Table 92: Rest of Asia Pacific Cereal Bar Volume (K) Forecast, by Application 2020 & 2033
Frequently Asked Questions
1. What is the projected Compound Annual Growth Rate (CAGR) of the Cereal Bar?
The projected CAGR is approximately 7.4%.
2. Which companies are prominent players in the Cereal Bar?
Key companies in the market include Kellogg, General Mills, Pepsi, Nestlé, Quaker Oats, Atkins Nutritionals, Mckee.
3. What are the main segments of the Cereal Bar?
The market segments include Application, Type.
4. Can you provide details about the market size?
The market size is estimated to be USD 24.5 billion as of 2022.
5. What are some drivers contributing to market growth?
N/A
6. What are the notable trends driving market growth?
N/A
7. Are there any restraints impacting market growth?
N/A
8. Can you provide examples of recent developments in the market?
N/A
9. What pricing options are available for accessing the report?
Pricing options include single-user, multi-user, and enterprise licenses priced at USD 3950.00, USD 5925.00, and USD 7900.00 respectively.
10. Is the market size provided in terms of value or volume?
The market size is provided in terms of value, measured in billion and volume, measured in K.
11. Are there any specific market keywords associated with the report?
Yes, the market keyword associated with the report is "Cereal Bar," which aids in identifying and referencing the specific market segment covered.
12. How do I determine which pricing option suits my needs best?
The pricing options vary based on user requirements and access needs. Individual users may opt for single-user licenses, while businesses requiring broader access may choose multi-user or enterprise licenses for cost-effective access to the report.
13. Are there any additional resources or data provided in the Cereal Bar report?
While the report offers comprehensive insights, it's advisable to review the specific contents or supplementary materials provided to ascertain if additional resources or data are available.
14. How can I stay updated on further developments or reports in the Cereal Bar?
To stay informed about further developments, trends, and reports in the Cereal Bar, consider subscribing to industry newsletters, following relevant companies and organizations, or regularly checking reputable industry news sources and publications.
Methodology
Step 1 - Identification of Relevant Samples Size from Population Database


Step 2 - Approaches for Defining Global Market Size (Value, Volume* & Price*)

Note*: In applicable scenarios
Step 3 - Data Sources
Primary Research
- Web Analytics
- Survey Reports
- Research Institute
- Latest Research Reports
- Opinion Leaders
Secondary Research
- Annual Reports
- White Paper
- Latest Press Release
- Industry Association
- Paid Database
- Investor Presentations

Step 4 - Data Triangulation
Involves using different sources of information in order to increase the validity of a study
These sources are likely to be stakeholders in a program - participants, other researchers, program staff, other community members, and so on.
Then we put all data in single framework & apply various statistical tools to find out the dynamic on the market.
During the analysis stage, feedback from the stakeholder groups would be compared to determine areas of agreement as well as areas of divergence