

Key Insights
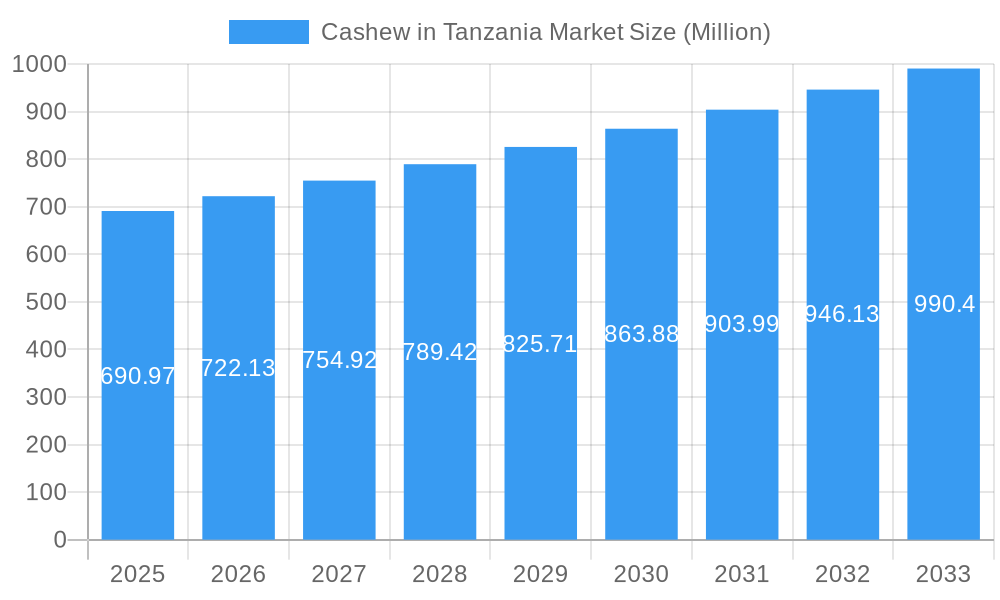
The Tanzanian cashew market, valued at $690.97 million in 2025, is projected to experience robust growth, driven by rising global demand for healthy snacks and the increasing popularity of cashew-based products like cashew butter and milk. A compound annual growth rate (CAGR) of 4.48% is anticipated from 2025 to 2033, indicating a substantial market expansion. This growth is fueled by several factors, including increased domestic consumption fueled by a growing middle class with a higher disposable income, and Tanzania's strategic geographic location facilitating easier export to key markets in the Middle East and Africa. The "food ingredients" application segment is likely to dominate, given the increasing use of cashews in processed foods, confectioneries, and nutraceutical products. Major players like Olam International, Cashewnut Company Ltd, and Bunge Limited are key contributors to the market, leveraging their established supply chains and processing capabilities. However, challenges remain, including fluctuating cashew prices dependent on global supply and demand, and the need for improved infrastructure to support efficient processing and export. The "Household Consumers" end-user segment is expected to show the strongest growth, driven by rising awareness of cashews' nutritional benefits and increasing purchasing power. Further growth will also depend on government initiatives supporting sustainable cashew farming and processing techniques to ensure both quality and environmental sustainability.
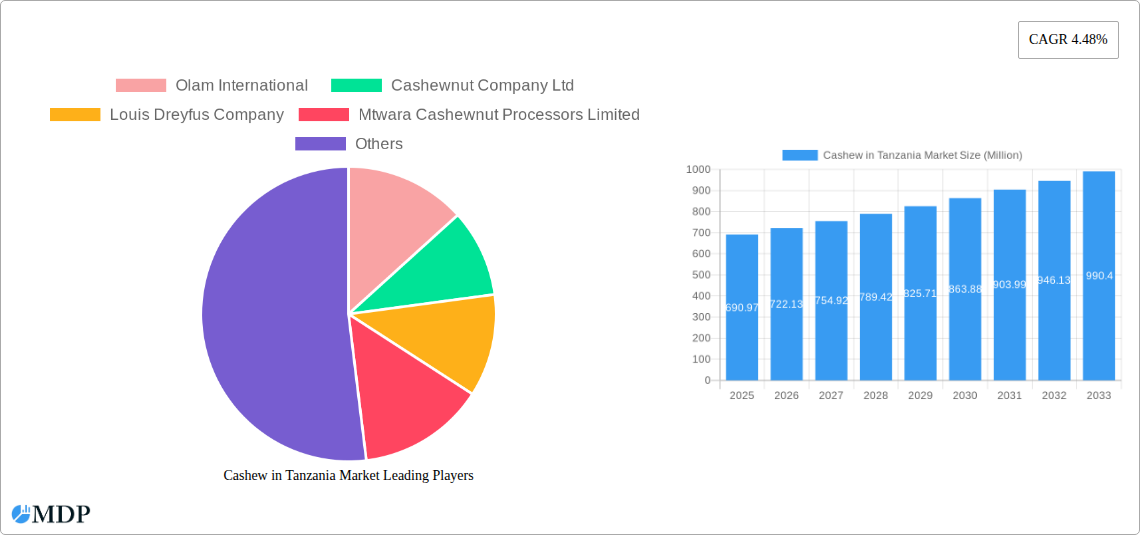
Cashew in Tanzania Market Market Size (In Million)
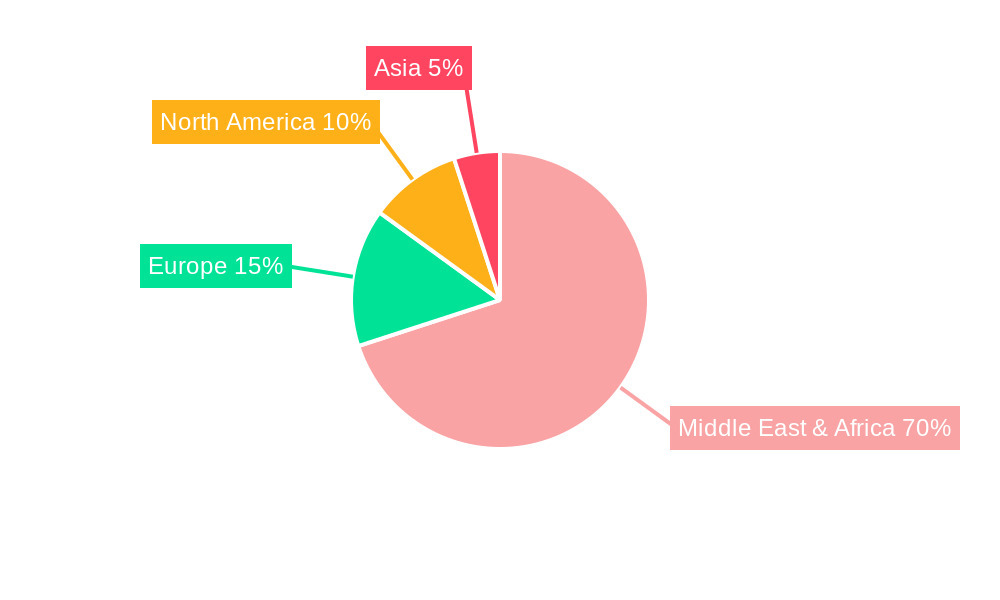
The market segmentation highlights significant opportunities within specific product types and applications. Roasted cashew nuts and cashew butter are expected to continue their strong performance, driven by consumer preference for ready-to-eat snacks and convenient food options. The burgeoning nutraceutical industry is creating new avenues for cashew use, given their rich nutrient profile. While the Middle East & Africa region, particularly UAE and South Africa, are key export destinations, focused efforts on improving domestic processing and value addition could significantly enhance Tanzania's share of the global cashew market. The historical period (2019-2024) likely saw fluctuations reflective of global market dynamics, but the forecast period (2025-2033) points towards a consistently upward trajectory, indicating a promising future for the Tanzanian cashew industry.
Cashew in Tanzania Market Company Market Share
Cashew in Tanzania Market: A Comprehensive Market Report (2019-2033)
This comprehensive report provides an in-depth analysis of the Tanzanian cashew market, covering market dynamics, industry trends, leading players, and future growth prospects. The study period spans from 2019 to 2033, with a base year of 2025 and a forecast period from 2025 to 2033. This report is essential for industry stakeholders, investors, and anyone seeking to understand the opportunities and challenges within this dynamic market. The report utilizes data covering all segments of the cashew market including raw cashew nuts, roasted cashew nuts, cashew butter, and cashew milk; across applications like snacks, food ingredients, confectionery, and cosmetic products; and targeting end users such as household consumers, food processing companies, nutraceutical companies, and cosmetic manufacturers.
Cashew in Tanzania Market Market Dynamics & Concentration
The Tanzanian cashew market is characterized by a complex interplay of factors influencing its growth and concentration. Market concentration is moderate, with several key players dominating the industry while smaller processors and exporters also operate. Innovation in processing techniques, particularly value-addition, is a key driver, pushing the market towards higher-value products. The regulatory framework, including government policies regarding export tariffs and farmer support, significantly impacts market dynamics. While cashew nuts face competition from other nuts and snacks, increasing consumer awareness of health benefits supports overall market growth. Mergers and acquisitions (M&A) activity has been moderate, with strategic partnerships playing a significant role in market consolidation.
- Market Share: Olam International and Cargill hold significant market share, estimated at xx% and xx% respectively, in 2025. The remaining share is distributed among other major players and numerous smaller businesses.
- M&A Activity: The historical period (2019-2024) witnessed approximately xx M&A deals, primarily focused on vertical integration within the supply chain. The forecast period (2025-2033) is expected to see a similar level of activity, driven by strategic expansion.
- Innovation Drivers: Government initiatives promoting value addition and technological advancements in processing are key drivers of innovation, focused on efficiency and quality improvements.
Cashew in Tanzania Market Industry Trends & Analysis
The Tanzanian cashew market exhibits robust growth, driven by several key factors. Increased domestic consumption and export demand contribute significantly to market expansion. Technological advancements in farming techniques and processing technologies enhance productivity and efficiency, improving output and quality. Consumer preference for healthier snacks and the increasing use of cashews in diverse food and cosmetic products fuel market growth. Competitive dynamics are intense, with key players focusing on brand building, product diversification, and supply chain optimization. The compound annual growth rate (CAGR) is projected to be xx% during the forecast period (2025-2033). Market penetration of value-added cashew products is expected to increase significantly, reaching xx% by 2033.
Leading Markets & Segments in Cashew in Tanzania Market
The Mtwara region dominates cashew production in Tanzania due to favorable climatic conditions and established infrastructure. Within product types, raw cashew nuts remain the largest segment due to significant export volumes, followed by roasted cashew nuts catering to the growing domestic market. In terms of applications, the food ingredients segment holds a leading position owing to increasing demand from food processing companies.
- Key Drivers for Mtwara Region Dominance:
- Favorable climatic conditions ideal for cashew cultivation.
- Established infrastructure supporting cashew farming and processing.
- Proximity to ports facilitating efficient export.
- Dominant Product Type: Raw cashew nuts (xx Million USD in 2025)
- Dominant Application: Food ingredients (xx Million USD in 2025)
- Dominant End-User: Food processing companies (xx Million USD in 2025)
Cashew in Tanzania Market Product Developments
Product innovation within the Tanzanian cashew market centers on value addition. Processing technologies are improving to produce higher-quality roasted nuts, cashew butter, and cashew milk, meeting evolving consumer preferences. Companies are emphasizing sustainably sourced cashews and incorporating innovative packaging solutions. This focus on value-added products commands higher prices and improves market competitiveness, targeting both domestic and international markets.
Key Drivers of Cashew in Tanzania Market Growth
Several factors fuel growth in the Tanzanian cashew market. Government initiatives like the USD 26 million investment in agricultural inputs directly boost production and farmer incomes. Technological advancements in farming and processing enhance yield and quality. Increasing consumer demand, driven by health consciousness and product diversification, drives consumption. Furthermore, favorable export opportunities due to increasing global demand contribute to market growth.
Challenges in the Cashew in Tanzania Market Market
The Tanzanian cashew market faces several challenges. Fluctuations in global prices negatively impact farmer profitability. Inadequate infrastructure, particularly storage and transportation facilities, increase processing costs. Competition from other nut producers globally poses a significant challenge. Regulatory hurdles related to export procedures and compliance further impact market expansion. These constraints reduce overall market efficiency and potential for growth. The estimated impact is a xx% reduction in potential revenue in 2025.
Emerging Opportunities in Cashew in Tanzania Market
Significant opportunities exist within the Tanzanian cashew market. Investing in advanced processing technologies to create higher-value products opens up access to premium markets. Strategic partnerships between local farmers, processors, and international companies can unlock significant growth potential. Expanding into new markets globally and enhancing branding strategies for Tanzanian cashews can enhance market penetration and revenue generation. These strategic moves would greatly boost the market's potential by xx% in 2033.
Leading Players in the Cashew in Tanzania Market Sector
- Olam International
- Cashewnut Company Ltd
- Louis Dreyfus Company
- Mtwara Cashewnut Processors Limited
- Bunge Limited
- Tanzania Cashewnut Board
- ADM (Archer Daniels Midland Company)
- Export Trading Group
- Cargill
Key Milestones in Cashew in Tanzania Market Industry
- March 2022: The Tanzania Agriculture Research Institute (TARI) implements grafting and budding techniques to improve cashew tree productivity. This initiative is expected to increase yields in the long term.
- May 2022: The Tanzanian government invests USD 26 million in free agricultural inputs for cashew farmers, directly boosting production and farmer incomes.
- July 2022: The Tanzania Investment Center (TIC) announces plans to construct cashew processing factories in collaboration with local investors, promoting value addition and export revenue.
Strategic Outlook for Cashew in Tanzania Market Market
The future of the Tanzanian cashew market is promising. Strategic investments in value-added processing, infrastructure development, and farmer support programs will significantly enhance the industry's growth trajectory. Focus on sustainability, brand building, and exploring new export markets will solidify Tanzania's position as a key player in the global cashew market. The market is poised for substantial growth, driven by these strategic initiatives and the overall increasing global demand for cashews. The estimated market value could reach xx Million USD by 2033.
Cashew in Tanzania Market Segmentation
- 1. Production Analysis
- 2. Consumption Analysis (Volume and Value)
- 3. Import Market Analysis (Volume and Value)
- 4. Export Market Analysis (Volume and Value)
- 5. Price Trend Analysis
- 6. Production Analysis
- 7. Consumption Analysis (Volume and Value)
- 8. Import Market Analysis (Volume and Value)
- 9. Export Market Analysis (Volume and Value)
- 10. Price Trend Analysis
Cashew in Tanzania Market Segmentation By Geography
-
1. North America
- 1.1. United States
- 1.2. Canada
- 1.3. Mexico
-
2. South America
- 2.1. Brazil
- 2.2. Argentina
- 2.3. Rest of South America
-
3. Europe
- 3.1. United Kingdom
- 3.2. Germany
- 3.3. France
- 3.4. Italy
- 3.5. Spain
- 3.6. Russia
- 3.7. Benelux
- 3.8. Nordics
- 3.9. Rest of Europe
-
4. Middle East & Africa
- 4.1. Turkey
- 4.2. Israel
- 4.3. GCC
- 4.4. North Africa
- 4.5. South Africa
- 4.6. Rest of Middle East & Africa
-
5. Asia Pacific
- 5.1. China
- 5.2. India
- 5.3. Japan
- 5.4. South Korea
- 5.5. ASEAN
- 5.6. Oceania
- 5.7. Rest of Asia Pacific
Cashew in Tanzania Market Regional Market Share
Geographic Coverage of Cashew in Tanzania Market
Cashew in Tanzania Market REPORT HIGHLIGHTS
| Aspects | Details |
|---|---|
| Study Period | 2020-2034 |
| Base Year | 2025 |
| Estimated Year | 2026 |
| Forecast Period | 2026-2034 |
| Historical Period | 2020-2025 |
| Growth Rate | CAGR of 4.48% from 2020-2034 |
| Segmentation |
|
Table of Contents
- 1. Introduction
- 1.1. Research Scope
- 1.2. Market Segmentation
- 1.3. Research Methodology
- 1.4. Definitions and Assumptions
- 2. Executive Summary
- 2.1. Introduction
- 3. Market Dynamics
- 3.1. Introduction
- 3.2. Market Drivers
- 3.3. Market Restrains
- 3.4. Market Trends
- 3.4.1. Increasing Government Support and Growing Production Driving the Market
- 4. Market Factor Analysis
- 4.1. Porters Five Forces
- 4.2. Supply/Value Chain
- 4.3. PESTEL analysis
- 4.4. Market Entropy
- 4.5. Patent/Trademark Analysis
- 5. Global Cashew in Tanzania Market Analysis, Insights and Forecast, 2020-2032
- 5.1. Market Analysis, Insights and Forecast - by Production Analysis
- 5.2. Market Analysis, Insights and Forecast - by Consumption Analysis (Volume and Value)
- 5.3. Market Analysis, Insights and Forecast - by Import Market Analysis (Volume and Value)
- 5.4. Market Analysis, Insights and Forecast - by Export Market Analysis (Volume and Value)
- 5.5. Market Analysis, Insights and Forecast - by Price Trend Analysis
- 5.6. Market Analysis, Insights and Forecast - by Production Analysis
- 5.7. Market Analysis, Insights and Forecast - by Consumption Analysis (Volume and Value)
- 5.8. Market Analysis, Insights and Forecast - by Import Market Analysis (Volume and Value)
- 5.9. Market Analysis, Insights and Forecast - by Export Market Analysis (Volume and Value)
- 5.10. Market Analysis, Insights and Forecast - by Price Trend Analysis
- 5.11. Market Analysis, Insights and Forecast - by Region
- 5.11.1. North America
- 5.11.2. South America
- 5.11.3. Europe
- 5.11.4. Middle East & Africa
- 5.11.5. Asia Pacific
- 5.1. Market Analysis, Insights and Forecast - by Production Analysis
- 6. North America Cashew in Tanzania Market Analysis, Insights and Forecast, 2020-2032
- 6.1. Market Analysis, Insights and Forecast - by Production Analysis
- 6.2. Market Analysis, Insights and Forecast - by Consumption Analysis (Volume and Value)
- 6.3. Market Analysis, Insights and Forecast - by Import Market Analysis (Volume and Value)
- 6.4. Market Analysis, Insights and Forecast - by Export Market Analysis (Volume and Value)
- 6.5. Market Analysis, Insights and Forecast - by Price Trend Analysis
- 6.6. Market Analysis, Insights and Forecast - by Production Analysis
- 6.7. Market Analysis, Insights and Forecast - by Consumption Analysis (Volume and Value)
- 6.8. Market Analysis, Insights and Forecast - by Import Market Analysis (Volume and Value)
- 6.9. Market Analysis, Insights and Forecast - by Export Market Analysis (Volume and Value)
- 6.10. Market Analysis, Insights and Forecast - by Price Trend Analysis
- 6.1. Market Analysis, Insights and Forecast - by Production Analysis
- 7. South America Cashew in Tanzania Market Analysis, Insights and Forecast, 2020-2032
- 7.1. Market Analysis, Insights and Forecast - by Production Analysis
- 7.2. Market Analysis, Insights and Forecast - by Consumption Analysis (Volume and Value)
- 7.3. Market Analysis, Insights and Forecast - by Import Market Analysis (Volume and Value)
- 7.4. Market Analysis, Insights and Forecast - by Export Market Analysis (Volume and Value)
- 7.5. Market Analysis, Insights and Forecast - by Price Trend Analysis
- 7.6. Market Analysis, Insights and Forecast - by Production Analysis
- 7.7. Market Analysis, Insights and Forecast - by Consumption Analysis (Volume and Value)
- 7.8. Market Analysis, Insights and Forecast - by Import Market Analysis (Volume and Value)
- 7.9. Market Analysis, Insights and Forecast - by Export Market Analysis (Volume and Value)
- 7.10. Market Analysis, Insights and Forecast - by Price Trend Analysis
- 7.1. Market Analysis, Insights and Forecast - by Production Analysis
- 8. Europe Cashew in Tanzania Market Analysis, Insights and Forecast, 2020-2032
- 8.1. Market Analysis, Insights and Forecast - by Production Analysis
- 8.2. Market Analysis, Insights and Forecast - by Consumption Analysis (Volume and Value)
- 8.3. Market Analysis, Insights and Forecast - by Import Market Analysis (Volume and Value)
- 8.4. Market Analysis, Insights and Forecast - by Export Market Analysis (Volume and Value)
- 8.5. Market Analysis, Insights and Forecast - by Price Trend Analysis
- 8.6. Market Analysis, Insights and Forecast - by Production Analysis
- 8.7. Market Analysis, Insights and Forecast - by Consumption Analysis (Volume and Value)
- 8.8. Market Analysis, Insights and Forecast - by Import Market Analysis (Volume and Value)
- 8.9. Market Analysis, Insights and Forecast - by Export Market Analysis (Volume and Value)
- 8.10. Market Analysis, Insights and Forecast - by Price Trend Analysis
- 8.1. Market Analysis, Insights and Forecast - by Production Analysis
- 9. Middle East & Africa Cashew in Tanzania Market Analysis, Insights and Forecast, 2020-2032
- 9.1. Market Analysis, Insights and Forecast - by Production Analysis
- 9.2. Market Analysis, Insights and Forecast - by Consumption Analysis (Volume and Value)
- 9.3. Market Analysis, Insights and Forecast - by Import Market Analysis (Volume and Value)
- 9.4. Market Analysis, Insights and Forecast - by Export Market Analysis (Volume and Value)
- 9.5. Market Analysis, Insights and Forecast - by Price Trend Analysis
- 9.6. Market Analysis, Insights and Forecast - by Production Analysis
- 9.7. Market Analysis, Insights and Forecast - by Consumption Analysis (Volume and Value)
- 9.8. Market Analysis, Insights and Forecast - by Import Market Analysis (Volume and Value)
- 9.9. Market Analysis, Insights and Forecast - by Export Market Analysis (Volume and Value)
- 9.10. Market Analysis, Insights and Forecast - by Price Trend Analysis
- 9.1. Market Analysis, Insights and Forecast - by Production Analysis
- 10. Asia Pacific Cashew in Tanzania Market Analysis, Insights and Forecast, 2020-2032
- 10.1. Market Analysis, Insights and Forecast - by Production Analysis
- 10.2. Market Analysis, Insights and Forecast - by Consumption Analysis (Volume and Value)
- 10.3. Market Analysis, Insights and Forecast - by Import Market Analysis (Volume and Value)
- 10.4. Market Analysis, Insights and Forecast - by Export Market Analysis (Volume and Value)
- 10.5. Market Analysis, Insights and Forecast - by Price Trend Analysis
- 10.6. Market Analysis, Insights and Forecast - by Production Analysis
- 10.7. Market Analysis, Insights and Forecast - by Consumption Analysis (Volume and Value)
- 10.8. Market Analysis, Insights and Forecast - by Import Market Analysis (Volume and Value)
- 10.9. Market Analysis, Insights and Forecast - by Export Market Analysis (Volume and Value)
- 10.10. Market Analysis, Insights and Forecast - by Price Trend Analysis
- 10.1. Market Analysis, Insights and Forecast - by Production Analysis
- 11. Competitive Analysis
- 11.1. Global Market Share Analysis 2025
- 11.2. Company Profiles
- 11.2.1 Olam International
- 11.2.1.1. Overview
- 11.2.1.2. Products
- 11.2.1.3. SWOT Analysis
- 11.2.1.4. Recent Developments
- 11.2.1.5. Financials (Based on Availability)
- 11.2.2 Cashewnut Company Ltd
- 11.2.2.1. Overview
- 11.2.2.2. Products
- 11.2.2.3. SWOT Analysis
- 11.2.2.4. Recent Developments
- 11.2.2.5. Financials (Based on Availability)
- 11.2.3 Louis Dreyfus Company
- 11.2.3.1. Overview
- 11.2.3.2. Products
- 11.2.3.3. SWOT Analysis
- 11.2.3.4. Recent Developments
- 11.2.3.5. Financials (Based on Availability)
- 11.2.4 Olam International
- 11.2.4.1. Overview
- 11.2.4.2. Products
- 11.2.4.3. SWOT Analysis
- 11.2.4.4. Recent Developments
- 11.2.4.5. Financials (Based on Availability)
- 11.2.5 Mtwara Cashewnut Processors Limited
- 11.2.5.1. Overview
- 11.2.5.2. Products
- 11.2.5.3. SWOT Analysis
- 11.2.5.4. Recent Developments
- 11.2.5.5. Financials (Based on Availability)
- 11.2.6 Bunge Limited
- 11.2.6.1. Overview
- 11.2.6.2. Products
- 11.2.6.3. SWOT Analysis
- 11.2.6.4. Recent Developments
- 11.2.6.5. Financials (Based on Availability)
- 11.2.7 Tanzania Cashewnut Board
- 11.2.7.1. Overview
- 11.2.7.2. Products
- 11.2.7.3. SWOT Analysis
- 11.2.7.4. Recent Developments
- 11.2.7.5. Financials (Based on Availability)
- 11.2.8 ADM (Archer Daniels Midland Company)
- 11.2.8.1. Overview
- 11.2.8.2. Products
- 11.2.8.3. SWOT Analysis
- 11.2.8.4. Recent Developments
- 11.2.8.5. Financials (Based on Availability)
- 11.2.9 Export Trading Group
- 11.2.9.1. Overview
- 11.2.9.2. Products
- 11.2.9.3. SWOT Analysis
- 11.2.9.4. Recent Developments
- 11.2.9.5. Financials (Based on Availability)
- 11.2.10 Cargill
- 11.2.10.1. Overview
- 11.2.10.2. Products
- 11.2.10.3. SWOT Analysis
- 11.2.10.4. Recent Developments
- 11.2.10.5. Financials (Based on Availability)
- 11.2.1 Olam International
List of Figures
- Figure 1: Global Cashew in Tanzania Market Revenue Breakdown (Million, %) by Region 2025 & 2033
- Figure 2: Global Cashew in Tanzania Market Volume Breakdown (Kiloton, %) by Region 2025 & 2033
- Figure 3: North America Cashew in Tanzania Market Revenue (Million), by Production Analysis 2025 & 2033
- Figure 4: North America Cashew in Tanzania Market Volume (Kiloton), by Production Analysis 2025 & 2033
- Figure 5: North America Cashew in Tanzania Market Revenue Share (%), by Production Analysis 2025 & 2033
- Figure 6: North America Cashew in Tanzania Market Volume Share (%), by Production Analysis 2025 & 2033
- Figure 7: North America Cashew in Tanzania Market Revenue (Million), by Consumption Analysis (Volume and Value) 2025 & 2033
- Figure 8: North America Cashew in Tanzania Market Volume (Kiloton), by Consumption Analysis (Volume and Value) 2025 & 2033
- Figure 9: North America Cashew in Tanzania Market Revenue Share (%), by Consumption Analysis (Volume and Value) 2025 & 2033
- Figure 10: North America Cashew in Tanzania Market Volume Share (%), by Consumption Analysis (Volume and Value) 2025 & 2033
- Figure 11: North America Cashew in Tanzania Market Revenue (Million), by Import Market Analysis (Volume and Value) 2025 & 2033
- Figure 12: North America Cashew in Tanzania Market Volume (Kiloton), by Import Market Analysis (Volume and Value) 2025 & 2033
- Figure 13: North America Cashew in Tanzania Market Revenue Share (%), by Import Market Analysis (Volume and Value) 2025 & 2033
- Figure 14: North America Cashew in Tanzania Market Volume Share (%), by Import Market Analysis (Volume and Value) 2025 & 2033
- Figure 15: North America Cashew in Tanzania Market Revenue (Million), by Export Market Analysis (Volume and Value) 2025 & 2033
- Figure 16: North America Cashew in Tanzania Market Volume (Kiloton), by Export Market Analysis (Volume and Value) 2025 & 2033
- Figure 17: North America Cashew in Tanzania Market Revenue Share (%), by Export Market Analysis (Volume and Value) 2025 & 2033
- Figure 18: North America Cashew in Tanzania Market Volume Share (%), by Export Market Analysis (Volume and Value) 2025 & 2033
- Figure 19: North America Cashew in Tanzania Market Revenue (Million), by Price Trend Analysis 2025 & 2033
- Figure 20: North America Cashew in Tanzania Market Volume (Kiloton), by Price Trend Analysis 2025 & 2033
- Figure 21: North America Cashew in Tanzania Market Revenue Share (%), by Price Trend Analysis 2025 & 2033
- Figure 22: North America Cashew in Tanzania Market Volume Share (%), by Price Trend Analysis 2025 & 2033
- Figure 23: North America Cashew in Tanzania Market Revenue (Million), by Production Analysis 2025 & 2033
- Figure 24: North America Cashew in Tanzania Market Volume (Kiloton), by Production Analysis 2025 & 2033
- Figure 25: North America Cashew in Tanzania Market Revenue Share (%), by Production Analysis 2025 & 2033
- Figure 26: North America Cashew in Tanzania Market Volume Share (%), by Production Analysis 2025 & 2033
- Figure 27: North America Cashew in Tanzania Market Revenue (Million), by Consumption Analysis (Volume and Value) 2025 & 2033
- Figure 28: North America Cashew in Tanzania Market Volume (Kiloton), by Consumption Analysis (Volume and Value) 2025 & 2033
- Figure 29: North America Cashew in Tanzania Market Revenue Share (%), by Consumption Analysis (Volume and Value) 2025 & 2033
- Figure 30: North America Cashew in Tanzania Market Volume Share (%), by Consumption Analysis (Volume and Value) 2025 & 2033
- Figure 31: North America Cashew in Tanzania Market Revenue (Million), by Import Market Analysis (Volume and Value) 2025 & 2033
- Figure 32: North America Cashew in Tanzania Market Volume (Kiloton), by Import Market Analysis (Volume and Value) 2025 & 2033
- Figure 33: North America Cashew in Tanzania Market Revenue Share (%), by Import Market Analysis (Volume and Value) 2025 & 2033
- Figure 34: North America Cashew in Tanzania Market Volume Share (%), by Import Market Analysis (Volume and Value) 2025 & 2033
- Figure 35: North America Cashew in Tanzania Market Revenue (Million), by Export Market Analysis (Volume and Value) 2025 & 2033
- Figure 36: North America Cashew in Tanzania Market Volume (Kiloton), by Export Market Analysis (Volume and Value) 2025 & 2033
- Figure 37: North America Cashew in Tanzania Market Revenue Share (%), by Export Market Analysis (Volume and Value) 2025 & 2033
- Figure 38: North America Cashew in Tanzania Market Volume Share (%), by Export Market Analysis (Volume and Value) 2025 & 2033
- Figure 39: North America Cashew in Tanzania Market Revenue (Million), by Price Trend Analysis 2025 & 2033
- Figure 40: North America Cashew in Tanzania Market Volume (Kiloton), by Price Trend Analysis 2025 & 2033
- Figure 41: North America Cashew in Tanzania Market Revenue Share (%), by Price Trend Analysis 2025 & 2033
- Figure 42: North America Cashew in Tanzania Market Volume Share (%), by Price Trend Analysis 2025 & 2033
- Figure 43: North America Cashew in Tanzania Market Revenue (Million), by Country 2025 & 2033
- Figure 44: North America Cashew in Tanzania Market Volume (Kiloton), by Country 2025 & 2033
- Figure 45: North America Cashew in Tanzania Market Revenue Share (%), by Country 2025 & 2033
- Figure 46: North America Cashew in Tanzania Market Volume Share (%), by Country 2025 & 2033
- Figure 47: South America Cashew in Tanzania Market Revenue (Million), by Production Analysis 2025 & 2033
- Figure 48: South America Cashew in Tanzania Market Volume (Kiloton), by Production Analysis 2025 & 2033
- Figure 49: South America Cashew in Tanzania Market Revenue Share (%), by Production Analysis 2025 & 2033
- Figure 50: South America Cashew in Tanzania Market Volume Share (%), by Production Analysis 2025 & 2033
- Figure 51: South America Cashew in Tanzania Market Revenue (Million), by Consumption Analysis (Volume and Value) 2025 & 2033
- Figure 52: South America Cashew in Tanzania Market Volume (Kiloton), by Consumption Analysis (Volume and Value) 2025 & 2033
- Figure 53: South America Cashew in Tanzania Market Revenue Share (%), by Consumption Analysis (Volume and Value) 2025 & 2033
- Figure 54: South America Cashew in Tanzania Market Volume Share (%), by Consumption Analysis (Volume and Value) 2025 & 2033
- Figure 55: South America Cashew in Tanzania Market Revenue (Million), by Import Market Analysis (Volume and Value) 2025 & 2033
- Figure 56: South America Cashew in Tanzania Market Volume (Kiloton), by Import Market Analysis (Volume and Value) 2025 & 2033
- Figure 57: South America Cashew in Tanzania Market Revenue Share (%), by Import Market Analysis (Volume and Value) 2025 & 2033
- Figure 58: South America Cashew in Tanzania Market Volume Share (%), by Import Market Analysis (Volume and Value) 2025 & 2033
- Figure 59: South America Cashew in Tanzania Market Revenue (Million), by Export Market Analysis (Volume and Value) 2025 & 2033
- Figure 60: South America Cashew in Tanzania Market Volume (Kiloton), by Export Market Analysis (Volume and Value) 2025 & 2033
- Figure 61: South America Cashew in Tanzania Market Revenue Share (%), by Export Market Analysis (Volume and Value) 2025 & 2033
- Figure 62: South America Cashew in Tanzania Market Volume Share (%), by Export Market Analysis (Volume and Value) 2025 & 2033
- Figure 63: South America Cashew in Tanzania Market Revenue (Million), by Price Trend Analysis 2025 & 2033
- Figure 64: South America Cashew in Tanzania Market Volume (Kiloton), by Price Trend Analysis 2025 & 2033
- Figure 65: South America Cashew in Tanzania Market Revenue Share (%), by Price Trend Analysis 2025 & 2033
- Figure 66: South America Cashew in Tanzania Market Volume Share (%), by Price Trend Analysis 2025 & 2033
- Figure 67: South America Cashew in Tanzania Market Revenue (Million), by Production Analysis 2025 & 2033
- Figure 68: South America Cashew in Tanzania Market Volume (Kiloton), by Production Analysis 2025 & 2033
- Figure 69: South America Cashew in Tanzania Market Revenue Share (%), by Production Analysis 2025 & 2033
- Figure 70: South America Cashew in Tanzania Market Volume Share (%), by Production Analysis 2025 & 2033
- Figure 71: South America Cashew in Tanzania Market Revenue (Million), by Consumption Analysis (Volume and Value) 2025 & 2033
- Figure 72: South America Cashew in Tanzania Market Volume (Kiloton), by Consumption Analysis (Volume and Value) 2025 & 2033
- Figure 73: South America Cashew in Tanzania Market Revenue Share (%), by Consumption Analysis (Volume and Value) 2025 & 2033
- Figure 74: South America Cashew in Tanzania Market Volume Share (%), by Consumption Analysis (Volume and Value) 2025 & 2033
- Figure 75: South America Cashew in Tanzania Market Revenue (Million), by Import Market Analysis (Volume and Value) 2025 & 2033
- Figure 76: South America Cashew in Tanzania Market Volume (Kiloton), by Import Market Analysis (Volume and Value) 2025 & 2033
- Figure 77: South America Cashew in Tanzania Market Revenue Share (%), by Import Market Analysis (Volume and Value) 2025 & 2033
- Figure 78: South America Cashew in Tanzania Market Volume Share (%), by Import Market Analysis (Volume and Value) 2025 & 2033
- Figure 79: South America Cashew in Tanzania Market Revenue (Million), by Export Market Analysis (Volume and Value) 2025 & 2033
- Figure 80: South America Cashew in Tanzania Market Volume (Kiloton), by Export Market Analysis (Volume and Value) 2025 & 2033
- Figure 81: South America Cashew in Tanzania Market Revenue Share (%), by Export Market Analysis (Volume and Value) 2025 & 2033
- Figure 82: South America Cashew in Tanzania Market Volume Share (%), by Export Market Analysis (Volume and Value) 2025 & 2033
- Figure 83: South America Cashew in Tanzania Market Revenue (Million), by Price Trend Analysis 2025 & 2033
- Figure 84: South America Cashew in Tanzania Market Volume (Kiloton), by Price Trend Analysis 2025 & 2033
- Figure 85: South America Cashew in Tanzania Market Revenue Share (%), by Price Trend Analysis 2025 & 2033
- Figure 86: South America Cashew in Tanzania Market Volume Share (%), by Price Trend Analysis 2025 & 2033
- Figure 87: South America Cashew in Tanzania Market Revenue (Million), by Country 2025 & 2033
- Figure 88: South America Cashew in Tanzania Market Volume (Kiloton), by Country 2025 & 2033
- Figure 89: South America Cashew in Tanzania Market Revenue Share (%), by Country 2025 & 2033
- Figure 90: South America Cashew in Tanzania Market Volume Share (%), by Country 2025 & 2033
- Figure 91: Europe Cashew in Tanzania Market Revenue (Million), by Production Analysis 2025 & 2033
- Figure 92: Europe Cashew in Tanzania Market Volume (Kiloton), by Production Analysis 2025 & 2033
- Figure 93: Europe Cashew in Tanzania Market Revenue Share (%), by Production Analysis 2025 & 2033
- Figure 94: Europe Cashew in Tanzania Market Volume Share (%), by Production Analysis 2025 & 2033
- Figure 95: Europe Cashew in Tanzania Market Revenue (Million), by Consumption Analysis (Volume and Value) 2025 & 2033
- Figure 96: Europe Cashew in Tanzania Market Volume (Kiloton), by Consumption Analysis (Volume and Value) 2025 & 2033
- Figure 97: Europe Cashew in Tanzania Market Revenue Share (%), by Consumption Analysis (Volume and Value) 2025 & 2033
- Figure 98: Europe Cashew in Tanzania Market Volume Share (%), by Consumption Analysis (Volume and Value) 2025 & 2033
- Figure 99: Europe Cashew in Tanzania Market Revenue (Million), by Import Market Analysis (Volume and Value) 2025 & 2033
- Figure 100: Europe Cashew in Tanzania Market Volume (Kiloton), by Import Market Analysis (Volume and Value) 2025 & 2033
- Figure 101: Europe Cashew in Tanzania Market Revenue Share (%), by Import Market Analysis (Volume and Value) 2025 & 2033
- Figure 102: Europe Cashew in Tanzania Market Volume Share (%), by Import Market Analysis (Volume and Value) 2025 & 2033
- Figure 103: Europe Cashew in Tanzania Market Revenue (Million), by Export Market Analysis (Volume and Value) 2025 & 2033
- Figure 104: Europe Cashew in Tanzania Market Volume (Kiloton), by Export Market Analysis (Volume and Value) 2025 & 2033
- Figure 105: Europe Cashew in Tanzania Market Revenue Share (%), by Export Market Analysis (Volume and Value) 2025 & 2033
- Figure 106: Europe Cashew in Tanzania Market Volume Share (%), by Export Market Analysis (Volume and Value) 2025 & 2033
- Figure 107: Europe Cashew in Tanzania Market Revenue (Million), by Price Trend Analysis 2025 & 2033
- Figure 108: Europe Cashew in Tanzania Market Volume (Kiloton), by Price Trend Analysis 2025 & 2033
- Figure 109: Europe Cashew in Tanzania Market Revenue Share (%), by Price Trend Analysis 2025 & 2033
- Figure 110: Europe Cashew in Tanzania Market Volume Share (%), by Price Trend Analysis 2025 & 2033
- Figure 111: Europe Cashew in Tanzania Market Revenue (Million), by Production Analysis 2025 & 2033
- Figure 112: Europe Cashew in Tanzania Market Volume (Kiloton), by Production Analysis 2025 & 2033
- Figure 113: Europe Cashew in Tanzania Market Revenue Share (%), by Production Analysis 2025 & 2033
- Figure 114: Europe Cashew in Tanzania Market Volume Share (%), by Production Analysis 2025 & 2033
- Figure 115: Europe Cashew in Tanzania Market Revenue (Million), by Consumption Analysis (Volume and Value) 2025 & 2033
- Figure 116: Europe Cashew in Tanzania Market Volume (Kiloton), by Consumption Analysis (Volume and Value) 2025 & 2033
- Figure 117: Europe Cashew in Tanzania Market Revenue Share (%), by Consumption Analysis (Volume and Value) 2025 & 2033
- Figure 118: Europe Cashew in Tanzania Market Volume Share (%), by Consumption Analysis (Volume and Value) 2025 & 2033
- Figure 119: Europe Cashew in Tanzania Market Revenue (Million), by Import Market Analysis (Volume and Value) 2025 & 2033
- Figure 120: Europe Cashew in Tanzania Market Volume (Kiloton), by Import Market Analysis (Volume and Value) 2025 & 2033
- Figure 121: Europe Cashew in Tanzania Market Revenue Share (%), by Import Market Analysis (Volume and Value) 2025 & 2033
- Figure 122: Europe Cashew in Tanzania Market Volume Share (%), by Import Market Analysis (Volume and Value) 2025 & 2033
- Figure 123: Europe Cashew in Tanzania Market Revenue (Million), by Export Market Analysis (Volume and Value) 2025 & 2033
- Figure 124: Europe Cashew in Tanzania Market Volume (Kiloton), by Export Market Analysis (Volume and Value) 2025 & 2033
- Figure 125: Europe Cashew in Tanzania Market Revenue Share (%), by Export Market Analysis (Volume and Value) 2025 & 2033
- Figure 126: Europe Cashew in Tanzania Market Volume Share (%), by Export Market Analysis (Volume and Value) 2025 & 2033
- Figure 127: Europe Cashew in Tanzania Market Revenue (Million), by Price Trend Analysis 2025 & 2033
- Figure 128: Europe Cashew in Tanzania Market Volume (Kiloton), by Price Trend Analysis 2025 & 2033
- Figure 129: Europe Cashew in Tanzania Market Revenue Share (%), by Price Trend Analysis 2025 & 2033
- Figure 130: Europe Cashew in Tanzania Market Volume Share (%), by Price Trend Analysis 2025 & 2033
- Figure 131: Europe Cashew in Tanzania Market Revenue (Million), by Country 2025 & 2033
- Figure 132: Europe Cashew in Tanzania Market Volume (Kiloton), by Country 2025 & 2033
- Figure 133: Europe Cashew in Tanzania Market Revenue Share (%), by Country 2025 & 2033
- Figure 134: Europe Cashew in Tanzania Market Volume Share (%), by Country 2025 & 2033
- Figure 135: Middle East & Africa Cashew in Tanzania Market Revenue (Million), by Production Analysis 2025 & 2033
- Figure 136: Middle East & Africa Cashew in Tanzania Market Volume (Kiloton), by Production Analysis 2025 & 2033
- Figure 137: Middle East & Africa Cashew in Tanzania Market Revenue Share (%), by Production Analysis 2025 & 2033
- Figure 138: Middle East & Africa Cashew in Tanzania Market Volume Share (%), by Production Analysis 2025 & 2033
- Figure 139: Middle East & Africa Cashew in Tanzania Market Revenue (Million), by Consumption Analysis (Volume and Value) 2025 & 2033
- Figure 140: Middle East & Africa Cashew in Tanzania Market Volume (Kiloton), by Consumption Analysis (Volume and Value) 2025 & 2033
- Figure 141: Middle East & Africa Cashew in Tanzania Market Revenue Share (%), by Consumption Analysis (Volume and Value) 2025 & 2033
- Figure 142: Middle East & Africa Cashew in Tanzania Market Volume Share (%), by Consumption Analysis (Volume and Value) 2025 & 2033
- Figure 143: Middle East & Africa Cashew in Tanzania Market Revenue (Million), by Import Market Analysis (Volume and Value) 2025 & 2033
- Figure 144: Middle East & Africa Cashew in Tanzania Market Volume (Kiloton), by Import Market Analysis (Volume and Value) 2025 & 2033
- Figure 145: Middle East & Africa Cashew in Tanzania Market Revenue Share (%), by Import Market Analysis (Volume and Value) 2025 & 2033
- Figure 146: Middle East & Africa Cashew in Tanzania Market Volume Share (%), by Import Market Analysis (Volume and Value) 2025 & 2033
- Figure 147: Middle East & Africa Cashew in Tanzania Market Revenue (Million), by Export Market Analysis (Volume and Value) 2025 & 2033
- Figure 148: Middle East & Africa Cashew in Tanzania Market Volume (Kiloton), by Export Market Analysis (Volume and Value) 2025 & 2033
- Figure 149: Middle East & Africa Cashew in Tanzania Market Revenue Share (%), by Export Market Analysis (Volume and Value) 2025 & 2033
- Figure 150: Middle East & Africa Cashew in Tanzania Market Volume Share (%), by Export Market Analysis (Volume and Value) 2025 & 2033
- Figure 151: Middle East & Africa Cashew in Tanzania Market Revenue (Million), by Price Trend Analysis 2025 & 2033
- Figure 152: Middle East & Africa Cashew in Tanzania Market Volume (Kiloton), by Price Trend Analysis 2025 & 2033
- Figure 153: Middle East & Africa Cashew in Tanzania Market Revenue Share (%), by Price Trend Analysis 2025 & 2033
- Figure 154: Middle East & Africa Cashew in Tanzania Market Volume Share (%), by Price Trend Analysis 2025 & 2033
- Figure 155: Middle East & Africa Cashew in Tanzania Market Revenue (Million), by Production Analysis 2025 & 2033
- Figure 156: Middle East & Africa Cashew in Tanzania Market Volume (Kiloton), by Production Analysis 2025 & 2033
- Figure 157: Middle East & Africa Cashew in Tanzania Market Revenue Share (%), by Production Analysis 2025 & 2033
- Figure 158: Middle East & Africa Cashew in Tanzania Market Volume Share (%), by Production Analysis 2025 & 2033
- Figure 159: Middle East & Africa Cashew in Tanzania Market Revenue (Million), by Consumption Analysis (Volume and Value) 2025 & 2033
- Figure 160: Middle East & Africa Cashew in Tanzania Market Volume (Kiloton), by Consumption Analysis (Volume and Value) 2025 & 2033
- Figure 161: Middle East & Africa Cashew in Tanzania Market Revenue Share (%), by Consumption Analysis (Volume and Value) 2025 & 2033
- Figure 162: Middle East & Africa Cashew in Tanzania Market Volume Share (%), by Consumption Analysis (Volume and Value) 2025 & 2033
- Figure 163: Middle East & Africa Cashew in Tanzania Market Revenue (Million), by Import Market Analysis (Volume and Value) 2025 & 2033
- Figure 164: Middle East & Africa Cashew in Tanzania Market Volume (Kiloton), by Import Market Analysis (Volume and Value) 2025 & 2033
- Figure 165: Middle East & Africa Cashew in Tanzania Market Revenue Share (%), by Import Market Analysis (Volume and Value) 2025 & 2033
- Figure 166: Middle East & Africa Cashew in Tanzania Market Volume Share (%), by Import Market Analysis (Volume and Value) 2025 & 2033
- Figure 167: Middle East & Africa Cashew in Tanzania Market Revenue (Million), by Export Market Analysis (Volume and Value) 2025 & 2033
- Figure 168: Middle East & Africa Cashew in Tanzania Market Volume (Kiloton), by Export Market Analysis (Volume and Value) 2025 & 2033
- Figure 169: Middle East & Africa Cashew in Tanzania Market Revenue Share (%), by Export Market Analysis (Volume and Value) 2025 & 2033
- Figure 170: Middle East & Africa Cashew in Tanzania Market Volume Share (%), by Export Market Analysis (Volume and Value) 2025 & 2033
- Figure 171: Middle East & Africa Cashew in Tanzania Market Revenue (Million), by Price Trend Analysis 2025 & 2033
- Figure 172: Middle East & Africa Cashew in Tanzania Market Volume (Kiloton), by Price Trend Analysis 2025 & 2033
- Figure 173: Middle East & Africa Cashew in Tanzania Market Revenue Share (%), by Price Trend Analysis 2025 & 2033
- Figure 174: Middle East & Africa Cashew in Tanzania Market Volume Share (%), by Price Trend Analysis 2025 & 2033
- Figure 175: Middle East & Africa Cashew in Tanzania Market Revenue (Million), by Country 2025 & 2033
- Figure 176: Middle East & Africa Cashew in Tanzania Market Volume (Kiloton), by Country 2025 & 2033
- Figure 177: Middle East & Africa Cashew in Tanzania Market Revenue Share (%), by Country 2025 & 2033
- Figure 178: Middle East & Africa Cashew in Tanzania Market Volume Share (%), by Country 2025 & 2033
- Figure 179: Asia Pacific Cashew in Tanzania Market Revenue (Million), by Production Analysis 2025 & 2033
- Figure 180: Asia Pacific Cashew in Tanzania Market Volume (Kiloton), by Production Analysis 2025 & 2033
- Figure 181: Asia Pacific Cashew in Tanzania Market Revenue Share (%), by Production Analysis 2025 & 2033
- Figure 182: Asia Pacific Cashew in Tanzania Market Volume Share (%), by Production Analysis 2025 & 2033
- Figure 183: Asia Pacific Cashew in Tanzania Market Revenue (Million), by Consumption Analysis (Volume and Value) 2025 & 2033
- Figure 184: Asia Pacific Cashew in Tanzania Market Volume (Kiloton), by Consumption Analysis (Volume and Value) 2025 & 2033
- Figure 185: Asia Pacific Cashew in Tanzania Market Revenue Share (%), by Consumption Analysis (Volume and Value) 2025 & 2033
- Figure 186: Asia Pacific Cashew in Tanzania Market Volume Share (%), by Consumption Analysis (Volume and Value) 2025 & 2033
- Figure 187: Asia Pacific Cashew in Tanzania Market Revenue (Million), by Import Market Analysis (Volume and Value) 2025 & 2033
- Figure 188: Asia Pacific Cashew in Tanzania Market Volume (Kiloton), by Import Market Analysis (Volume and Value) 2025 & 2033
- Figure 189: Asia Pacific Cashew in Tanzania Market Revenue Share (%), by Import Market Analysis (Volume and Value) 2025 & 2033
- Figure 190: Asia Pacific Cashew in Tanzania Market Volume Share (%), by Import Market Analysis (Volume and Value) 2025 & 2033
- Figure 191: Asia Pacific Cashew in Tanzania Market Revenue (Million), by Export Market Analysis (Volume and Value) 2025 & 2033
- Figure 192: Asia Pacific Cashew in Tanzania Market Volume (Kiloton), by Export Market Analysis (Volume and Value) 2025 & 2033
- Figure 193: Asia Pacific Cashew in Tanzania Market Revenue Share (%), by Export Market Analysis (Volume and Value) 2025 & 2033
- Figure 194: Asia Pacific Cashew in Tanzania Market Volume Share (%), by Export Market Analysis (Volume and Value) 2025 & 2033
- Figure 195: Asia Pacific Cashew in Tanzania Market Revenue (Million), by Price Trend Analysis 2025 & 2033
- Figure 196: Asia Pacific Cashew in Tanzania Market Volume (Kiloton), by Price Trend Analysis 2025 & 2033
- Figure 197: Asia Pacific Cashew in Tanzania Market Revenue Share (%), by Price Trend Analysis 2025 & 2033
- Figure 198: Asia Pacific Cashew in Tanzania Market Volume Share (%), by Price Trend Analysis 2025 & 2033
- Figure 199: Asia Pacific Cashew in Tanzania Market Revenue (Million), by Production Analysis 2025 & 2033
- Figure 200: Asia Pacific Cashew in Tanzania Market Volume (Kiloton), by Production Analysis 2025 & 2033
- Figure 201: Asia Pacific Cashew in Tanzania Market Revenue Share (%), by Production Analysis 2025 & 2033
- Figure 202: Asia Pacific Cashew in Tanzania Market Volume Share (%), by Production Analysis 2025 & 2033
- Figure 203: Asia Pacific Cashew in Tanzania Market Revenue (Million), by Consumption Analysis (Volume and Value) 2025 & 2033
- Figure 204: Asia Pacific Cashew in Tanzania Market Volume (Kiloton), by Consumption Analysis (Volume and Value) 2025 & 2033
- Figure 205: Asia Pacific Cashew in Tanzania Market Revenue Share (%), by Consumption Analysis (Volume and Value) 2025 & 2033
- Figure 206: Asia Pacific Cashew in Tanzania Market Volume Share (%), by Consumption Analysis (Volume and Value) 2025 & 2033
- Figure 207: Asia Pacific Cashew in Tanzania Market Revenue (Million), by Import Market Analysis (Volume and Value) 2025 & 2033
- Figure 208: Asia Pacific Cashew in Tanzania Market Volume (Kiloton), by Import Market Analysis (Volume and Value) 2025 & 2033
- Figure 209: Asia Pacific Cashew in Tanzania Market Revenue Share (%), by Import Market Analysis (Volume and Value) 2025 & 2033
- Figure 210: Asia Pacific Cashew in Tanzania Market Volume Share (%), by Import Market Analysis (Volume and Value) 2025 & 2033
- Figure 211: Asia Pacific Cashew in Tanzania Market Revenue (Million), by Export Market Analysis (Volume and Value) 2025 & 2033
- Figure 212: Asia Pacific Cashew in Tanzania Market Volume (Kiloton), by Export Market Analysis (Volume and Value) 2025 & 2033
- Figure 213: Asia Pacific Cashew in Tanzania Market Revenue Share (%), by Export Market Analysis (Volume and Value) 2025 & 2033
- Figure 214: Asia Pacific Cashew in Tanzania Market Volume Share (%), by Export Market Analysis (Volume and Value) 2025 & 2033
- Figure 215: Asia Pacific Cashew in Tanzania Market Revenue (Million), by Price Trend Analysis 2025 & 2033
- Figure 216: Asia Pacific Cashew in Tanzania Market Volume (Kiloton), by Price Trend Analysis 2025 & 2033
- Figure 217: Asia Pacific Cashew in Tanzania Market Revenue Share (%), by Price Trend Analysis 2025 & 2033
- Figure 218: Asia Pacific Cashew in Tanzania Market Volume Share (%), by Price Trend Analysis 2025 & 2033
- Figure 219: Asia Pacific Cashew in Tanzania Market Revenue (Million), by Country 2025 & 2033
- Figure 220: Asia Pacific Cashew in Tanzania Market Volume (Kiloton), by Country 2025 & 2033
- Figure 221: Asia Pacific Cashew in Tanzania Market Revenue Share (%), by Country 2025 & 2033
- Figure 222: Asia Pacific Cashew in Tanzania Market Volume Share (%), by Country 2025 & 2033
List of Tables
- Table 1: Global Cashew in Tanzania Market Revenue Million Forecast, by Production Analysis 2020 & 2033
- Table 2: Global Cashew in Tanzania Market Volume Kiloton Forecast, by Production Analysis 2020 & 2033
- Table 3: Global Cashew in Tanzania Market Revenue Million Forecast, by Consumption Analysis (Volume and Value) 2020 & 2033
- Table 4: Global Cashew in Tanzania Market Volume Kiloton Forecast, by Consumption Analysis (Volume and Value) 2020 & 2033
- Table 5: Global Cashew in Tanzania Market Revenue Million Forecast, by Import Market Analysis (Volume and Value) 2020 & 2033
- Table 6: Global Cashew in Tanzania Market Volume Kiloton Forecast, by Import Market Analysis (Volume and Value) 2020 & 2033
- Table 7: Global Cashew in Tanzania Market Revenue Million Forecast, by Export Market Analysis (Volume and Value) 2020 & 2033
- Table 8: Global Cashew in Tanzania Market Volume Kiloton Forecast, by Export Market Analysis (Volume and Value) 2020 & 2033
- Table 9: Global Cashew in Tanzania Market Revenue Million Forecast, by Price Trend Analysis 2020 & 2033
- Table 10: Global Cashew in Tanzania Market Volume Kiloton Forecast, by Price Trend Analysis 2020 & 2033
- Table 11: Global Cashew in Tanzania Market Revenue Million Forecast, by Production Analysis 2020 & 2033
- Table 12: Global Cashew in Tanzania Market Volume Kiloton Forecast, by Production Analysis 2020 & 2033
- Table 13: Global Cashew in Tanzania Market Revenue Million Forecast, by Consumption Analysis (Volume and Value) 2020 & 2033
- Table 14: Global Cashew in Tanzania Market Volume Kiloton Forecast, by Consumption Analysis (Volume and Value) 2020 & 2033
- Table 15: Global Cashew in Tanzania Market Revenue Million Forecast, by Import Market Analysis (Volume and Value) 2020 & 2033
- Table 16: Global Cashew in Tanzania Market Volume Kiloton Forecast, by Import Market Analysis (Volume and Value) 2020 & 2033
- Table 17: Global Cashew in Tanzania Market Revenue Million Forecast, by Export Market Analysis (Volume and Value) 2020 & 2033
- Table 18: Global Cashew in Tanzania Market Volume Kiloton Forecast, by Export Market Analysis (Volume and Value) 2020 & 2033
- Table 19: Global Cashew in Tanzania Market Revenue Million Forecast, by Price Trend Analysis 2020 & 2033
- Table 20: Global Cashew in Tanzania Market Volume Kiloton Forecast, by Price Trend Analysis 2020 & 2033
- Table 21: Global Cashew in Tanzania Market Revenue Million Forecast, by Region 2020 & 2033
- Table 22: Global Cashew in Tanzania Market Volume Kiloton Forecast, by Region 2020 & 2033
- Table 23: Global Cashew in Tanzania Market Revenue Million Forecast, by Production Analysis 2020 & 2033
- Table 24: Global Cashew in Tanzania Market Volume Kiloton Forecast, by Production Analysis 2020 & 2033
- Table 25: Global Cashew in Tanzania Market Revenue Million Forecast, by Consumption Analysis (Volume and Value) 2020 & 2033
- Table 26: Global Cashew in Tanzania Market Volume Kiloton Forecast, by Consumption Analysis (Volume and Value) 2020 & 2033
- Table 27: Global Cashew in Tanzania Market Revenue Million Forecast, by Import Market Analysis (Volume and Value) 2020 & 2033
- Table 28: Global Cashew in Tanzania Market Volume Kiloton Forecast, by Import Market Analysis (Volume and Value) 2020 & 2033
- Table 29: Global Cashew in Tanzania Market Revenue Million Forecast, by Export Market Analysis (Volume and Value) 2020 & 2033
- Table 30: Global Cashew in Tanzania Market Volume Kiloton Forecast, by Export Market Analysis (Volume and Value) 2020 & 2033
- Table 31: Global Cashew in Tanzania Market Revenue Million Forecast, by Price Trend Analysis 2020 & 2033
- Table 32: Global Cashew in Tanzania Market Volume Kiloton Forecast, by Price Trend Analysis 2020 & 2033
- Table 33: Global Cashew in Tanzania Market Revenue Million Forecast, by Production Analysis 2020 & 2033
- Table 34: Global Cashew in Tanzania Market Volume Kiloton Forecast, by Production Analysis 2020 & 2033
- Table 35: Global Cashew in Tanzania Market Revenue Million Forecast, by Consumption Analysis (Volume and Value) 2020 & 2033
- Table 36: Global Cashew in Tanzania Market Volume Kiloton Forecast, by Consumption Analysis (Volume and Value) 2020 & 2033
- Table 37: Global Cashew in Tanzania Market Revenue Million Forecast, by Import Market Analysis (Volume and Value) 2020 & 2033
- Table 38: Global Cashew in Tanzania Market Volume Kiloton Forecast, by Import Market Analysis (Volume and Value) 2020 & 2033
- Table 39: Global Cashew in Tanzania Market Revenue Million Forecast, by Export Market Analysis (Volume and Value) 2020 & 2033
- Table 40: Global Cashew in Tanzania Market Volume Kiloton Forecast, by Export Market Analysis (Volume and Value) 2020 & 2033
- Table 41: Global Cashew in Tanzania Market Revenue Million Forecast, by Price Trend Analysis 2020 & 2033
- Table 42: Global Cashew in Tanzania Market Volume Kiloton Forecast, by Price Trend Analysis 2020 & 2033
- Table 43: Global Cashew in Tanzania Market Revenue Million Forecast, by Country 2020 & 2033
- Table 44: Global Cashew in Tanzania Market Volume Kiloton Forecast, by Country 2020 & 2033
- Table 45: United States Cashew in Tanzania Market Revenue (Million) Forecast, by Application 2020 & 2033
- Table 46: United States Cashew in Tanzania Market Volume (Kiloton) Forecast, by Application 2020 & 2033
- Table 47: Canada Cashew in Tanzania Market Revenue (Million) Forecast, by Application 2020 & 2033
- Table 48: Canada Cashew in Tanzania Market Volume (Kiloton) Forecast, by Application 2020 & 2033
- Table 49: Mexico Cashew in Tanzania Market Revenue (Million) Forecast, by Application 2020 & 2033
- Table 50: Mexico Cashew in Tanzania Market Volume (Kiloton) Forecast, by Application 2020 & 2033
- Table 51: Global Cashew in Tanzania Market Revenue Million Forecast, by Production Analysis 2020 & 2033
- Table 52: Global Cashew in Tanzania Market Volume Kiloton Forecast, by Production Analysis 2020 & 2033
- Table 53: Global Cashew in Tanzania Market Revenue Million Forecast, by Consumption Analysis (Volume and Value) 2020 & 2033
- Table 54: Global Cashew in Tanzania Market Volume Kiloton Forecast, by Consumption Analysis (Volume and Value) 2020 & 2033
- Table 55: Global Cashew in Tanzania Market Revenue Million Forecast, by Import Market Analysis (Volume and Value) 2020 & 2033
- Table 56: Global Cashew in Tanzania Market Volume Kiloton Forecast, by Import Market Analysis (Volume and Value) 2020 & 2033
- Table 57: Global Cashew in Tanzania Market Revenue Million Forecast, by Export Market Analysis (Volume and Value) 2020 & 2033
- Table 58: Global Cashew in Tanzania Market Volume Kiloton Forecast, by Export Market Analysis (Volume and Value) 2020 & 2033
- Table 59: Global Cashew in Tanzania Market Revenue Million Forecast, by Price Trend Analysis 2020 & 2033
- Table 60: Global Cashew in Tanzania Market Volume Kiloton Forecast, by Price Trend Analysis 2020 & 2033
- Table 61: Global Cashew in Tanzania Market Revenue Million Forecast, by Production Analysis 2020 & 2033
- Table 62: Global Cashew in Tanzania Market Volume Kiloton Forecast, by Production Analysis 2020 & 2033
- Table 63: Global Cashew in Tanzania Market Revenue Million Forecast, by Consumption Analysis (Volume and Value) 2020 & 2033
- Table 64: Global Cashew in Tanzania Market Volume Kiloton Forecast, by Consumption Analysis (Volume and Value) 2020 & 2033
- Table 65: Global Cashew in Tanzania Market Revenue Million Forecast, by Import Market Analysis (Volume and Value) 2020 & 2033
- Table 66: Global Cashew in Tanzania Market Volume Kiloton Forecast, by Import Market Analysis (Volume and Value) 2020 & 2033
- Table 67: Global Cashew in Tanzania Market Revenue Million Forecast, by Export Market Analysis (Volume and Value) 2020 & 2033
- Table 68: Global Cashew in Tanzania Market Volume Kiloton Forecast, by Export Market Analysis (Volume and Value) 2020 & 2033
- Table 69: Global Cashew in Tanzania Market Revenue Million Forecast, by Price Trend Analysis 2020 & 2033
- Table 70: Global Cashew in Tanzania Market Volume Kiloton Forecast, by Price Trend Analysis 2020 & 2033
- Table 71: Global Cashew in Tanzania Market Revenue Million Forecast, by Country 2020 & 2033
- Table 72: Global Cashew in Tanzania Market Volume Kiloton Forecast, by Country 2020 & 2033
- Table 73: Brazil Cashew in Tanzania Market Revenue (Million) Forecast, by Application 2020 & 2033
- Table 74: Brazil Cashew in Tanzania Market Volume (Kiloton) Forecast, by Application 2020 & 2033
- Table 75: Argentina Cashew in Tanzania Market Revenue (Million) Forecast, by Application 2020 & 2033
- Table 76: Argentina Cashew in Tanzania Market Volume (Kiloton) Forecast, by Application 2020 & 2033
- Table 77: Rest of South America Cashew in Tanzania Market Revenue (Million) Forecast, by Application 2020 & 2033
- Table 78: Rest of South America Cashew in Tanzania Market Volume (Kiloton) Forecast, by Application 2020 & 2033
- Table 79: Global Cashew in Tanzania Market Revenue Million Forecast, by Production Analysis 2020 & 2033
- Table 80: Global Cashew in Tanzania Market Volume Kiloton Forecast, by Production Analysis 2020 & 2033
- Table 81: Global Cashew in Tanzania Market Revenue Million Forecast, by Consumption Analysis (Volume and Value) 2020 & 2033
- Table 82: Global Cashew in Tanzania Market Volume Kiloton Forecast, by Consumption Analysis (Volume and Value) 2020 & 2033
- Table 83: Global Cashew in Tanzania Market Revenue Million Forecast, by Import Market Analysis (Volume and Value) 2020 & 2033
- Table 84: Global Cashew in Tanzania Market Volume Kiloton Forecast, by Import Market Analysis (Volume and Value) 2020 & 2033
- Table 85: Global Cashew in Tanzania Market Revenue Million Forecast, by Export Market Analysis (Volume and Value) 2020 & 2033
- Table 86: Global Cashew in Tanzania Market Volume Kiloton Forecast, by Export Market Analysis (Volume and Value) 2020 & 2033
- Table 87: Global Cashew in Tanzania Market Revenue Million Forecast, by Price Trend Analysis 2020 & 2033
- Table 88: Global Cashew in Tanzania Market Volume Kiloton Forecast, by Price Trend Analysis 2020 & 2033
- Table 89: Global Cashew in Tanzania Market Revenue Million Forecast, by Production Analysis 2020 & 2033
- Table 90: Global Cashew in Tanzania Market Volume Kiloton Forecast, by Production Analysis 2020 & 2033
- Table 91: Global Cashew in Tanzania Market Revenue Million Forecast, by Consumption Analysis (Volume and Value) 2020 & 2033
- Table 92: Global Cashew in Tanzania Market Volume Kiloton Forecast, by Consumption Analysis (Volume and Value) 2020 & 2033
- Table 93: Global Cashew in Tanzania Market Revenue Million Forecast, by Import Market Analysis (Volume and Value) 2020 & 2033
- Table 94: Global Cashew in Tanzania Market Volume Kiloton Forecast, by Import Market Analysis (Volume and Value) 2020 & 2033
- Table 95: Global Cashew in Tanzania Market Revenue Million Forecast, by Export Market Analysis (Volume and Value) 2020 & 2033
- Table 96: Global Cashew in Tanzania Market Volume Kiloton Forecast, by Export Market Analysis (Volume and Value) 2020 & 2033
- Table 97: Global Cashew in Tanzania Market Revenue Million Forecast, by Price Trend Analysis 2020 & 2033
- Table 98: Global Cashew in Tanzania Market Volume Kiloton Forecast, by Price Trend Analysis 2020 & 2033
- Table 99: Global Cashew in Tanzania Market Revenue Million Forecast, by Country 2020 & 2033
- Table 100: Global Cashew in Tanzania Market Volume Kiloton Forecast, by Country 2020 & 2033
- Table 101: United Kingdom Cashew in Tanzania Market Revenue (Million) Forecast, by Application 2020 & 2033
- Table 102: United Kingdom Cashew in Tanzania Market Volume (Kiloton) Forecast, by Application 2020 & 2033
- Table 103: Germany Cashew in Tanzania Market Revenue (Million) Forecast, by Application 2020 & 2033
- Table 104: Germany Cashew in Tanzania Market Volume (Kiloton) Forecast, by Application 2020 & 2033
- Table 105: France Cashew in Tanzania Market Revenue (Million) Forecast, by Application 2020 & 2033
- Table 106: France Cashew in Tanzania Market Volume (Kiloton) Forecast, by Application 2020 & 2033
- Table 107: Italy Cashew in Tanzania Market Revenue (Million) Forecast, by Application 2020 & 2033
- Table 108: Italy Cashew in Tanzania Market Volume (Kiloton) Forecast, by Application 2020 & 2033
- Table 109: Spain Cashew in Tanzania Market Revenue (Million) Forecast, by Application 2020 & 2033
- Table 110: Spain Cashew in Tanzania Market Volume (Kiloton) Forecast, by Application 2020 & 2033
- Table 111: Russia Cashew in Tanzania Market Revenue (Million) Forecast, by Application 2020 & 2033
- Table 112: Russia Cashew in Tanzania Market Volume (Kiloton) Forecast, by Application 2020 & 2033
- Table 113: Benelux Cashew in Tanzania Market Revenue (Million) Forecast, by Application 2020 & 2033
- Table 114: Benelux Cashew in Tanzania Market Volume (Kiloton) Forecast, by Application 2020 & 2033
- Table 115: Nordics Cashew in Tanzania Market Revenue (Million) Forecast, by Application 2020 & 2033
- Table 116: Nordics Cashew in Tanzania Market Volume (Kiloton) Forecast, by Application 2020 & 2033
- Table 117: Rest of Europe Cashew in Tanzania Market Revenue (Million) Forecast, by Application 2020 & 2033
- Table 118: Rest of Europe Cashew in Tanzania Market Volume (Kiloton) Forecast, by Application 2020 & 2033
- Table 119: Global Cashew in Tanzania Market Revenue Million Forecast, by Production Analysis 2020 & 2033
- Table 120: Global Cashew in Tanzania Market Volume Kiloton Forecast, by Production Analysis 2020 & 2033
- Table 121: Global Cashew in Tanzania Market Revenue Million Forecast, by Consumption Analysis (Volume and Value) 2020 & 2033
- Table 122: Global Cashew in Tanzania Market Volume Kiloton Forecast, by Consumption Analysis (Volume and Value) 2020 & 2033
- Table 123: Global Cashew in Tanzania Market Revenue Million Forecast, by Import Market Analysis (Volume and Value) 2020 & 2033
- Table 124: Global Cashew in Tanzania Market Volume Kiloton Forecast, by Import Market Analysis (Volume and Value) 2020 & 2033
- Table 125: Global Cashew in Tanzania Market Revenue Million Forecast, by Export Market Analysis (Volume and Value) 2020 & 2033
- Table 126: Global Cashew in Tanzania Market Volume Kiloton Forecast, by Export Market Analysis (Volume and Value) 2020 & 2033
- Table 127: Global Cashew in Tanzania Market Revenue Million Forecast, by Price Trend Analysis 2020 & 2033
- Table 128: Global Cashew in Tanzania Market Volume Kiloton Forecast, by Price Trend Analysis 2020 & 2033
- Table 129: Global Cashew in Tanzania Market Revenue Million Forecast, by Production Analysis 2020 & 2033
- Table 130: Global Cashew in Tanzania Market Volume Kiloton Forecast, by Production Analysis 2020 & 2033
- Table 131: Global Cashew in Tanzania Market Revenue Million Forecast, by Consumption Analysis (Volume and Value) 2020 & 2033
- Table 132: Global Cashew in Tanzania Market Volume Kiloton Forecast, by Consumption Analysis (Volume and Value) 2020 & 2033
- Table 133: Global Cashew in Tanzania Market Revenue Million Forecast, by Import Market Analysis (Volume and Value) 2020 & 2033
- Table 134: Global Cashew in Tanzania Market Volume Kiloton Forecast, by Import Market Analysis (Volume and Value) 2020 & 2033
- Table 135: Global Cashew in Tanzania Market Revenue Million Forecast, by Export Market Analysis (Volume and Value) 2020 & 2033
- Table 136: Global Cashew in Tanzania Market Volume Kiloton Forecast, by Export Market Analysis (Volume and Value) 2020 & 2033
- Table 137: Global Cashew in Tanzania Market Revenue Million Forecast, by Price Trend Analysis 2020 & 2033
- Table 138: Global Cashew in Tanzania Market Volume Kiloton Forecast, by Price Trend Analysis 2020 & 2033
- Table 139: Global Cashew in Tanzania Market Revenue Million Forecast, by Country 2020 & 2033
- Table 140: Global Cashew in Tanzania Market Volume Kiloton Forecast, by Country 2020 & 2033
- Table 141: Turkey Cashew in Tanzania Market Revenue (Million) Forecast, by Application 2020 & 2033
- Table 142: Turkey Cashew in Tanzania Market Volume (Kiloton) Forecast, by Application 2020 & 2033
- Table 143: Israel Cashew in Tanzania Market Revenue (Million) Forecast, by Application 2020 & 2033
- Table 144: Israel Cashew in Tanzania Market Volume (Kiloton) Forecast, by Application 2020 & 2033
- Table 145: GCC Cashew in Tanzania Market Revenue (Million) Forecast, by Application 2020 & 2033
- Table 146: GCC Cashew in Tanzania Market Volume (Kiloton) Forecast, by Application 2020 & 2033
- Table 147: North Africa Cashew in Tanzania Market Revenue (Million) Forecast, by Application 2020 & 2033
- Table 148: North Africa Cashew in Tanzania Market Volume (Kiloton) Forecast, by Application 2020 & 2033
- Table 149: South Africa Cashew in Tanzania Market Revenue (Million) Forecast, by Application 2020 & 2033
- Table 150: South Africa Cashew in Tanzania Market Volume (Kiloton) Forecast, by Application 2020 & 2033
- Table 151: Rest of Middle East & Africa Cashew in Tanzania Market Revenue (Million) Forecast, by Application 2020 & 2033
- Table 152: Rest of Middle East & Africa Cashew in Tanzania Market Volume (Kiloton) Forecast, by Application 2020 & 2033
- Table 153: Global Cashew in Tanzania Market Revenue Million Forecast, by Production Analysis 2020 & 2033
- Table 154: Global Cashew in Tanzania Market Volume Kiloton Forecast, by Production Analysis 2020 & 2033
- Table 155: Global Cashew in Tanzania Market Revenue Million Forecast, by Consumption Analysis (Volume and Value) 2020 & 2033
- Table 156: Global Cashew in Tanzania Market Volume Kiloton Forecast, by Consumption Analysis (Volume and Value) 2020 & 2033
- Table 157: Global Cashew in Tanzania Market Revenue Million Forecast, by Import Market Analysis (Volume and Value) 2020 & 2033
- Table 158: Global Cashew in Tanzania Market Volume Kiloton Forecast, by Import Market Analysis (Volume and Value) 2020 & 2033
- Table 159: Global Cashew in Tanzania Market Revenue Million Forecast, by Export Market Analysis (Volume and Value) 2020 & 2033
- Table 160: Global Cashew in Tanzania Market Volume Kiloton Forecast, by Export Market Analysis (Volume and Value) 2020 & 2033
- Table 161: Global Cashew in Tanzania Market Revenue Million Forecast, by Price Trend Analysis 2020 & 2033
- Table 162: Global Cashew in Tanzania Market Volume Kiloton Forecast, by Price Trend Analysis 2020 & 2033
- Table 163: Global Cashew in Tanzania Market Revenue Million Forecast, by Production Analysis 2020 & 2033
- Table 164: Global Cashew in Tanzania Market Volume Kiloton Forecast, by Production Analysis 2020 & 2033
- Table 165: Global Cashew in Tanzania Market Revenue Million Forecast, by Consumption Analysis (Volume and Value) 2020 & 2033
- Table 166: Global Cashew in Tanzania Market Volume Kiloton Forecast, by Consumption Analysis (Volume and Value) 2020 & 2033
- Table 167: Global Cashew in Tanzania Market Revenue Million Forecast, by Import Market Analysis (Volume and Value) 2020 & 2033
- Table 168: Global Cashew in Tanzania Market Volume Kiloton Forecast, by Import Market Analysis (Volume and Value) 2020 & 2033
- Table 169: Global Cashew in Tanzania Market Revenue Million Forecast, by Export Market Analysis (Volume and Value) 2020 & 2033
- Table 170: Global Cashew in Tanzania Market Volume Kiloton Forecast, by Export Market Analysis (Volume and Value) 2020 & 2033
- Table 171: Global Cashew in Tanzania Market Revenue Million Forecast, by Price Trend Analysis 2020 & 2033
- Table 172: Global Cashew in Tanzania Market Volume Kiloton Forecast, by Price Trend Analysis 2020 & 2033
- Table 173: Global Cashew in Tanzania Market Revenue Million Forecast, by Country 2020 & 2033
- Table 174: Global Cashew in Tanzania Market Volume Kiloton Forecast, by Country 2020 & 2033
- Table 175: China Cashew in Tanzania Market Revenue (Million) Forecast, by Application 2020 & 2033
- Table 176: China Cashew in Tanzania Market Volume (Kiloton) Forecast, by Application 2020 & 2033
- Table 177: India Cashew in Tanzania Market Revenue (Million) Forecast, by Application 2020 & 2033
- Table 178: India Cashew in Tanzania Market Volume (Kiloton) Forecast, by Application 2020 & 2033
- Table 179: Japan Cashew in Tanzania Market Revenue (Million) Forecast, by Application 2020 & 2033
- Table 180: Japan Cashew in Tanzania Market Volume (Kiloton) Forecast, by Application 2020 & 2033
- Table 181: South Korea Cashew in Tanzania Market Revenue (Million) Forecast, by Application 2020 & 2033
- Table 182: South Korea Cashew in Tanzania Market Volume (Kiloton) Forecast, by Application 2020 & 2033
- Table 183: ASEAN Cashew in Tanzania Market Revenue (Million) Forecast, by Application 2020 & 2033
- Table 184: ASEAN Cashew in Tanzania Market Volume (Kiloton) Forecast, by Application 2020 & 2033
- Table 185: Oceania Cashew in Tanzania Market Revenue (Million) Forecast, by Application 2020 & 2033
- Table 186: Oceania Cashew in Tanzania Market Volume (Kiloton) Forecast, by Application 2020 & 2033
- Table 187: Rest of Asia Pacific Cashew in Tanzania Market Revenue (Million) Forecast, by Application 2020 & 2033
- Table 188: Rest of Asia Pacific Cashew in Tanzania Market Volume (Kiloton) Forecast, by Application 2020 & 2033
Frequently Asked Questions
1. What is the projected Compound Annual Growth Rate (CAGR) of the Cashew in Tanzania Market?
The projected CAGR is approximately 4.48%.
2. Which companies are prominent players in the Cashew in Tanzania Market?
Key companies in the market include Olam International , Cashewnut Company Ltd , Louis Dreyfus Company, Olam International , Mtwara Cashewnut Processors Limited , Bunge Limited , Tanzania Cashewnut Board , ADM (Archer Daniels Midland Company) , Export Trading Group , Cargill .
3. What are the main segments of the Cashew in Tanzania Market?
The market segments include Production Analysis, Consumption Analysis (Volume and Value), Import Market Analysis (Volume and Value), Export Market Analysis (Volume and Value), Price Trend Analysis, Production Analysis, Consumption Analysis (Volume and Value), Import Market Analysis (Volume and Value), Export Market Analysis (Volume and Value), Price Trend Analysis.
4. Can you provide details about the market size?
The market size is estimated to be USD 690.97 Million as of 2022.
5. What are some drivers contributing to market growth?
N/A
6. What are the notable trends driving market growth?
Increasing Government Support and Growing Production Driving the Market.
7. Are there any restraints impacting market growth?
N/A
8. Can you provide examples of recent developments in the market?
July 2022: Tanzania Investment Center (TIC) revealed that the government of Tanzania is planning to construct cashew nut processing factories in Tanzania in collaboration with local investors to supply value-added cashew nuts in the international market to earn high export value and create employment opportunities for the Tanzanian people.
9. What pricing options are available for accessing the report?
Pricing options include single-user, multi-user, and enterprise licenses priced at USD 3800, USD 4500, and USD 5800 respectively.
10. Is the market size provided in terms of value or volume?
The market size is provided in terms of value, measured in Million and volume, measured in Kiloton.
11. Are there any specific market keywords associated with the report?
Yes, the market keyword associated with the report is "Cashew in Tanzania Market," which aids in identifying and referencing the specific market segment covered.
12. How do I determine which pricing option suits my needs best?
The pricing options vary based on user requirements and access needs. Individual users may opt for single-user licenses, while businesses requiring broader access may choose multi-user or enterprise licenses for cost-effective access to the report.
13. Are there any additional resources or data provided in the Cashew in Tanzania Market report?
While the report offers comprehensive insights, it's advisable to review the specific contents or supplementary materials provided to ascertain if additional resources or data are available.
14. How can I stay updated on further developments or reports in the Cashew in Tanzania Market?
To stay informed about further developments, trends, and reports in the Cashew in Tanzania Market, consider subscribing to industry newsletters, following relevant companies and organizations, or regularly checking reputable industry news sources and publications.
Methodology
Step 1 - Identification of Relevant Samples Size from Population Database


Step 2 - Approaches for Defining Global Market Size (Value, Volume* & Price*)

Note*: In applicable scenarios
Step 3 - Data Sources
Primary Research
- Web Analytics
- Survey Reports
- Research Institute
- Latest Research Reports
- Opinion Leaders
Secondary Research
- Annual Reports
- White Paper
- Latest Press Release
- Industry Association
- Paid Database
- Investor Presentations

Step 4 - Data Triangulation
Involves using different sources of information in order to increase the validity of a study
These sources are likely to be stakeholders in a program - participants, other researchers, program staff, other community members, and so on.
Then we put all data in single framework & apply various statistical tools to find out the dynamic on the market.
During the analysis stage, feedback from the stakeholder groups would be compared to determine areas of agreement as well as areas of divergence