

Key Insights
The global Cash Counter market is poised for significant expansion, projected to reach an impressive $7.1 billion by 2025. This robust growth is driven by a compelling CAGR of 13.6% throughout the forecast period of 2025-2033. The increasing volume of cash transactions across various sectors, coupled with the escalating need for efficient and accurate currency handling, forms the bedrock of this market's upward trajectory. Key applications are predominantly found in casinos, retail establishments, and the BFSI (Banking, Financial Services, and Insurance) sector, where the speed and precision offered by advanced cash counting solutions are paramount. Furthermore, the market is witnessing a growing demand for both single and double-pocket cash counters, catering to diverse operational requirements and transaction volumes. Innovations in technology, including enhanced counterfeit detection, smart sorting capabilities, and improved user interfaces, are also fueling adoption and market value.
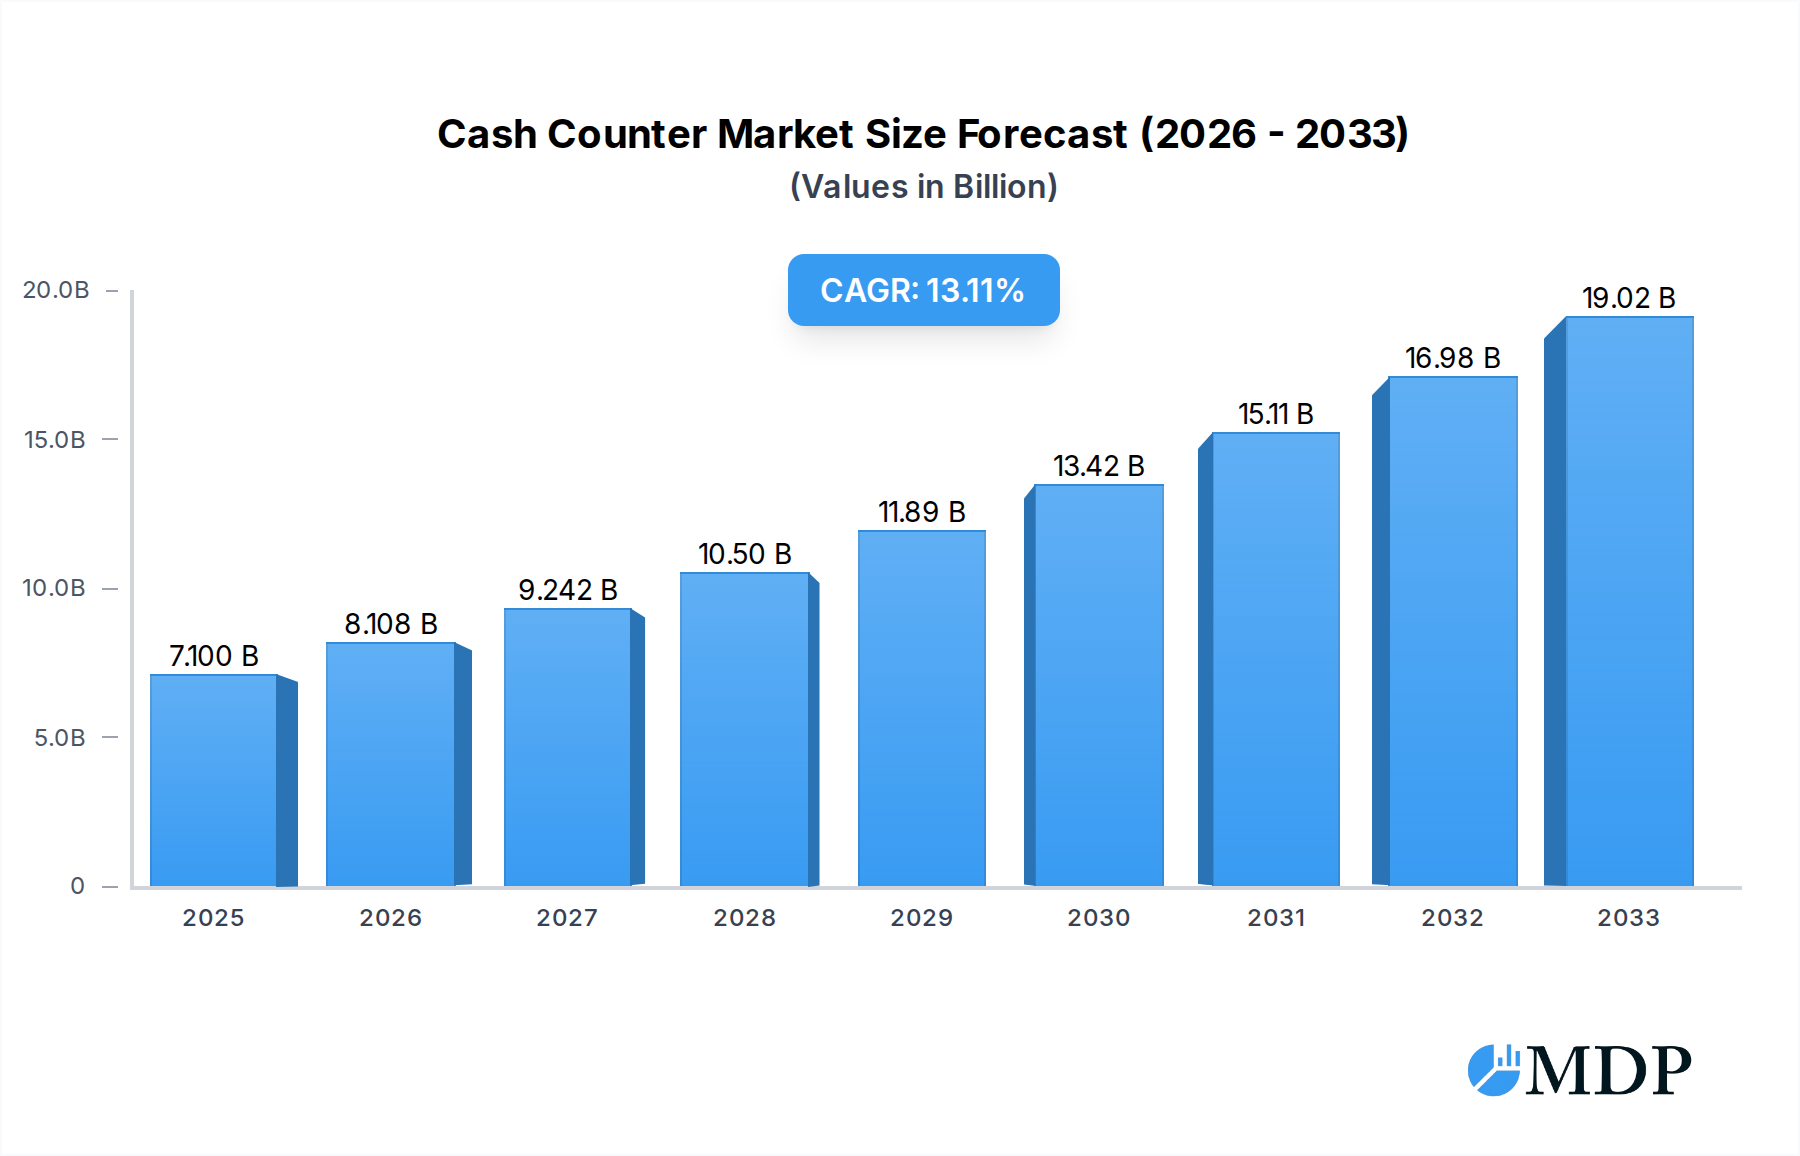
Cash Counter Market Size (In Billion)
The dynamic cash handling ecosystem is further shaped by several critical trends and drivers. The persistent need for enhanced security and fraud prevention in financial operations directly translates to increased investment in sophisticated cash counting machines. In emerging economies, the formalization of financial systems and the rise of digital payment integration alongside traditional cash management necessitate more advanced counting technologies. While the market demonstrates strong momentum, certain restraints, such as the initial capital investment for high-end machines and the increasing adoption of cashless transactions in specific demographics, present ongoing challenges. However, the sheer volume of cash still circulating globally, particularly in retail and financial institutions, ensures a sustained demand for reliable cash counting solutions. Companies like Giesecke & Devrient, Glory Global Solutions, and Cummins Allison are at the forefront, innovating and competing to capture market share by offering advanced features and catering to evolving customer needs.

Cash Counter Company Market Share
Unlock unparalleled insights into the global cash counter market with this definitive report. Spanning from 2019 to 2033, with a base and estimated year of 2025, this comprehensive analysis delves deep into market dynamics, industry trends, leading segments, and strategic opportunities. We examine critical factors influencing the cash counting machine industry, including technological advancements, regulatory landscapes, and evolving end-user preferences across key applications like Casino, Retail, and BFSI. Discover the dominance of specific market types, such as Single Pocket and Double Pocket cash counters, and understand the strategies of industry leaders like Giesecke & Devrient, Glory Global Solutions, and Royal Sovereign. This report provides actionable intelligence for stakeholders seeking to capitalize on the projected billion-dollar growth and navigate the evolving competitive environment of the cash counter sector.
Cash Counter Market Dynamics & Concentration
The global cash counter market exhibits a moderate level of concentration, with key players like Giesecke & Devrient and Glory Global Solutions holding significant market share, estimated to be in the billions of dollars. Innovation drivers are primarily centered around enhanced accuracy, speed, and counterfeit detection capabilities, fueled by advancements in artificial intelligence and machine learning algorithms. Regulatory frameworks, particularly concerning currency handling and anti-money laundering (AML) compliance, play a crucial role in shaping product development and market entry. Product substitutes, though limited in direct functionality, include advanced POS systems with integrated cash management features. End-user trends reveal a growing demand for automated and secure cash handling solutions across all sectors. Mergers and acquisitions (M&A) activity is present, with an estimated number of key deals in the tens of billions of dollars, indicating strategic consolidation and a drive for market expansion.
- Market Share Dominance: Key players command a substantial portion of the multi-billion dollar market.
- Innovation Focus: Increased accuracy, speed, and sophisticated counterfeit detection.
- Regulatory Impact: AML compliance and currency handling regulations are paramount.
- End-User Demand: Automation and security in cash handling are critical.
- M&A Activity: Strategic acquisitions to bolster market presence and technological capabilities.
Cash Counter Industry Trends & Analysis
The cash counter industry is poised for substantial growth, driven by an escalating need for efficient and secure cash management solutions across diverse sectors. The compound annual growth rate (CAGR) is projected to be in the high single digits, translating into a multi-billion dollar market expansion by 2033. Technological disruptions are at the forefront, with the integration of AI for superior counterfeit detection, self-learning algorithms for enhanced accuracy, and IoT capabilities for real-time monitoring and data analytics. Consumer preferences are shifting towards devices offering seamless integration with existing financial systems, user-friendly interfaces, and robust security features to mitigate risks associated with cash handling. The competitive dynamics are characterized by intense product differentiation, with companies focusing on specialized features and niche market penetration. Market penetration is steadily increasing, particularly in emerging economies where the adoption of formal cash management practices is gaining momentum, leading to an estimated market penetration of over xx percent by 2033. The industry is witnessing a continuous push for miniaturization and increased portability, catering to the evolving needs of mobile banking and on-the-go transactions. Furthermore, the emphasis on data security and privacy in cash handling operations is becoming a critical factor influencing purchasing decisions.
Leading Markets & Segments in Cash Counter
The Casino application segment stands out as a dominant force in the global cash counter market, driven by the high volume of cash transactions and stringent regulatory requirements for accuracy and security. The BFSI sector also represents a significant market due to the imperative for secure and efficient cash processing in banking operations and financial institutions. Retail, while a substantial segment, is experiencing a more gradual but steady adoption of advanced cash counting solutions.
Within the Types of cash counters, Double Pocket machines are gaining traction due to their ability to sort and count mixed denominations simultaneously, significantly enhancing operational efficiency for high-volume users.
- Dominant Region: North America and Europe currently lead the market due to established financial infrastructure and high adoption rates of advanced cash handling technologies, with an estimated market value in the billions.
- Key Drivers in Casino:
- High volume of cash transactions necessitating rapid and accurate counting.
- Strict regulatory compliance for preventing fraud and ensuring transparency.
- Demand for sophisticated counterfeit detection to safeguard revenue.
- Need for efficient cash sorting and denomination management.
- Key Drivers in BFSI:
- Secure handling of customer deposits and withdrawals.
- Streamlining of back-office cash processing operations.
- Adherence to anti-money laundering (AML) and Know Your Customer (KYC) regulations.
- Integration with core banking systems for seamless data flow.
- Dominance of Double Pocket Counters:
- Enhanced speed and efficiency for mixed denomination counting.
- Reduced manual labor and operational costs.
- Improved accuracy by eliminating the need for manual denomination sorting.
- Ideal for high-transaction environments like casinos and large retail outlets.
Cash Counter Product Developments
Recent product developments in the cash counter market are heavily influenced by technological advancements, aiming to enhance speed, accuracy, and security. Innovations include AI-powered counterfeit detection systems that can identify even sophisticated fakes with remarkable precision, and smart counting features that can automatically sort and stack different denominations. Companies are also focusing on developing compact and portable cash counters with user-friendly interfaces, catering to the growing demand for flexibility. The competitive advantage lies in offering solutions that seamlessly integrate with digital payment systems and provide detailed transaction analytics, thereby meeting the evolving needs of businesses in the Casino, Retail, and BFSI sectors.
Key Drivers of Cash Counter Growth
The cash counter market is propelled by several key drivers, including the increasing volume of cash transactions globally, the persistent need for enhanced security and fraud prevention, and the growing adoption of automation in financial operations. Technological advancements, such as the integration of AI for superior counterfeit detection and self-learning algorithms for improved accuracy, are significantly boosting market growth. Favorable regulatory frameworks that mandate secure cash handling practices also contribute to increased demand. Furthermore, the expansion of the retail and BFSI sectors, particularly in emerging economies, is creating new opportunities for cash counter manufacturers.
Challenges in the Cash Counter Market
Despite robust growth prospects, the cash counter market faces several challenges. Stringent regulatory hurdles and compliance requirements can increase development costs and time-to-market for new products. Supply chain disruptions, as evidenced by recent global events, can impact manufacturing and delivery timelines, leading to potential revenue losses. Intense competitive pressures, with numerous players vying for market share, often lead to price wars and pressure on profit margins. Furthermore, the increasing trend towards digital payments, while not eliminating cash entirely, may temper the growth rate in certain consumer segments, presenting a long-term restraint.
Emerging Opportunities in Cash Counter
Emerging opportunities in the cash counter market are largely driven by technological breakthroughs and strategic market expansion. The development of more sophisticated counterfeit detection technologies, incorporating advanced imaging and AI, presents a significant growth catalyst. Strategic partnerships between cash counter manufacturers and software providers for integrated cash management solutions are creating new revenue streams. Furthermore, the untapped potential in emerging economies, where formal cash management practices are still evolving, offers substantial market expansion opportunities. The increasing demand for smart, connected devices that offer real-time data analytics and remote monitoring capabilities is another key area for future growth.
Leading Players in the Cash Counter Sector
- Giesecke & Devrient
- Glory Global Solutions
- Royal Sovereign
- Billcon
- Cassida
- Cummins Allison
- Liaoning Julong Financial Equipment
- Laurel Bank Machines
- Semacon
Key Milestones in Cash Counter Industry
- 2019: Introduction of AI-powered counterfeit detection in high-end models.
- 2020: Increased adoption of IoT features for remote monitoring and diagnostics.
- 2021: Significant focus on developing compact and portable cash counters for mobile businesses.
- 2022: Emergence of advanced sorting and bundling capabilities in double-pocket machines.
- 2023: Growing emphasis on integration with cloud-based cash management software.
- 2024: Enhanced data analytics features for transaction traceability and reporting.
- 2025 (Estimated): Further advancements in AI for real-time threat analysis of counterfeit currency.
Strategic Outlook for Cash Counter Market
The strategic outlook for the cash counter market remains exceptionally positive, driven by ongoing technological innovation and the persistent global reliance on cash. Growth accelerators include the continuous refinement of AI and machine learning for superior counterfeit detection and predictive maintenance, alongside the development of increasingly integrated solutions that connect cash counters with broader financial management systems. The expansion into emerging markets, coupled with strategic partnerships, will be crucial for sustained growth. The market's ability to adapt to evolving security standards and deliver user-centric, efficient, and secure cash handling solutions will define its trajectory towards a multi-billion dollar future.
Cash Counter Segmentation
-
1. Application
- 1.1. Casino
- 1.2. Retail
- 1.3. BFSI
-
2. Types
- 2.1. Single Pocket
- 2.2. Double Pocket
Cash Counter Segmentation By Geography
-
1. North America
- 1.1. United States
- 1.2. Canada
- 1.3. Mexico
-
2. South America
- 2.1. Brazil
- 2.2. Argentina
- 2.3. Rest of South America
-
3. Europe
- 3.1. United Kingdom
- 3.2. Germany
- 3.3. France
- 3.4. Italy
- 3.5. Spain
- 3.6. Russia
- 3.7. Benelux
- 3.8. Nordics
- 3.9. Rest of Europe
-
4. Middle East & Africa
- 4.1. Turkey
- 4.2. Israel
- 4.3. GCC
- 4.4. North Africa
- 4.5. South Africa
- 4.6. Rest of Middle East & Africa
-
5. Asia Pacific
- 5.1. China
- 5.2. India
- 5.3. Japan
- 5.4. South Korea
- 5.5. ASEAN
- 5.6. Oceania
- 5.7. Rest of Asia Pacific
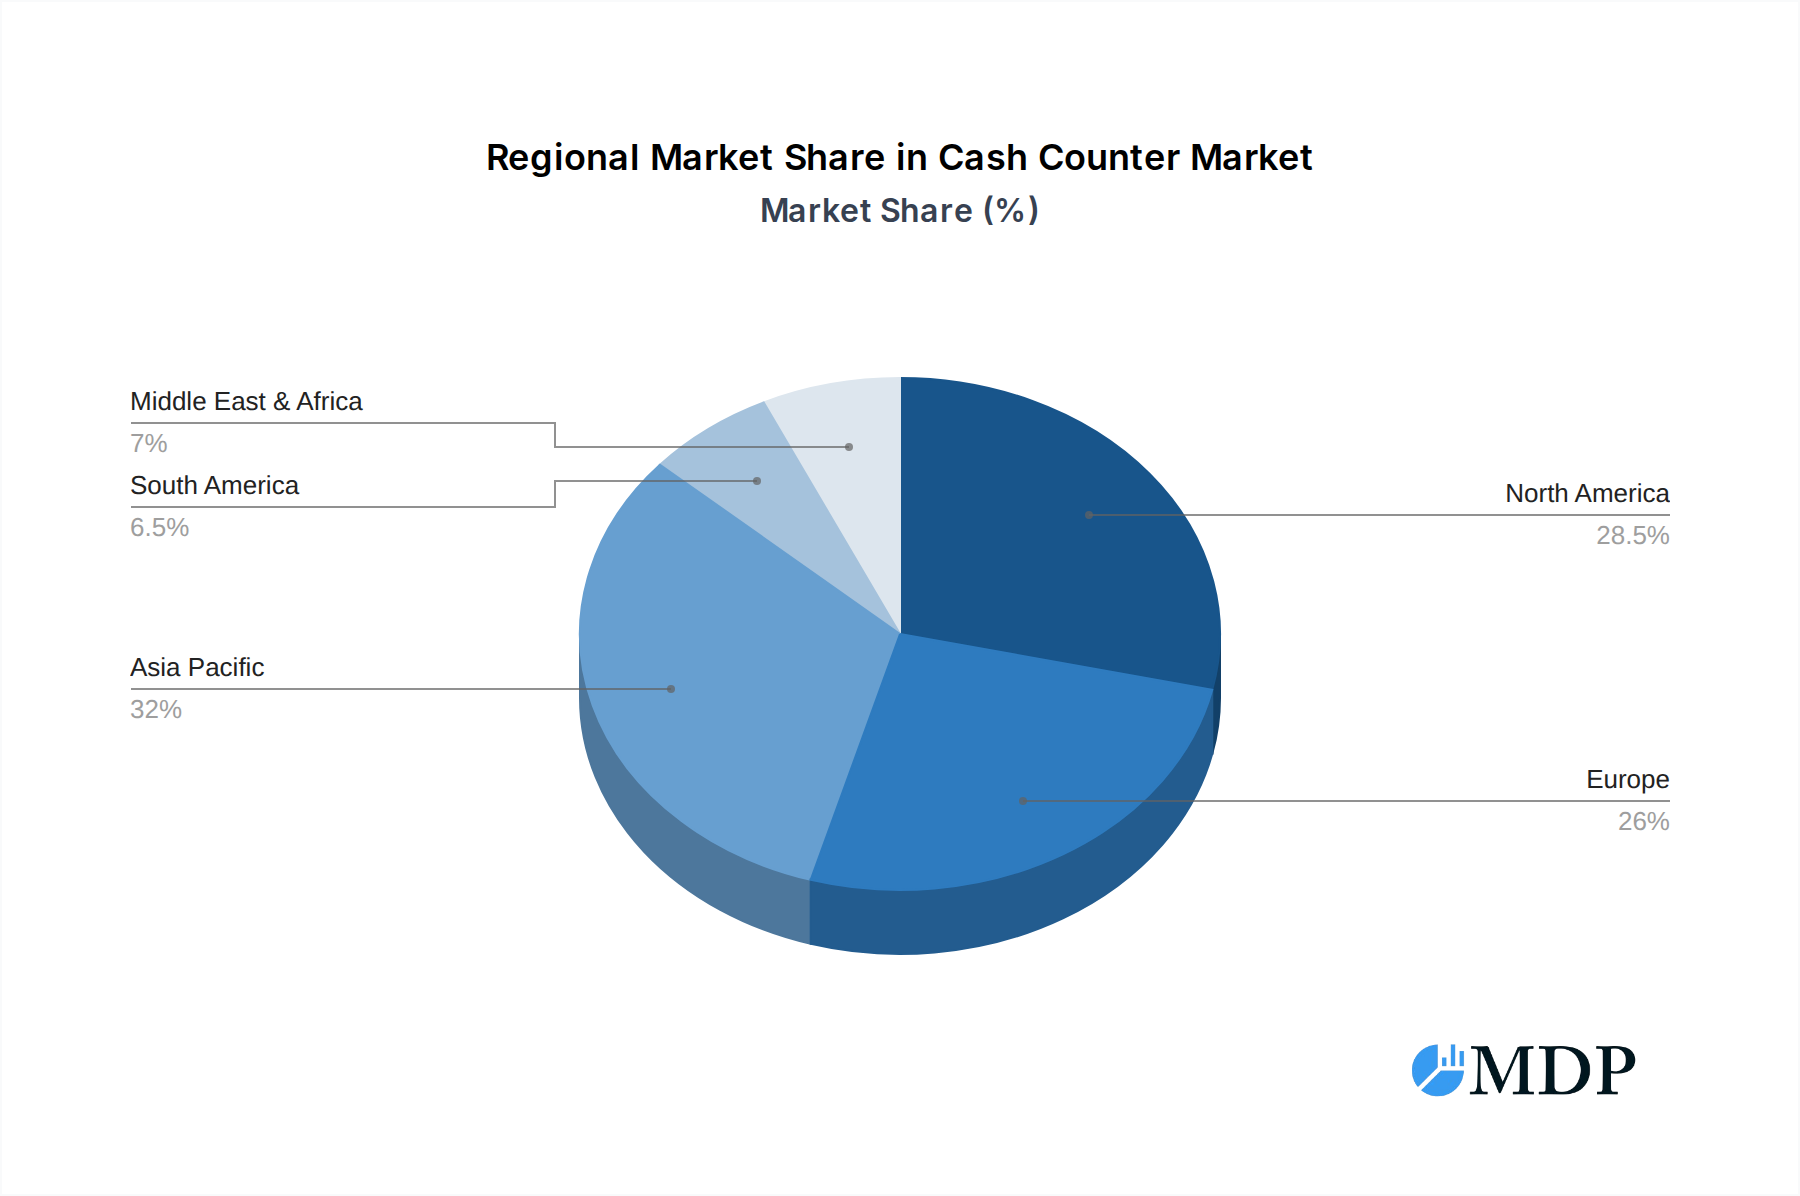
Cash Counter Regional Market Share
Geographic Coverage of Cash Counter
Cash Counter REPORT HIGHLIGHTS
| Aspects | Details |
|---|---|
| Study Period | 2020-2034 |
| Base Year | 2025 |
| Estimated Year | 2026 |
| Forecast Period | 2026-2034 |
| Historical Period | 2020-2025 |
| Growth Rate | CAGR of 13.6% from 2020-2034 |
| Segmentation |
|
Table of Contents
- 1. Introduction
- 1.1. Research Scope
- 1.2. Market Segmentation
- 1.3. Research Objective
- 1.4. Definitions and Assumptions
- 2. Executive Summary
- 2.1. Market Snapshot
- 3. Market Dynamics
- 3.1. Market Drivers
- 3.2. Market Restrains
- 3.3. Market Trends
- 3.4. Market Opportunities
- 4. Market Factor Analysis
- 4.1. Porters Five Forces
- 4.1.1. Bargaining Power of Suppliers
- 4.1.2. Bargaining Power of Buyers
- 4.1.3. Threat of New Entrants
- 4.1.4. Threat of Substitutes
- 4.1.5. Competitive Rivalry
- 4.2. PESTEL analysis
- 4.3. BCG Analysis
- 4.3.1. Stars (High Growth, High Market Share)
- 4.3.2. Cash Cows (Low Growth, High Market Share)
- 4.3.3. Question Mark (High Growth, Low Market Share)
- 4.3.4. Dogs (Low Growth, Low Market Share)
- 4.4. Ansoff Matrix Analysis
- 4.5. Supply Chain Analysis
- 4.6. Regulatory Landscape
- 4.7. Current Market Potential and Opportunity Assessment (TAM–SAM–SOM Framework)
- 4.8. MDP Analyst Note
- 4.1. Porters Five Forces
- 5. Market Analysis, Insights and Forecast 2021-2033
- 5.1. Market Analysis, Insights and Forecast - by Application
- 5.1.1. Casino
- 5.1.2. Retail
- 5.1.3. BFSI
- 5.2. Market Analysis, Insights and Forecast - by Types
- 5.2.1. Single Pocket
- 5.2.2. Double Pocket
- 5.3. Market Analysis, Insights and Forecast - by Region
- 5.3.1. North America
- 5.3.2. South America
- 5.3.3. Europe
- 5.3.4. Middle East & Africa
- 5.3.5. Asia Pacific
- 5.1. Market Analysis, Insights and Forecast - by Application
- 6. Global Cash Counter Analysis, Insights and Forecast, 2021-2033
- 6.1. Market Analysis, Insights and Forecast - by Application
- 6.1.1. Casino
- 6.1.2. Retail
- 6.1.3. BFSI
- 6.2. Market Analysis, Insights and Forecast - by Types
- 6.2.1. Single Pocket
- 6.2.2. Double Pocket
- 6.1. Market Analysis, Insights and Forecast - by Application
- 7. North America Cash Counter Analysis, Insights and Forecast, 2020-2032
- 7.1. Market Analysis, Insights and Forecast - by Application
- 7.1.1. Casino
- 7.1.2. Retail
- 7.1.3. BFSI
- 7.2. Market Analysis, Insights and Forecast - by Types
- 7.2.1. Single Pocket
- 7.2.2. Double Pocket
- 7.1. Market Analysis, Insights and Forecast - by Application
- 8. South America Cash Counter Analysis, Insights and Forecast, 2020-2032
- 8.1. Market Analysis, Insights and Forecast - by Application
- 8.1.1. Casino
- 8.1.2. Retail
- 8.1.3. BFSI
- 8.2. Market Analysis, Insights and Forecast - by Types
- 8.2.1. Single Pocket
- 8.2.2. Double Pocket
- 8.1. Market Analysis, Insights and Forecast - by Application
- 9. Europe Cash Counter Analysis, Insights and Forecast, 2020-2032
- 9.1. Market Analysis, Insights and Forecast - by Application
- 9.1.1. Casino
- 9.1.2. Retail
- 9.1.3. BFSI
- 9.2. Market Analysis, Insights and Forecast - by Types
- 9.2.1. Single Pocket
- 9.2.2. Double Pocket
- 9.1. Market Analysis, Insights and Forecast - by Application
- 10. Middle East & Africa Cash Counter Analysis, Insights and Forecast, 2020-2032
- 10.1. Market Analysis, Insights and Forecast - by Application
- 10.1.1. Casino
- 10.1.2. Retail
- 10.1.3. BFSI
- 10.2. Market Analysis, Insights and Forecast - by Types
- 10.2.1. Single Pocket
- 10.2.2. Double Pocket
- 10.1. Market Analysis, Insights and Forecast - by Application
- 11. Asia Pacific Cash Counter Analysis, Insights and Forecast, 2020-2032
- 11.1. Market Analysis, Insights and Forecast - by Application
- 11.1.1. Casino
- 11.1.2. Retail
- 11.1.3. BFSI
- 11.2. Market Analysis, Insights and Forecast - by Types
- 11.2.1. Single Pocket
- 11.2.2. Double Pocket
- 11.1. Market Analysis, Insights and Forecast - by Application
- 12. Competitive Analysis
- 12.1. Company Profiles
- 12.1.1 Giesecke & Devrient
- 12.1.1.1. Company Overview
- 12.1.1.2. Products
- 12.1.1.3. Company Financials
- 12.1.1.4. SWOT Analysis
- 12.1.2 Glory Global Solutions
- 12.1.2.1. Company Overview
- 12.1.2.2. Products
- 12.1.2.3. Company Financials
- 12.1.2.4. SWOT Analysis
- 12.1.3 Royal Sovereign
- 12.1.3.1. Company Overview
- 12.1.3.2. Products
- 12.1.3.3. Company Financials
- 12.1.3.4. SWOT Analysis
- 12.1.4 Billcon
- 12.1.4.1. Company Overview
- 12.1.4.2. Products
- 12.1.4.3. Company Financials
- 12.1.4.4. SWOT Analysis
- 12.1.5 Cassida
- 12.1.5.1. Company Overview
- 12.1.5.2. Products
- 12.1.5.3. Company Financials
- 12.1.5.4. SWOT Analysis
- 12.1.6 Cummins Allison
- 12.1.6.1. Company Overview
- 12.1.6.2. Products
- 12.1.6.3. Company Financials
- 12.1.6.4. SWOT Analysis
- 12.1.7 Liaoning Julong Financial Equipment
- 12.1.7.1. Company Overview
- 12.1.7.2. Products
- 12.1.7.3. Company Financials
- 12.1.7.4. SWOT Analysis
- 12.1.8 Laurel Bank Machines
- 12.1.8.1. Company Overview
- 12.1.8.2. Products
- 12.1.8.3. Company Financials
- 12.1.8.4. SWOT Analysis
- 12.1.9 Semacon
- 12.1.9.1. Company Overview
- 12.1.9.2. Products
- 12.1.9.3. Company Financials
- 12.1.9.4. SWOT Analysis
- 12.1.1 Giesecke & Devrient
- 12.2. Market Entropy
- 12.2.1 Company's Key Areas Served
- 12.2.2 Recent Developments
- 12.3. Company Market Share Analysis 2025
- 12.3.1 Top 5 Companies Market Share Analysis
- 12.3.2 Top 3 Companies Market Share Analysis
- 12.4. List of Potential Customers
- 13. Research Methodology
List of Figures
- Figure 1: Global Cash Counter Revenue Breakdown (undefined, %) by Region 2025 & 2033
- Figure 2: North America Cash Counter Revenue (undefined), by Application 2025 & 2033
- Figure 3: North America Cash Counter Revenue Share (%), by Application 2025 & 2033
- Figure 4: North America Cash Counter Revenue (undefined), by Types 2025 & 2033
- Figure 5: North America Cash Counter Revenue Share (%), by Types 2025 & 2033
- Figure 6: North America Cash Counter Revenue (undefined), by Country 2025 & 2033
- Figure 7: North America Cash Counter Revenue Share (%), by Country 2025 & 2033
- Figure 8: South America Cash Counter Revenue (undefined), by Application 2025 & 2033
- Figure 9: South America Cash Counter Revenue Share (%), by Application 2025 & 2033
- Figure 10: South America Cash Counter Revenue (undefined), by Types 2025 & 2033
- Figure 11: South America Cash Counter Revenue Share (%), by Types 2025 & 2033
- Figure 12: South America Cash Counter Revenue (undefined), by Country 2025 & 2033
- Figure 13: South America Cash Counter Revenue Share (%), by Country 2025 & 2033
- Figure 14: Europe Cash Counter Revenue (undefined), by Application 2025 & 2033
- Figure 15: Europe Cash Counter Revenue Share (%), by Application 2025 & 2033
- Figure 16: Europe Cash Counter Revenue (undefined), by Types 2025 & 2033
- Figure 17: Europe Cash Counter Revenue Share (%), by Types 2025 & 2033
- Figure 18: Europe Cash Counter Revenue (undefined), by Country 2025 & 2033
- Figure 19: Europe Cash Counter Revenue Share (%), by Country 2025 & 2033
- Figure 20: Middle East & Africa Cash Counter Revenue (undefined), by Application 2025 & 2033
- Figure 21: Middle East & Africa Cash Counter Revenue Share (%), by Application 2025 & 2033
- Figure 22: Middle East & Africa Cash Counter Revenue (undefined), by Types 2025 & 2033
- Figure 23: Middle East & Africa Cash Counter Revenue Share (%), by Types 2025 & 2033
- Figure 24: Middle East & Africa Cash Counter Revenue (undefined), by Country 2025 & 2033
- Figure 25: Middle East & Africa Cash Counter Revenue Share (%), by Country 2025 & 2033
- Figure 26: Asia Pacific Cash Counter Revenue (undefined), by Application 2025 & 2033
- Figure 27: Asia Pacific Cash Counter Revenue Share (%), by Application 2025 & 2033
- Figure 28: Asia Pacific Cash Counter Revenue (undefined), by Types 2025 & 2033
- Figure 29: Asia Pacific Cash Counter Revenue Share (%), by Types 2025 & 2033
- Figure 30: Asia Pacific Cash Counter Revenue (undefined), by Country 2025 & 2033
- Figure 31: Asia Pacific Cash Counter Revenue Share (%), by Country 2025 & 2033
List of Tables
- Table 1: Global Cash Counter Revenue undefined Forecast, by Application 2020 & 2033
- Table 2: Global Cash Counter Revenue undefined Forecast, by Types 2020 & 2033
- Table 3: Global Cash Counter Revenue undefined Forecast, by Region 2020 & 2033
- Table 4: Global Cash Counter Revenue undefined Forecast, by Application 2020 & 2033
- Table 5: Global Cash Counter Revenue undefined Forecast, by Types 2020 & 2033
- Table 6: Global Cash Counter Revenue undefined Forecast, by Country 2020 & 2033
- Table 7: United States Cash Counter Revenue (undefined) Forecast, by Application 2020 & 2033
- Table 8: Canada Cash Counter Revenue (undefined) Forecast, by Application 2020 & 2033
- Table 9: Mexico Cash Counter Revenue (undefined) Forecast, by Application 2020 & 2033
- Table 10: Global Cash Counter Revenue undefined Forecast, by Application 2020 & 2033
- Table 11: Global Cash Counter Revenue undefined Forecast, by Types 2020 & 2033
- Table 12: Global Cash Counter Revenue undefined Forecast, by Country 2020 & 2033
- Table 13: Brazil Cash Counter Revenue (undefined) Forecast, by Application 2020 & 2033
- Table 14: Argentina Cash Counter Revenue (undefined) Forecast, by Application 2020 & 2033
- Table 15: Rest of South America Cash Counter Revenue (undefined) Forecast, by Application 2020 & 2033
- Table 16: Global Cash Counter Revenue undefined Forecast, by Application 2020 & 2033
- Table 17: Global Cash Counter Revenue undefined Forecast, by Types 2020 & 2033
- Table 18: Global Cash Counter Revenue undefined Forecast, by Country 2020 & 2033
- Table 19: United Kingdom Cash Counter Revenue (undefined) Forecast, by Application 2020 & 2033
- Table 20: Germany Cash Counter Revenue (undefined) Forecast, by Application 2020 & 2033
- Table 21: France Cash Counter Revenue (undefined) Forecast, by Application 2020 & 2033
- Table 22: Italy Cash Counter Revenue (undefined) Forecast, by Application 2020 & 2033
- Table 23: Spain Cash Counter Revenue (undefined) Forecast, by Application 2020 & 2033
- Table 24: Russia Cash Counter Revenue (undefined) Forecast, by Application 2020 & 2033
- Table 25: Benelux Cash Counter Revenue (undefined) Forecast, by Application 2020 & 2033
- Table 26: Nordics Cash Counter Revenue (undefined) Forecast, by Application 2020 & 2033
- Table 27: Rest of Europe Cash Counter Revenue (undefined) Forecast, by Application 2020 & 2033
- Table 28: Global Cash Counter Revenue undefined Forecast, by Application 2020 & 2033
- Table 29: Global Cash Counter Revenue undefined Forecast, by Types 2020 & 2033
- Table 30: Global Cash Counter Revenue undefined Forecast, by Country 2020 & 2033
- Table 31: Turkey Cash Counter Revenue (undefined) Forecast, by Application 2020 & 2033
- Table 32: Israel Cash Counter Revenue (undefined) Forecast, by Application 2020 & 2033
- Table 33: GCC Cash Counter Revenue (undefined) Forecast, by Application 2020 & 2033
- Table 34: North Africa Cash Counter Revenue (undefined) Forecast, by Application 2020 & 2033
- Table 35: South Africa Cash Counter Revenue (undefined) Forecast, by Application 2020 & 2033
- Table 36: Rest of Middle East & Africa Cash Counter Revenue (undefined) Forecast, by Application 2020 & 2033
- Table 37: Global Cash Counter Revenue undefined Forecast, by Application 2020 & 2033
- Table 38: Global Cash Counter Revenue undefined Forecast, by Types 2020 & 2033
- Table 39: Global Cash Counter Revenue undefined Forecast, by Country 2020 & 2033
- Table 40: China Cash Counter Revenue (undefined) Forecast, by Application 2020 & 2033
- Table 41: India Cash Counter Revenue (undefined) Forecast, by Application 2020 & 2033
- Table 42: Japan Cash Counter Revenue (undefined) Forecast, by Application 2020 & 2033
- Table 43: South Korea Cash Counter Revenue (undefined) Forecast, by Application 2020 & 2033
- Table 44: ASEAN Cash Counter Revenue (undefined) Forecast, by Application 2020 & 2033
- Table 45: Oceania Cash Counter Revenue (undefined) Forecast, by Application 2020 & 2033
- Table 46: Rest of Asia Pacific Cash Counter Revenue (undefined) Forecast, by Application 2020 & 2033
Frequently Asked Questions
1. What is the projected Compound Annual Growth Rate (CAGR) of the Cash Counter?
The projected CAGR is approximately 13.6%.
2. Which companies are prominent players in the Cash Counter?
Key companies in the market include Giesecke & Devrient, Glory Global Solutions, Royal Sovereign, Billcon, Cassida, Cummins Allison, Liaoning Julong Financial Equipment, Laurel Bank Machines, Semacon.
3. What are the main segments of the Cash Counter?
The market segments include Application, Types.
4. Can you provide details about the market size?
The market size is estimated to be USD XXX N/A as of 2022.
5. What are some drivers contributing to market growth?
N/A
6. What are the notable trends driving market growth?
N/A
7. Are there any restraints impacting market growth?
N/A
8. Can you provide examples of recent developments in the market?
N/A
9. What pricing options are available for accessing the report?
Pricing options include single-user, multi-user, and enterprise licenses priced at USD 2900.00, USD 4350.00, and USD 5800.00 respectively.
10. Is the market size provided in terms of value or volume?
The market size is provided in terms of value, measured in N/A.
11. Are there any specific market keywords associated with the report?
Yes, the market keyword associated with the report is "Cash Counter," which aids in identifying and referencing the specific market segment covered.
12. How do I determine which pricing option suits my needs best?
The pricing options vary based on user requirements and access needs. Individual users may opt for single-user licenses, while businesses requiring broader access may choose multi-user or enterprise licenses for cost-effective access to the report.
13. Are there any additional resources or data provided in the Cash Counter report?
While the report offers comprehensive insights, it's advisable to review the specific contents or supplementary materials provided to ascertain if additional resources or data are available.
14. How can I stay updated on further developments or reports in the Cash Counter?
To stay informed about further developments, trends, and reports in the Cash Counter, consider subscribing to industry newsletters, following relevant companies and organizations, or regularly checking reputable industry news sources and publications.
Methodology
Step 1 - Identification of Relevant Samples Size from Population Database


Step 2 - Approaches for Defining Global Market Size (Value, Volume* & Price*)

Note*: In applicable scenarios
Step 3 - Data Sources
Primary Research
- Web Analytics
- Survey Reports
- Research Institute
- Latest Research Reports
- Opinion Leaders
Secondary Research
- Annual Reports
- White Paper
- Latest Press Release
- Industry Association
- Paid Database
- Investor Presentations

Step 4 - Data Triangulation
Involves using different sources of information in order to increase the validity of a study
These sources are likely to be stakeholders in a program - participants, other researchers, program staff, other community members, and so on.
Then we put all data in single framework & apply various statistical tools to find out the dynamic on the market.
During the analysis stage, feedback from the stakeholder groups would be compared to determine areas of agreement as well as areas of divergence