

Key Insights
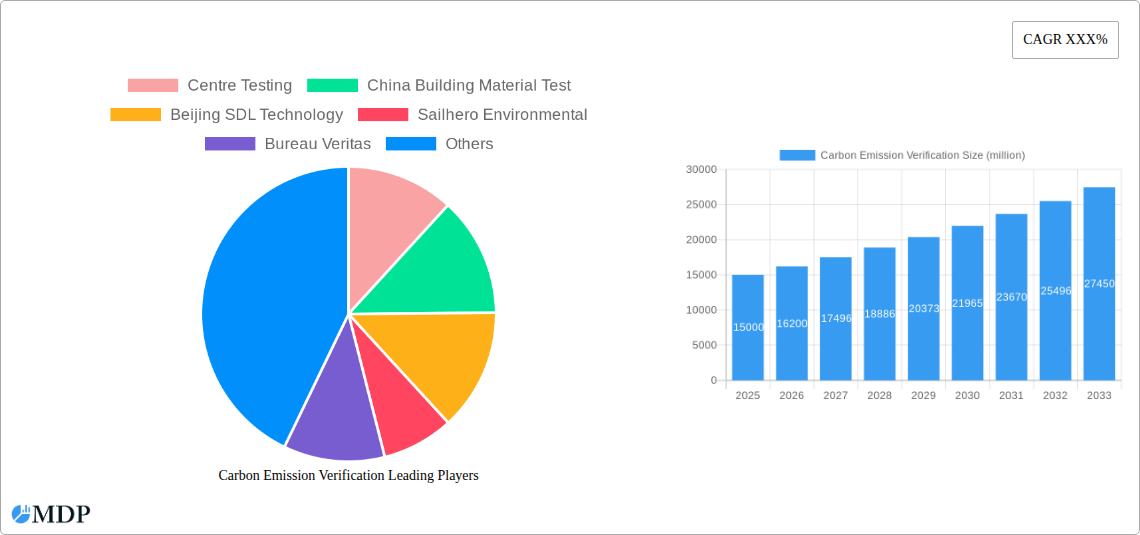
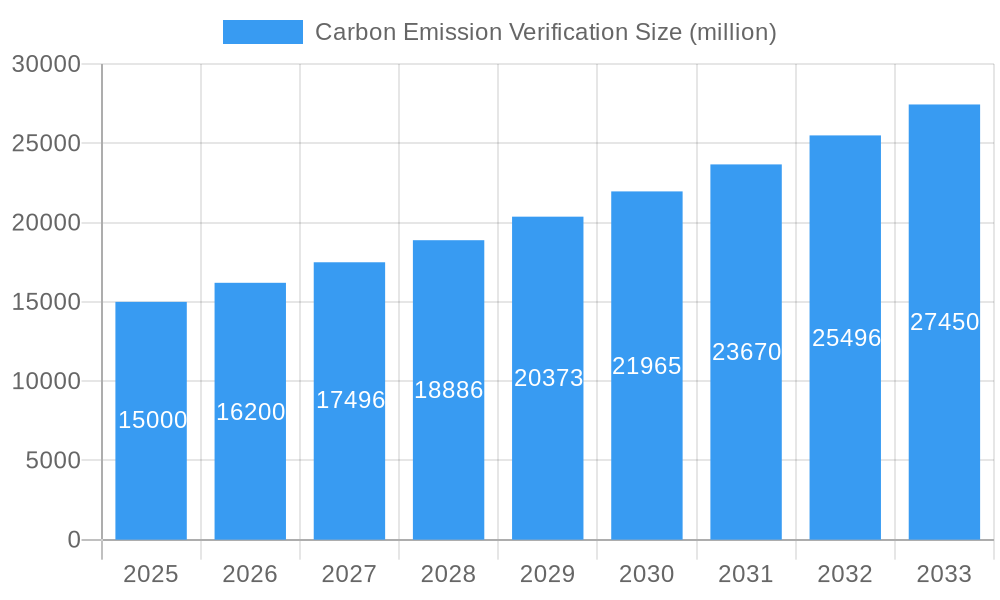
The global carbon emission verification market is experiencing robust growth, driven by escalating environmental regulations, increasing corporate social responsibility (CSR) initiatives, and growing consumer demand for sustainable products and services. The market, estimated at $15 billion in 2025, is projected to witness a Compound Annual Growth Rate (CAGR) of 8% from 2025 to 2033, reaching approximately $28 billion by 2033. Key market drivers include mandatory carbon reporting frameworks (like the EU's CSRD and the US's SEC climate disclosures), the rise of carbon offsetting programs, and the increasing adoption of carbon footprint accounting methodologies across various industries. The automotive terminal and manufacturing sectors are significant contributors to market demand, followed by the energy power sector. Chemical and optical analysis techniques are prevalent methods employed in carbon emission verification. Competition is intense, with both established players like SGS, Bureau Veritas, and Intertek, and specialized firms like Carbon Trust and Noveda Technologies vying for market share. Geographic expansion is a prominent trend, with Asia-Pacific projected to be a key growth region fueled by rapid industrialization and increasing government initiatives in China and India. However, market growth may be tempered by the high costs associated with verification processes and the complexity of establishing standardized methodologies across diverse industries and geographic regions.
Carbon Emission Verification Market Size (In Billion)
Despite potential restraints, the long-term outlook for the carbon emission verification market remains positive. The increasing awareness of climate change and the global push toward net-zero emissions will continue to drive demand for accurate and reliable carbon emission verification services. Future growth will likely be shaped by technological advancements, such as AI-powered data analytics and blockchain technologies for enhanced transparency and traceability in carbon accounting. Further specialization within segments (e.g., scope 3 emission verification) and the development of streamlined verification processes will be crucial for market expansion. The continued expansion of international collaborations and standardized reporting frameworks will play a vital role in fostering market growth and consistency.
Carbon Emission Verification Company Market Share
Carbon Emission Verification Market Report: 2019-2033
Unlocking Growth in a $XX Billion Market: A Comprehensive Analysis of Carbon Emission Verification
This comprehensive report provides a detailed analysis of the global Carbon Emission Verification market, projecting a market value of $XX billion by 2033. The study covers the period 2019-2033, with a base year of 2025 and a forecast period of 2025-2033. We analyze market dynamics, leading players like Bureau Veritas, SGS S.A., and Intertek, key segments (Automobile Terminal, Manufacturing, Energy Power), and emerging opportunities, providing actionable insights for stakeholders across the value chain. Download now to gain a competitive edge.
Carbon Emission Verification Market Dynamics & Concentration
The global carbon emission verification market is experiencing robust growth, driven by stringent environmental regulations and increasing corporate sustainability initiatives. The market size reached approximately $XX billion in 2024 and is projected to reach $XX billion by 2033, exhibiting a CAGR of XX% during the forecast period. Market concentration is moderate, with several major players holding significant market share, though a number of smaller specialized firms also exist.
Market Concentration:
- The top five players (Bureau Veritas, SGS S.A., Intertek, TÜV Rheinland, and Carbon Trust) collectively hold an estimated XX% of the global market share in 2025.
- Smaller players, including regional specialists and niche providers, constitute the remaining market share, indicating significant opportunities for growth and consolidation.
Innovation Drivers:
- Advancements in analytical technologies (e.g., AI-powered data analysis and remote sensing) are streamlining verification processes and improving accuracy.
- Development of standardized methodologies and reporting frameworks enhance transparency and comparability across different sectors.
Regulatory Frameworks:
- Stringent carbon emission regulations (e.g., EU ETS, California’s cap-and-trade program) are driving demand for verification services.
- Growing focus on carbon accounting and reporting standards (e.g., GHG Protocol) are influencing the market.
Product Substitutes & End-User Trends:
- While there are no direct substitutes for third-party carbon emission verification, internal auditing and self-reporting mechanisms exist, though they generally lack the credibility and impartiality of external verification.
- Increased demand for verification services is originating from various end-user sectors, including energy, manufacturing, and transportation, reflecting a growing awareness of environmental responsibility.
M&A Activities:
- The market has witnessed XX M&A deals in the historical period (2019-2024), predominantly driven by larger players seeking to expand their service offerings and geographical reach. The forecast period is expected to see an increase in M&A activity.
Carbon Emission Verification Industry Trends & Analysis
The carbon emission verification market is characterized by dynamic growth, fueled by multiple factors. The increasing awareness of climate change and growing pressure from investors and consumers for greater corporate sustainability are key drivers. Technological advancements, particularly in data analytics and remote sensing, are revolutionizing verification processes, leading to greater efficiency and accuracy. This has increased market penetration from XX% in 2024 to a projected XX% by 2033. The competitive landscape is intensifying, with established players facing challenges from new entrants offering innovative and cost-effective solutions. The CAGR for the forecast period is estimated at XX%.
Consumer preferences are shifting towards companies with demonstrable commitments to environmental sustainability, creating a strong market demand for reliable carbon emission verification services. Furthermore, regulatory pressures are intensifying globally, mandating the verification of emissions for a wider range of industries and activities. These regulatory frameworks, coupled with technological advancements and shifting consumer preferences, are driving sustained market growth. The increased adoption of carbon offsetting schemes and the development of sophisticated carbon accounting methodologies further fuel demand.
Leading Markets & Segments in Carbon Emission Verification
The Manufacturing segment is currently the leading application area for carbon emission verification services, accounting for approximately XX% of the total market in 2025. This dominance is driven by several factors:
- Stringent Regulations: Many manufacturing sectors face increasing scrutiny and regulations related to carbon emissions, necessitating verification.
- Supply Chain Pressure: Major brands are demanding carbon emission verification from their suppliers to ensure sustainability throughout their value chain.
- Competitive Advantage: Companies are using carbon emission verification as a means to showcase their commitment to sustainability and gain a competitive advantage.
Dominant Regions:
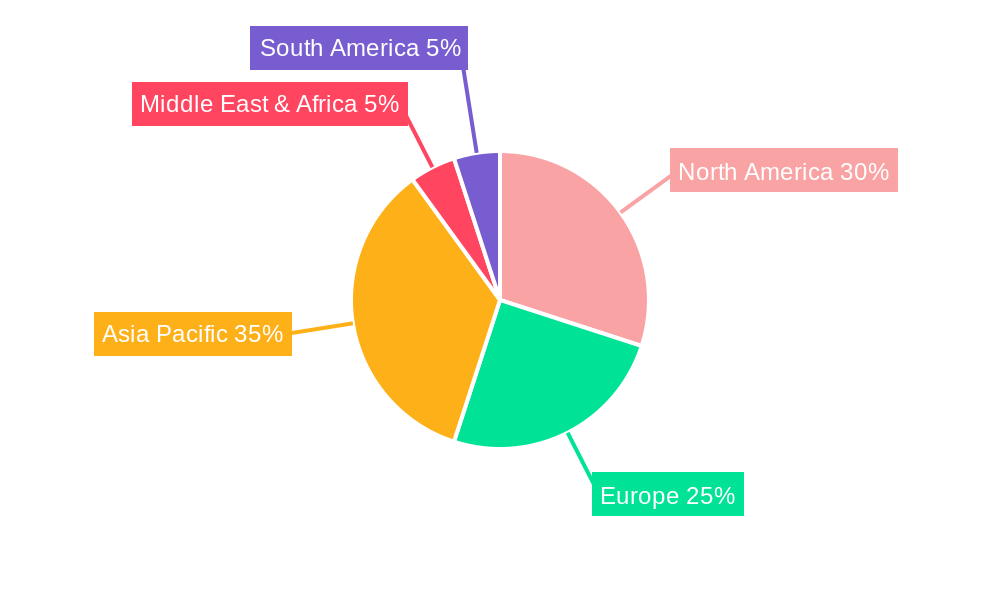
- North America and Europe currently hold the largest market shares, driven by robust regulatory frameworks and high corporate social responsibility (CSR) standards.
- Asia-Pacific is anticipated to witness significant growth during the forecast period due to increasing industrialization and growing awareness of environmental issues.
Dominant Type:
- Chemical Analysis holds a significant share of the market due to its importance in quantifying greenhouse gas emissions from industrial processes and other sources.
- Optical Analysis is also growing in significance due to its role in remote sensing and monitoring carbon emissions from various sources.
Carbon Emission Verification Product Developments
Recent product innovations have focused on integrating advanced data analytics and AI to improve the accuracy and efficiency of carbon emission verification. This includes the use of machine learning algorithms to analyze large datasets, remote sensing technologies to monitor emissions from various sources and development of user-friendly software platforms to streamline the verification process. These innovations improve the overall accuracy and efficiency of carbon emission verification processes, enhancing their market fit and competitive advantage.
Key Drivers of Carbon Emission Verification Growth
Several key factors are driving the growth of the carbon emission verification market:
- Stringent Environmental Regulations: Governments worldwide are implementing stricter emission reduction targets and reporting requirements.
- Corporate Sustainability Initiatives: Companies are increasingly incorporating sustainability into their business strategies, emphasizing their ESG performance.
- Investor and Consumer Pressure: Investors and consumers are demanding greater transparency and accountability regarding environmental impact.
- Technological Advancements: Innovations in data analytics and remote sensing are improving verification efficiency and accuracy.
Challenges in the Carbon Emission Verification Market
The carbon emission verification market faces several challenges:
- High Costs: Verification processes can be expensive, posing a barrier for small and medium-sized enterprises (SMEs).
- Data Accuracy and Reliability: Ensuring the accuracy and reliability of emission data remains crucial for effective verification.
- Standardization Issues: Lack of standardization across verification methodologies can create inconsistencies and comparability issues.
- Limited Awareness: In some regions, limited awareness of carbon emission verification services might hinder market growth. This impacts the total addressable market. We estimate this has resulted in a XX million shortfall in market penetration.
Emerging Opportunities in Carbon Emission Verification
The long-term growth of the carbon emission verification market is driven by several factors. The increasing adoption of carbon offsetting schemes creates a surge in demand for verification services. Advancements in blockchain technology present new opportunities for secure and transparent carbon credit tracking and trading, thereby enhancing market confidence. Strategic partnerships between verification companies and technology providers can unlock efficiency gains and improved data analysis. Expansion into emerging markets with growing industrial activity offers substantial growth potential.
Leading Players in the Carbon Emission Verification Sector
- Centre Testing
- China Building Material Test
- Beijing SDL Technology
- Sailhero Environmental
- Bureau Veritas
- SGS S.A.
- Verifavia
- Intertek
- TÜV Rheinland
- Carbon Trust
- RINA S.p.A.
- Inspecco
- Guangdong Avi Low Carbon Technology
- Noveda Technologies
Key Milestones in Carbon Emission Verification Industry
- 2020: Increased adoption of remote sensing technologies for carbon emission monitoring.
- 2021: Several key partnerships formed between verification companies and technology providers to improve data analysis capabilities.
- 2022: Launch of new software platforms to streamline verification processes and enhance efficiency.
- 2023: Growing focus on standardization of carbon emission verification methodologies.
- 2024: Several significant M&A activities in the carbon emission verification sector.
Strategic Outlook for Carbon Emission Verification Market
The carbon emission verification market presents significant growth opportunities, driven by increasing regulatory pressure, corporate sustainability initiatives, and technological advancements. Strategic partnerships, expansion into new markets, and investments in innovative technologies are crucial for success in this rapidly evolving market. The market's future growth will hinge on the effectiveness of international climate change policies and the continued demand for credible and reliable carbon emission verification services. The potential for expansion into new sectors and the ongoing development of more precise and efficient verification methods suggest a bright outlook for the industry in the next decade.
Carbon Emission Verification Segmentation
-
1. Application
- 1.1. Automobile Terminal
- 1.2. Manufacturing
- 1.3. Energy Power
- 1.4. Other
-
2. Type
- 2.1. Chemical Analysis
- 2.2. Optical Analysis
- 2.3. Other
Carbon Emission Verification Segmentation By Geography
-
1. North America
- 1.1. United States
- 1.2. Canada
- 1.3. Mexico
-
2. South America
- 2.1. Brazil
- 2.2. Argentina
- 2.3. Rest of South America
-
3. Europe
- 3.1. United Kingdom
- 3.2. Germany
- 3.3. France
- 3.4. Italy
- 3.5. Spain
- 3.6. Russia
- 3.7. Benelux
- 3.8. Nordics
- 3.9. Rest of Europe
-
4. Middle East & Africa
- 4.1. Turkey
- 4.2. Israel
- 4.3. GCC
- 4.4. North Africa
- 4.5. South Africa
- 4.6. Rest of Middle East & Africa
-
5. Asia Pacific
- 5.1. China
- 5.2. India
- 5.3. Japan
- 5.4. South Korea
- 5.5. ASEAN
- 5.6. Oceania
- 5.7. Rest of Asia Pacific
Carbon Emission Verification Regional Market Share
Geographic Coverage of Carbon Emission Verification
Carbon Emission Verification REPORT HIGHLIGHTS
| Aspects | Details |
|---|---|
| Study Period | 2020-2034 |
| Base Year | 2025 |
| Estimated Year | 2026 |
| Forecast Period | 2026-2034 |
| Historical Period | 2020-2025 |
| Growth Rate | CAGR of 18.5% from 2020-2034 |
| Segmentation |
|
Table of Contents
- 1. Introduction
- 1.1. Research Scope
- 1.2. Market Segmentation
- 1.3. Research Methodology
- 1.4. Definitions and Assumptions
- 2. Executive Summary
- 2.1. Introduction
- 3. Market Dynamics
- 3.1. Introduction
- 3.2. Market Drivers
- 3.3. Market Restrains
- 3.4. Market Trends
- 4. Market Factor Analysis
- 4.1. Porters Five Forces
- 4.2. Supply/Value Chain
- 4.3. PESTEL analysis
- 4.4. Market Entropy
- 4.5. Patent/Trademark Analysis
- 5. Global Carbon Emission Verification Analysis, Insights and Forecast, 2020-2032
- 5.1. Market Analysis, Insights and Forecast - by Application
- 5.1.1. Automobile Terminal
- 5.1.2. Manufacturing
- 5.1.3. Energy Power
- 5.1.4. Other
- 5.2. Market Analysis, Insights and Forecast - by Type
- 5.2.1. Chemical Analysis
- 5.2.2. Optical Analysis
- 5.2.3. Other
- 5.3. Market Analysis, Insights and Forecast - by Region
- 5.3.1. North America
- 5.3.2. South America
- 5.3.3. Europe
- 5.3.4. Middle East & Africa
- 5.3.5. Asia Pacific
- 5.1. Market Analysis, Insights and Forecast - by Application
- 6. North America Carbon Emission Verification Analysis, Insights and Forecast, 2020-2032
- 6.1. Market Analysis, Insights and Forecast - by Application
- 6.1.1. Automobile Terminal
- 6.1.2. Manufacturing
- 6.1.3. Energy Power
- 6.1.4. Other
- 6.2. Market Analysis, Insights and Forecast - by Type
- 6.2.1. Chemical Analysis
- 6.2.2. Optical Analysis
- 6.2.3. Other
- 6.1. Market Analysis, Insights and Forecast - by Application
- 7. South America Carbon Emission Verification Analysis, Insights and Forecast, 2020-2032
- 7.1. Market Analysis, Insights and Forecast - by Application
- 7.1.1. Automobile Terminal
- 7.1.2. Manufacturing
- 7.1.3. Energy Power
- 7.1.4. Other
- 7.2. Market Analysis, Insights and Forecast - by Type
- 7.2.1. Chemical Analysis
- 7.2.2. Optical Analysis
- 7.2.3. Other
- 7.1. Market Analysis, Insights and Forecast - by Application
- 8. Europe Carbon Emission Verification Analysis, Insights and Forecast, 2020-2032
- 8.1. Market Analysis, Insights and Forecast - by Application
- 8.1.1. Automobile Terminal
- 8.1.2. Manufacturing
- 8.1.3. Energy Power
- 8.1.4. Other
- 8.2. Market Analysis, Insights and Forecast - by Type
- 8.2.1. Chemical Analysis
- 8.2.2. Optical Analysis
- 8.2.3. Other
- 8.1. Market Analysis, Insights and Forecast - by Application
- 9. Middle East & Africa Carbon Emission Verification Analysis, Insights and Forecast, 2020-2032
- 9.1. Market Analysis, Insights and Forecast - by Application
- 9.1.1. Automobile Terminal
- 9.1.2. Manufacturing
- 9.1.3. Energy Power
- 9.1.4. Other
- 9.2. Market Analysis, Insights and Forecast - by Type
- 9.2.1. Chemical Analysis
- 9.2.2. Optical Analysis
- 9.2.3. Other
- 9.1. Market Analysis, Insights and Forecast - by Application
- 10. Asia Pacific Carbon Emission Verification Analysis, Insights and Forecast, 2020-2032
- 10.1. Market Analysis, Insights and Forecast - by Application
- 10.1.1. Automobile Terminal
- 10.1.2. Manufacturing
- 10.1.3. Energy Power
- 10.1.4. Other
- 10.2. Market Analysis, Insights and Forecast - by Type
- 10.2.1. Chemical Analysis
- 10.2.2. Optical Analysis
- 10.2.3. Other
- 10.1. Market Analysis, Insights and Forecast - by Application
- 11. Competitive Analysis
- 11.1. Global Market Share Analysis 2025
- 11.2. Company Profiles
- 11.2.1 Centre Testing
- 11.2.1.1. Overview
- 11.2.1.2. Products
- 11.2.1.3. SWOT Analysis
- 11.2.1.4. Recent Developments
- 11.2.1.5. Financials (Based on Availability)
- 11.2.2 China Building Material Test
- 11.2.2.1. Overview
- 11.2.2.2. Products
- 11.2.2.3. SWOT Analysis
- 11.2.2.4. Recent Developments
- 11.2.2.5. Financials (Based on Availability)
- 11.2.3 Beijing SDL Technology
- 11.2.3.1. Overview
- 11.2.3.2. Products
- 11.2.3.3. SWOT Analysis
- 11.2.3.4. Recent Developments
- 11.2.3.5. Financials (Based on Availability)
- 11.2.4 Sailhero Environmental
- 11.2.4.1. Overview
- 11.2.4.2. Products
- 11.2.4.3. SWOT Analysis
- 11.2.4.4. Recent Developments
- 11.2.4.5. Financials (Based on Availability)
- 11.2.5 Bureau Veritas
- 11.2.5.1. Overview
- 11.2.5.2. Products
- 11.2.5.3. SWOT Analysis
- 11.2.5.4. Recent Developments
- 11.2.5.5. Financials (Based on Availability)
- 11.2.6 SGS S.A.
- 11.2.6.1. Overview
- 11.2.6.2. Products
- 11.2.6.3. SWOT Analysis
- 11.2.6.4. Recent Developments
- 11.2.6.5. Financials (Based on Availability)
- 11.2.7 Verifavia
- 11.2.7.1. Overview
- 11.2.7.2. Products
- 11.2.7.3. SWOT Analysis
- 11.2.7.4. Recent Developments
- 11.2.7.5. Financials (Based on Availability)
- 11.2.8 Intertek
- 11.2.8.1. Overview
- 11.2.8.2. Products
- 11.2.8.3. SWOT Analysis
- 11.2.8.4. Recent Developments
- 11.2.8.5. Financials (Based on Availability)
- 11.2.9 TÜV Rheinland
- 11.2.9.1. Overview
- 11.2.9.2. Products
- 11.2.9.3. SWOT Analysis
- 11.2.9.4. Recent Developments
- 11.2.9.5. Financials (Based on Availability)
- 11.2.10 Carbon Trust
- 11.2.10.1. Overview
- 11.2.10.2. Products
- 11.2.10.3. SWOT Analysis
- 11.2.10.4. Recent Developments
- 11.2.10.5. Financials (Based on Availability)
- 11.2.11 RINA S.p.A.
- 11.2.11.1. Overview
- 11.2.11.2. Products
- 11.2.11.3. SWOT Analysis
- 11.2.11.4. Recent Developments
- 11.2.11.5. Financials (Based on Availability)
- 11.2.12 Inspecco
- 11.2.12.1. Overview
- 11.2.12.2. Products
- 11.2.12.3. SWOT Analysis
- 11.2.12.4. Recent Developments
- 11.2.12.5. Financials (Based on Availability)
- 11.2.13 Guangdong Avi Low Carbon Technology
- 11.2.13.1. Overview
- 11.2.13.2. Products
- 11.2.13.3. SWOT Analysis
- 11.2.13.4. Recent Developments
- 11.2.13.5. Financials (Based on Availability)
- 11.2.14 Noveda Technologies
- 11.2.14.1. Overview
- 11.2.14.2. Products
- 11.2.14.3. SWOT Analysis
- 11.2.14.4. Recent Developments
- 11.2.14.5. Financials (Based on Availability)
- 11.2.1 Centre Testing
List of Figures
- Figure 1: Global Carbon Emission Verification Revenue Breakdown (undefined, %) by Region 2025 & 2033
- Figure 2: North America Carbon Emission Verification Revenue (undefined), by Application 2025 & 2033
- Figure 3: North America Carbon Emission Verification Revenue Share (%), by Application 2025 & 2033
- Figure 4: North America Carbon Emission Verification Revenue (undefined), by Type 2025 & 2033
- Figure 5: North America Carbon Emission Verification Revenue Share (%), by Type 2025 & 2033
- Figure 6: North America Carbon Emission Verification Revenue (undefined), by Country 2025 & 2033
- Figure 7: North America Carbon Emission Verification Revenue Share (%), by Country 2025 & 2033
- Figure 8: South America Carbon Emission Verification Revenue (undefined), by Application 2025 & 2033
- Figure 9: South America Carbon Emission Verification Revenue Share (%), by Application 2025 & 2033
- Figure 10: South America Carbon Emission Verification Revenue (undefined), by Type 2025 & 2033
- Figure 11: South America Carbon Emission Verification Revenue Share (%), by Type 2025 & 2033
- Figure 12: South America Carbon Emission Verification Revenue (undefined), by Country 2025 & 2033
- Figure 13: South America Carbon Emission Verification Revenue Share (%), by Country 2025 & 2033
- Figure 14: Europe Carbon Emission Verification Revenue (undefined), by Application 2025 & 2033
- Figure 15: Europe Carbon Emission Verification Revenue Share (%), by Application 2025 & 2033
- Figure 16: Europe Carbon Emission Verification Revenue (undefined), by Type 2025 & 2033
- Figure 17: Europe Carbon Emission Verification Revenue Share (%), by Type 2025 & 2033
- Figure 18: Europe Carbon Emission Verification Revenue (undefined), by Country 2025 & 2033
- Figure 19: Europe Carbon Emission Verification Revenue Share (%), by Country 2025 & 2033
- Figure 20: Middle East & Africa Carbon Emission Verification Revenue (undefined), by Application 2025 & 2033
- Figure 21: Middle East & Africa Carbon Emission Verification Revenue Share (%), by Application 2025 & 2033
- Figure 22: Middle East & Africa Carbon Emission Verification Revenue (undefined), by Type 2025 & 2033
- Figure 23: Middle East & Africa Carbon Emission Verification Revenue Share (%), by Type 2025 & 2033
- Figure 24: Middle East & Africa Carbon Emission Verification Revenue (undefined), by Country 2025 & 2033
- Figure 25: Middle East & Africa Carbon Emission Verification Revenue Share (%), by Country 2025 & 2033
- Figure 26: Asia Pacific Carbon Emission Verification Revenue (undefined), by Application 2025 & 2033
- Figure 27: Asia Pacific Carbon Emission Verification Revenue Share (%), by Application 2025 & 2033
- Figure 28: Asia Pacific Carbon Emission Verification Revenue (undefined), by Type 2025 & 2033
- Figure 29: Asia Pacific Carbon Emission Verification Revenue Share (%), by Type 2025 & 2033
- Figure 30: Asia Pacific Carbon Emission Verification Revenue (undefined), by Country 2025 & 2033
- Figure 31: Asia Pacific Carbon Emission Verification Revenue Share (%), by Country 2025 & 2033
List of Tables
- Table 1: Global Carbon Emission Verification Revenue undefined Forecast, by Application 2020 & 2033
- Table 2: Global Carbon Emission Verification Revenue undefined Forecast, by Type 2020 & 2033
- Table 3: Global Carbon Emission Verification Revenue undefined Forecast, by Region 2020 & 2033
- Table 4: Global Carbon Emission Verification Revenue undefined Forecast, by Application 2020 & 2033
- Table 5: Global Carbon Emission Verification Revenue undefined Forecast, by Type 2020 & 2033
- Table 6: Global Carbon Emission Verification Revenue undefined Forecast, by Country 2020 & 2033
- Table 7: United States Carbon Emission Verification Revenue (undefined) Forecast, by Application 2020 & 2033
- Table 8: Canada Carbon Emission Verification Revenue (undefined) Forecast, by Application 2020 & 2033
- Table 9: Mexico Carbon Emission Verification Revenue (undefined) Forecast, by Application 2020 & 2033
- Table 10: Global Carbon Emission Verification Revenue undefined Forecast, by Application 2020 & 2033
- Table 11: Global Carbon Emission Verification Revenue undefined Forecast, by Type 2020 & 2033
- Table 12: Global Carbon Emission Verification Revenue undefined Forecast, by Country 2020 & 2033
- Table 13: Brazil Carbon Emission Verification Revenue (undefined) Forecast, by Application 2020 & 2033
- Table 14: Argentina Carbon Emission Verification Revenue (undefined) Forecast, by Application 2020 & 2033
- Table 15: Rest of South America Carbon Emission Verification Revenue (undefined) Forecast, by Application 2020 & 2033
- Table 16: Global Carbon Emission Verification Revenue undefined Forecast, by Application 2020 & 2033
- Table 17: Global Carbon Emission Verification Revenue undefined Forecast, by Type 2020 & 2033
- Table 18: Global Carbon Emission Verification Revenue undefined Forecast, by Country 2020 & 2033
- Table 19: United Kingdom Carbon Emission Verification Revenue (undefined) Forecast, by Application 2020 & 2033
- Table 20: Germany Carbon Emission Verification Revenue (undefined) Forecast, by Application 2020 & 2033
- Table 21: France Carbon Emission Verification Revenue (undefined) Forecast, by Application 2020 & 2033
- Table 22: Italy Carbon Emission Verification Revenue (undefined) Forecast, by Application 2020 & 2033
- Table 23: Spain Carbon Emission Verification Revenue (undefined) Forecast, by Application 2020 & 2033
- Table 24: Russia Carbon Emission Verification Revenue (undefined) Forecast, by Application 2020 & 2033
- Table 25: Benelux Carbon Emission Verification Revenue (undefined) Forecast, by Application 2020 & 2033
- Table 26: Nordics Carbon Emission Verification Revenue (undefined) Forecast, by Application 2020 & 2033
- Table 27: Rest of Europe Carbon Emission Verification Revenue (undefined) Forecast, by Application 2020 & 2033
- Table 28: Global Carbon Emission Verification Revenue undefined Forecast, by Application 2020 & 2033
- Table 29: Global Carbon Emission Verification Revenue undefined Forecast, by Type 2020 & 2033
- Table 30: Global Carbon Emission Verification Revenue undefined Forecast, by Country 2020 & 2033
- Table 31: Turkey Carbon Emission Verification Revenue (undefined) Forecast, by Application 2020 & 2033
- Table 32: Israel Carbon Emission Verification Revenue (undefined) Forecast, by Application 2020 & 2033
- Table 33: GCC Carbon Emission Verification Revenue (undefined) Forecast, by Application 2020 & 2033
- Table 34: North Africa Carbon Emission Verification Revenue (undefined) Forecast, by Application 2020 & 2033
- Table 35: South Africa Carbon Emission Verification Revenue (undefined) Forecast, by Application 2020 & 2033
- Table 36: Rest of Middle East & Africa Carbon Emission Verification Revenue (undefined) Forecast, by Application 2020 & 2033
- Table 37: Global Carbon Emission Verification Revenue undefined Forecast, by Application 2020 & 2033
- Table 38: Global Carbon Emission Verification Revenue undefined Forecast, by Type 2020 & 2033
- Table 39: Global Carbon Emission Verification Revenue undefined Forecast, by Country 2020 & 2033
- Table 40: China Carbon Emission Verification Revenue (undefined) Forecast, by Application 2020 & 2033
- Table 41: India Carbon Emission Verification Revenue (undefined) Forecast, by Application 2020 & 2033
- Table 42: Japan Carbon Emission Verification Revenue (undefined) Forecast, by Application 2020 & 2033
- Table 43: South Korea Carbon Emission Verification Revenue (undefined) Forecast, by Application 2020 & 2033
- Table 44: ASEAN Carbon Emission Verification Revenue (undefined) Forecast, by Application 2020 & 2033
- Table 45: Oceania Carbon Emission Verification Revenue (undefined) Forecast, by Application 2020 & 2033
- Table 46: Rest of Asia Pacific Carbon Emission Verification Revenue (undefined) Forecast, by Application 2020 & 2033
Frequently Asked Questions
1. What is the projected Compound Annual Growth Rate (CAGR) of the Carbon Emission Verification?
The projected CAGR is approximately 18.5%.
2. Which companies are prominent players in the Carbon Emission Verification?
Key companies in the market include Centre Testing, China Building Material Test, Beijing SDL Technology, Sailhero Environmental, Bureau Veritas, SGS S.A., Verifavia, Intertek, TÜV Rheinland, Carbon Trust, RINA S.p.A., Inspecco, Guangdong Avi Low Carbon Technology, Noveda Technologies.
3. What are the main segments of the Carbon Emission Verification?
The market segments include Application, Type.
4. Can you provide details about the market size?
The market size is estimated to be USD XXX N/A as of 2022.
5. What are some drivers contributing to market growth?
N/A
6. What are the notable trends driving market growth?
N/A
7. Are there any restraints impacting market growth?
N/A
8. Can you provide examples of recent developments in the market?
N/A
9. What pricing options are available for accessing the report?
Pricing options include single-user, multi-user, and enterprise licenses priced at USD 4250.00, USD 6375.00, and USD 8500.00 respectively.
10. Is the market size provided in terms of value or volume?
The market size is provided in terms of value, measured in N/A.
11. Are there any specific market keywords associated with the report?
Yes, the market keyword associated with the report is "Carbon Emission Verification," which aids in identifying and referencing the specific market segment covered.
12. How do I determine which pricing option suits my needs best?
The pricing options vary based on user requirements and access needs. Individual users may opt for single-user licenses, while businesses requiring broader access may choose multi-user or enterprise licenses for cost-effective access to the report.
13. Are there any additional resources or data provided in the Carbon Emission Verification report?
While the report offers comprehensive insights, it's advisable to review the specific contents or supplementary materials provided to ascertain if additional resources or data are available.
14. How can I stay updated on further developments or reports in the Carbon Emission Verification?
To stay informed about further developments, trends, and reports in the Carbon Emission Verification, consider subscribing to industry newsletters, following relevant companies and organizations, or regularly checking reputable industry news sources and publications.
Methodology
Step 1 - Identification of Relevant Samples Size from Population Database


Step 2 - Approaches for Defining Global Market Size (Value, Volume* & Price*)

Note*: In applicable scenarios
Step 3 - Data Sources
Primary Research
- Web Analytics
- Survey Reports
- Research Institute
- Latest Research Reports
- Opinion Leaders
Secondary Research
- Annual Reports
- White Paper
- Latest Press Release
- Industry Association
- Paid Database
- Investor Presentations

Step 4 - Data Triangulation
Involves using different sources of information in order to increase the validity of a study
These sources are likely to be stakeholders in a program - participants, other researchers, program staff, other community members, and so on.
Then we put all data in single framework & apply various statistical tools to find out the dynamic on the market.
During the analysis stage, feedback from the stakeholder groups would be compared to determine areas of agreement as well as areas of divergence