

Key Insights
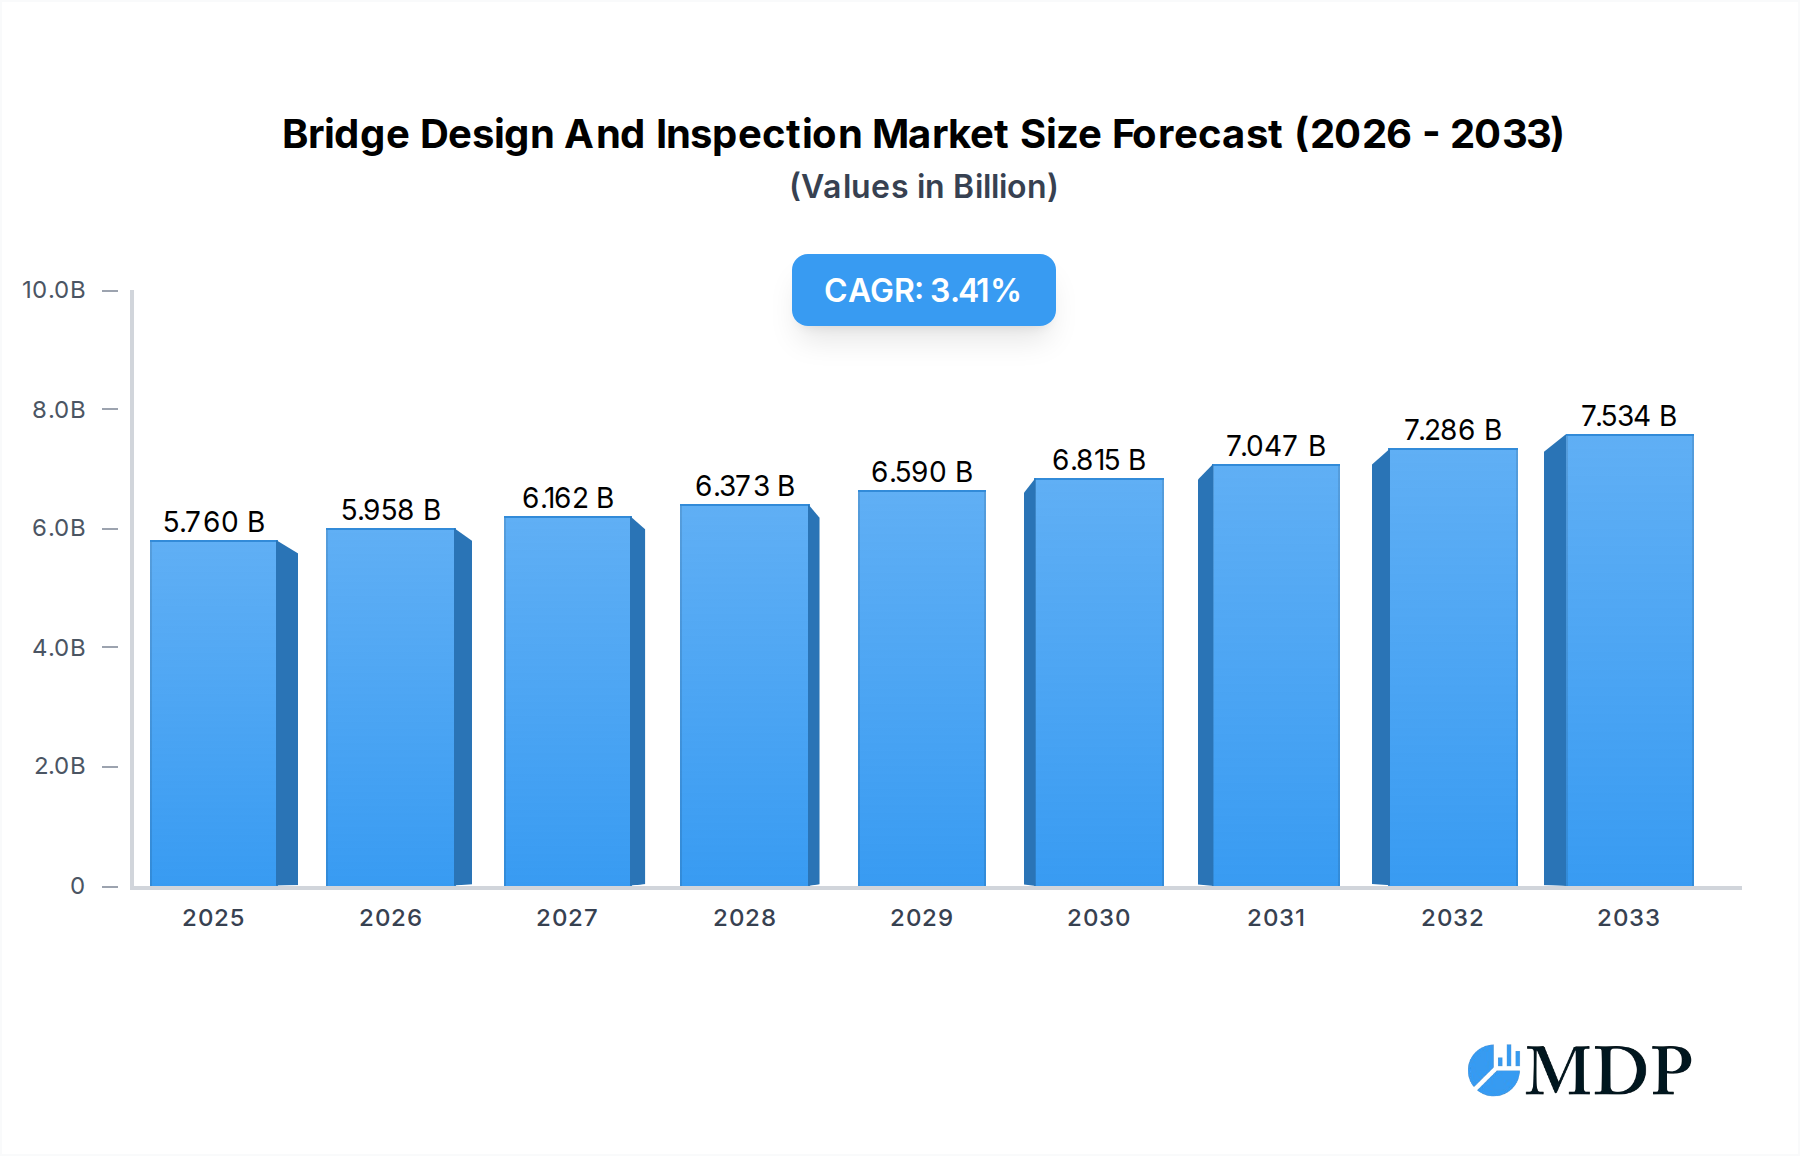
The global Bridge Design and Inspection market is poised for robust growth, with an estimated market size of $5.76 billion in 2025. This expansion is fueled by several critical drivers, including the increasing demand for advanced infrastructure development, particularly for vehicle and pedestrian bridges, and the growing emphasis on the safety and longevity of existing structures. Aging bridge stock in developed economies, coupled with significant infrastructure investment programs in emerging markets, presents a substantial opportunity for growth. Furthermore, the adoption of innovative technologies like AI-driven inspection tools, drone-based assessments, and Building Information Modeling (BIM) in bridge design is enhancing efficiency and accuracy, thereby contributing to market expansion. The market is projected to experience a Compound Annual Growth Rate (CAGR) of 4.35% through 2033, indicating a sustained upward trajectory. Key application segments driving this growth include vehicle bridges, crucial for transportation networks, and pedestrian bridges, vital for urban connectivity and recreational spaces.

Bridge Design And Inspection Market Size (In Billion)
While the market demonstrates strong growth potential, certain restraints need to be addressed. These include the high initial investment costs associated with advanced technologies and the stringent regulatory frameworks that can sometimes slow down the adoption of new design and inspection methodologies. Additionally, a shortage of skilled professionals with expertise in specialized bridge engineering and inspection techniques could pose a challenge. However, the overarching trend towards smart infrastructure and the increasing awareness of the economic and social impacts of bridge failures are expected to outweigh these limitations. The market is characterized by a competitive landscape with prominent players focusing on technological advancements, strategic collaborations, and expanding their service offerings across diverse geographical regions. Key application segments like vehicle bridges are expected to lead the market, followed by pedestrian bridges, while the Bridge Design and Bridge Inspection segments will continue to drive innovation and service delivery.
Bridge Design And Inspection Company Market Share
This comprehensive report delves into the global Bridge Design and Inspection market, offering a strategic roadmap for industry stakeholders navigating infrastructure development and maintenance. Analyzing trends from 2019 to 2033, with a base year of 2025 and an estimated year of 2025, this report provides invaluable insights into market dynamics, leading players, and future growth trajectories. It meticulously examines the burgeoning demand for robust bridge infrastructure, driven by increasing urbanization, aging structures, and the imperative for enhanced safety and efficiency. With a forecast period spanning 2025–2033 and historical data from 2019–2024, this report is your definitive guide to understanding and capitalizing on opportunities within this critical sector.
Bridge Design And Inspection Market Dynamics & Concentration
The Bridge Design and Inspection market exhibits a moderate to high concentration, with a significant presence of established engineering firms and specialized inspection service providers. Innovation drivers are primarily fueled by the increasing demand for advanced inspection technologies, such as drones, AI-powered analytics, and sensor networks, aiming to enhance efficiency and accuracy in structural assessments. Regulatory frameworks, emphasizing stringent safety standards and lifecycle management of bridges, play a pivotal role in shaping market activities. Product substitutes, while limited in core design and inspection functions, can include innovative materials or repair techniques that extend the lifespan of existing bridges, thereby influencing demand for new construction. End-user trends are characterized by a growing preference for sustainable and resilient infrastructure, coupled with a need for cost-effective maintenance solutions. Mergers and acquisitions (M&A) activities are evident as larger firms seek to expand their service portfolios and geographical reach, with approximately 150 M&A deals observed throughout the study period. Key players like SHE, Applus+, and Mistras Group hold substantial market shares, estimated to be between 5% and 10% each, reflecting the competitive landscape.
Bridge Design And Inspection Industry Trends & Analysis
The Bridge Design and Inspection industry is poised for substantial growth, projected to experience a Compound Annual Growth Rate (CAGR) of approximately 6.5% over the forecast period. This expansion is driven by a confluence of factors, including the ever-increasing global infrastructure spending, particularly on transportation networks, and the critical need to address the aging bridge stock across developed and developing nations. Technological disruptions are at the forefront of market evolution. The integration of Building Information Modeling (BIM) in design phases enhances collaboration and efficiency, while advanced inspection techniques, including unmanned aerial vehicles (UAVs) equipped with high-resolution cameras and LiDAR, alongside the application of artificial intelligence (AI) for data analysis, are revolutionizing the way bridges are assessed for structural integrity. Consumer preferences are shifting towards sustainable and resilient designs that can withstand extreme weather events and seismic activity, prompting a greater emphasis on innovative materials and construction methodologies. Competitive dynamics are intensifying, with both established players and new entrants vying for market share. Companies are increasingly focusing on offering integrated solutions that encompass the entire bridge lifecycle, from initial design and construction to ongoing inspection, maintenance, and rehabilitation. Market penetration is expected to deepen as governments and private entities recognize the long-term economic benefits of investing in robust and well-maintained bridge infrastructure, leading to an estimated market penetration of over 70% in key developed regions. The market size is projected to reach over one billion USD by the end of the forecast period.
Leading Markets & Segments in Bridge Design And Inspection
The Vehicle Bridges segment commands the largest market share within the Bridge Design and Inspection sector, driven by the extensive global reliance on road networks for commerce and transportation. The Bridge Design type also holds a dominant position, as continuous infrastructure development and upgrades necessitate new and improved bridge structures. Regionally, North America and Europe represent leading markets, largely due to substantial government investments in infrastructure renewal and a strong emphasis on safety regulations.
- Dominance of Vehicle Bridges:
- Economic Policies: Significant government stimulus packages and infrastructure funding initiatives in major economies directly translate into increased demand for vehicle bridge construction and maintenance.
- Infrastructure Development: Ongoing urban expansion and the need to connect growing populations and industries necessitate the construction of new arterial roads and associated bridges.
- Aging Infrastructure: A substantial portion of existing vehicle bridges in developed countries are nearing the end of their service life, requiring extensive inspection, repair, and replacement projects.
- Prevalence of Bridge Design:
- Technological Advancements: Innovations in design software and materials enable the creation of more efficient, durable, and aesthetically pleasing bridges, encouraging new construction.
- Traffic Volume Growth: Increasing vehicular traffic necessitates the widening or replacement of existing bridges and the construction of new ones to alleviate congestion.
- New Infrastructure Projects: Large-scale transportation projects, such as new highway systems and urban regeneration initiatives, are major drivers for bridge design services.
The market size for Vehicle Bridges is estimated to exceed five hundred billion USD, while the Bridge Design segment is valued at over four hundred billion USD. The forecast period anticipates continued strong growth in these segments, with the demand for advanced inspection technologies within these areas also projected to rise significantly, reaching an estimated two hundred billion USD.
Bridge Design And Inspection Product Developments
Product innovations in Bridge Design and Inspection are increasingly focused on enhancing data acquisition and analytical capabilities. The integration of IoT sensors for real-time structural health monitoring, advanced composite materials for lighter and stronger bridge components, and AI-driven predictive maintenance software are key developments. These innovations offer competitive advantages by improving inspection accuracy, reducing downtime, and extending the lifespan of bridges. Applications range from detailed structural analysis for new constructions to rapid defect identification and risk assessment for existing bridges. The market is witnessing a surge in drone-based inspection services, offering a safer and more cost-effective alternative to traditional methods.
Key Drivers of Bridge Design And Inspection Growth
The Bridge Design and Inspection market is propelled by several key drivers. Technological advancements in inspection tools, such as drones and advanced sensor technology, are enhancing efficiency and safety. Economic factors, including sustained government investment in infrastructure development and maintenance, particularly in response to aging bridge stock, are crucial. Regulatory frameworks mandating stringent safety standards and regular inspections also stimulate demand. Furthermore, the growing emphasis on resilient infrastructure capable of withstanding climate change impacts and natural disasters encourages innovative design and inspection approaches, contributing to an estimated one hundred billion USD in growth over the forecast period.
Challenges in the Bridge Design And Inspection Market
Despite robust growth, the Bridge Design and Inspection market faces several challenges. Regulatory hurdles related to the adoption of new technologies and the standardization of inspection protocols can slow down market penetration. Supply chain issues, particularly for specialized materials and advanced equipment, can lead to project delays and cost overruns. Intense competitive pressures among a growing number of service providers may also impact pricing and profit margins. The sheer scale of aging infrastructure requires significant capital investment, and funding constraints at local and national levels can limit the pace of necessary repairs and upgrades. These challenges collectively represent an estimated impediment of fifty billion USD to the market's full potential.
Emerging Opportunities in Bridge Design And Inspection
Emerging opportunities in the Bridge Design and Inspection market are primarily driven by technological breakthroughs and strategic market expansion. The development and widespread adoption of AI-powered predictive maintenance platforms present a significant catalyst for long-term growth, enabling proactive identification of potential issues before they become critical. Strategic partnerships between engineering firms, technology providers, and government agencies are crucial for developing comprehensive lifecycle management solutions. Furthermore, market expansion into emerging economies with rapidly developing infrastructure, coupled with a growing awareness of the importance of bridge safety, offers substantial untapped potential. The increasing focus on sustainability and green infrastructure also opens avenues for innovative design and material choices.
Leading Players in the Bridge Design And Inspection Sector
- SHE
- Applus+
- Mistras Group
- KCI Technologies
- River Structures
- VRX Global
- Collins Engineers
- Stantec
- TUV Rheinland
- Mabey Group
- ATS Engineering
- Burns & McDonnell
- Johnson, Mirmiran & Thompson
- Volkert
- Ayres Associates
- Kedmor Engineers
- Short Elliot Hendrickson
- Infrastructure Preservation Corporation
- Patriot Rail Company
- CEC Corporation
- Modjeski And Masters
- Baker Testing
- NTM Engineering
- Larson Design Group
- Clark Engineering
Key Milestones in Bridge Design And Inspection Industry
- 2019: Increased adoption of drone technology for visual bridge inspections, improving safety and efficiency.
- 2020: Advancements in AI algorithms for analyzing inspection data, leading to more accurate structural health assessments.
- 2021: Growing emphasis on the use of advanced composite materials in bridge repair and construction for enhanced durability.
- 2022: Rollout of government-funded infrastructure renewal programs in key regions, driving demand for design and inspection services.
- 2023: Emergence of digital twins for bridge lifecycle management, integrating design, construction, and maintenance data.
- 2024: Increased investment in resilient bridge designs to withstand extreme weather events, influenced by growing climate concerns.
Strategic Outlook for Bridge Design And Inspection Market
The strategic outlook for the Bridge Design and Inspection market is exceptionally positive, fueled by an ongoing commitment to infrastructure modernization and safety. Growth accelerators include the continued integration of digital technologies like AI, IoT, and BIM, which promise to revolutionize how bridges are designed, built, and maintained. The increasing global focus on sustainable infrastructure will also drive demand for innovative materials and eco-friendly design practices. Strategic opportunities lie in offering comprehensive, end-to-end solutions that cover the entire bridge lifecycle, from conceptualization to long-term monitoring and rehabilitation. Collaboration between public and private sectors will be critical in addressing funding gaps and accelerating the implementation of essential infrastructure upgrades, ensuring a future of safer, more resilient, and more efficient transportation networks. The market is projected to reach a valuation of over one billion USD by 2033.
Bridge Design And Inspection Segmentation
-
1. Application
- 1.1. Vehicle Bridges
- 1.2. Pedestrian Bridges
- 1.3. Others
-
2. Type
- 2.1. Bridge Design
- 2.2. Bridge Inspection
Bridge Design And Inspection Segmentation By Geography
-
1. North America
- 1.1. United States
- 1.2. Canada
- 1.3. Mexico
-
2. South America
- 2.1. Brazil
- 2.2. Argentina
- 2.3. Rest of South America
-
3. Europe
- 3.1. United Kingdom
- 3.2. Germany
- 3.3. France
- 3.4. Italy
- 3.5. Spain
- 3.6. Russia
- 3.7. Benelux
- 3.8. Nordics
- 3.9. Rest of Europe
-
4. Middle East & Africa
- 4.1. Turkey
- 4.2. Israel
- 4.3. GCC
- 4.4. North Africa
- 4.5. South Africa
- 4.6. Rest of Middle East & Africa
-
5. Asia Pacific
- 5.1. China
- 5.2. India
- 5.3. Japan
- 5.4. South Korea
- 5.5. ASEAN
- 5.6. Oceania
- 5.7. Rest of Asia Pacific
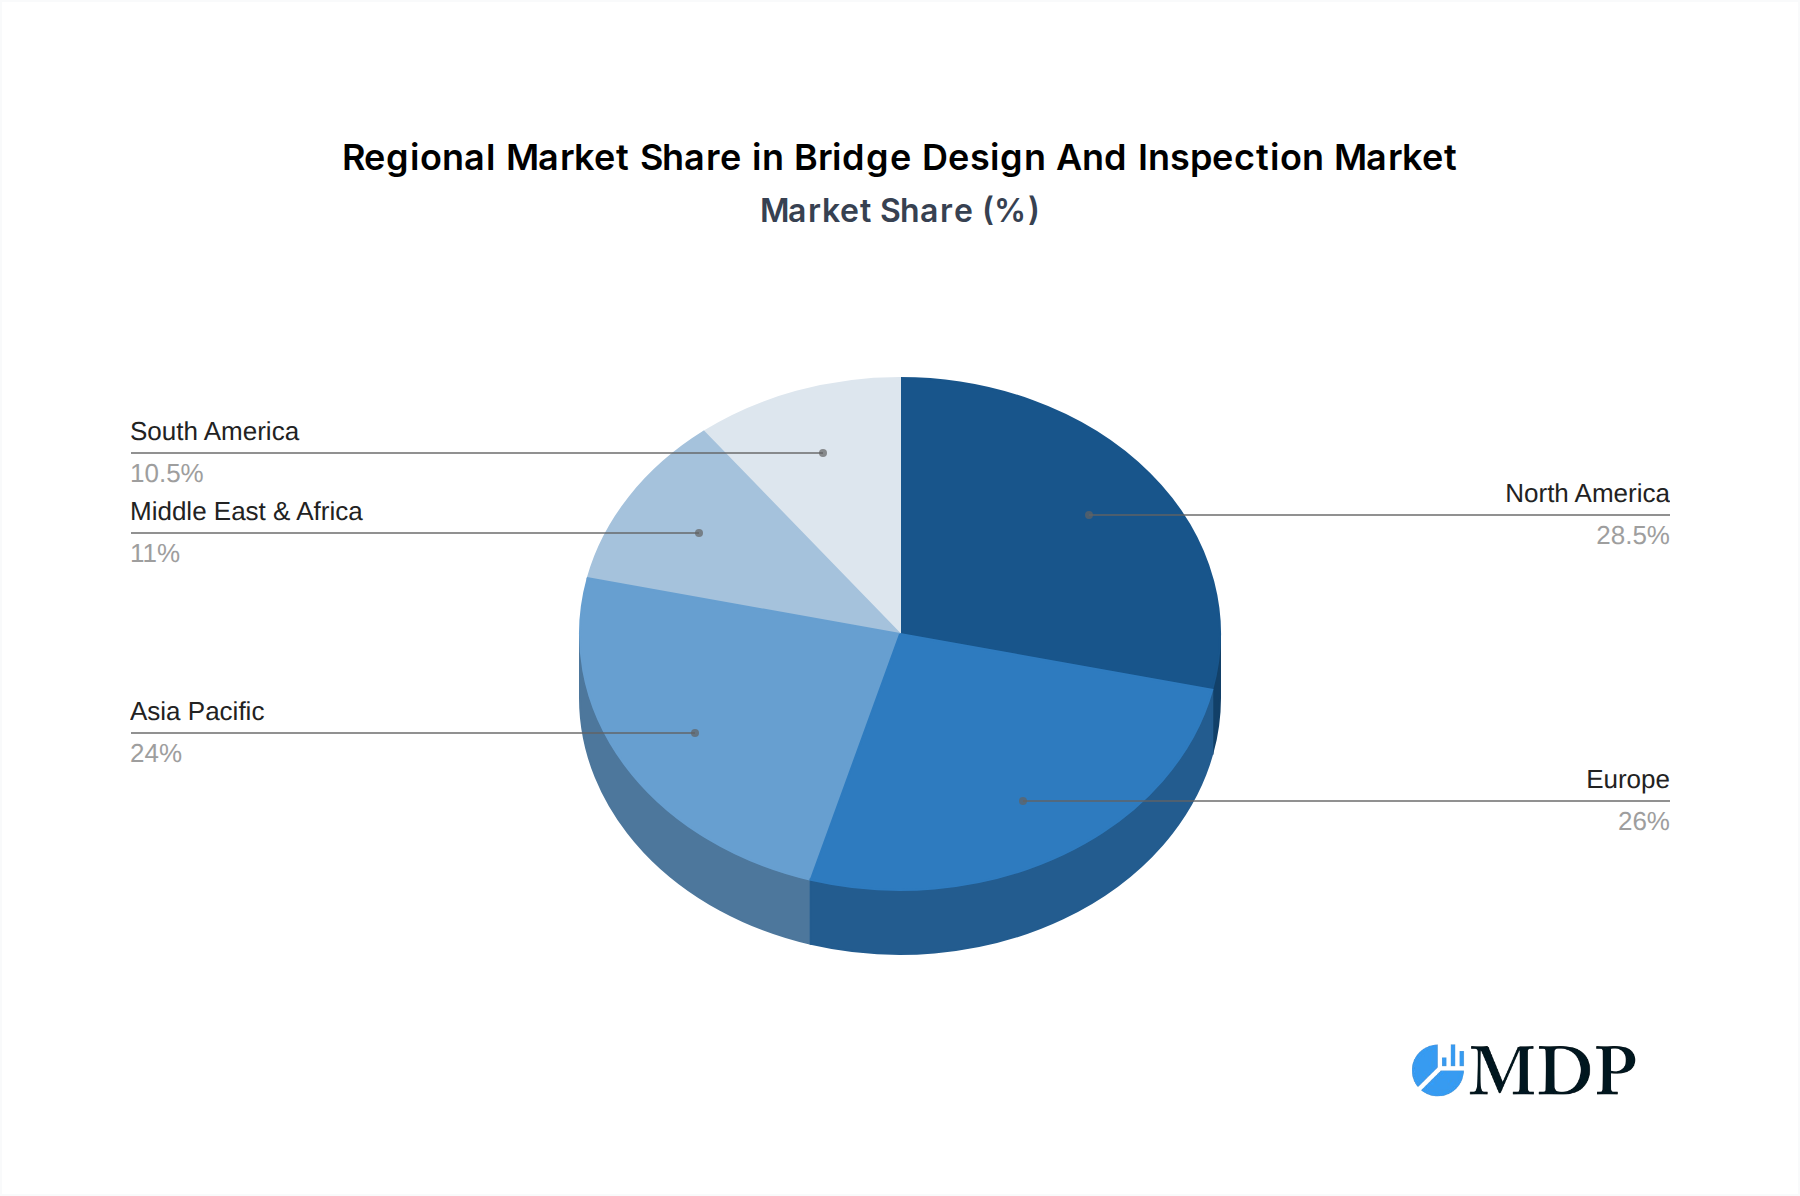
Bridge Design And Inspection Regional Market Share
Geographic Coverage of Bridge Design And Inspection
Bridge Design And Inspection REPORT HIGHLIGHTS
| Aspects | Details |
|---|---|
| Study Period | 2020-2034 |
| Base Year | 2025 |
| Estimated Year | 2026 |
| Forecast Period | 2026-2034 |
| Historical Period | 2020-2025 |
| Growth Rate | CAGR of 4.35% from 2020-2034 |
| Segmentation |
|
Table of Contents
- 1. Introduction
- 1.1. Research Scope
- 1.2. Market Segmentation
- 1.3. Research Methodology
- 1.4. Definitions and Assumptions
- 2. Executive Summary
- 2.1. Introduction
- 3. Market Dynamics
- 3.1. Introduction
- 3.2. Market Drivers
- 3.3. Market Restrains
- 3.4. Market Trends
- 4. Market Factor Analysis
- 4.1. Porters Five Forces
- 4.2. Supply/Value Chain
- 4.3. PESTEL analysis
- 4.4. Market Entropy
- 4.5. Patent/Trademark Analysis
- 5. Global Bridge Design And Inspection Analysis, Insights and Forecast, 2020-2032
- 5.1. Market Analysis, Insights and Forecast - by Application
- 5.1.1. Vehicle Bridges
- 5.1.2. Pedestrian Bridges
- 5.1.3. Others
- 5.2. Market Analysis, Insights and Forecast - by Type
- 5.2.1. Bridge Design
- 5.2.2. Bridge Inspection
- 5.3. Market Analysis, Insights and Forecast - by Region
- 5.3.1. North America
- 5.3.2. South America
- 5.3.3. Europe
- 5.3.4. Middle East & Africa
- 5.3.5. Asia Pacific
- 5.1. Market Analysis, Insights and Forecast - by Application
- 6. North America Bridge Design And Inspection Analysis, Insights and Forecast, 2020-2032
- 6.1. Market Analysis, Insights and Forecast - by Application
- 6.1.1. Vehicle Bridges
- 6.1.2. Pedestrian Bridges
- 6.1.3. Others
- 6.2. Market Analysis, Insights and Forecast - by Type
- 6.2.1. Bridge Design
- 6.2.2. Bridge Inspection
- 6.1. Market Analysis, Insights and Forecast - by Application
- 7. South America Bridge Design And Inspection Analysis, Insights and Forecast, 2020-2032
- 7.1. Market Analysis, Insights and Forecast - by Application
- 7.1.1. Vehicle Bridges
- 7.1.2. Pedestrian Bridges
- 7.1.3. Others
- 7.2. Market Analysis, Insights and Forecast - by Type
- 7.2.1. Bridge Design
- 7.2.2. Bridge Inspection
- 7.1. Market Analysis, Insights and Forecast - by Application
- 8. Europe Bridge Design And Inspection Analysis, Insights and Forecast, 2020-2032
- 8.1. Market Analysis, Insights and Forecast - by Application
- 8.1.1. Vehicle Bridges
- 8.1.2. Pedestrian Bridges
- 8.1.3. Others
- 8.2. Market Analysis, Insights and Forecast - by Type
- 8.2.1. Bridge Design
- 8.2.2. Bridge Inspection
- 8.1. Market Analysis, Insights and Forecast - by Application
- 9. Middle East & Africa Bridge Design And Inspection Analysis, Insights and Forecast, 2020-2032
- 9.1. Market Analysis, Insights and Forecast - by Application
- 9.1.1. Vehicle Bridges
- 9.1.2. Pedestrian Bridges
- 9.1.3. Others
- 9.2. Market Analysis, Insights and Forecast - by Type
- 9.2.1. Bridge Design
- 9.2.2. Bridge Inspection
- 9.1. Market Analysis, Insights and Forecast - by Application
- 10. Asia Pacific Bridge Design And Inspection Analysis, Insights and Forecast, 2020-2032
- 10.1. Market Analysis, Insights and Forecast - by Application
- 10.1.1. Vehicle Bridges
- 10.1.2. Pedestrian Bridges
- 10.1.3. Others
- 10.2. Market Analysis, Insights and Forecast - by Type
- 10.2.1. Bridge Design
- 10.2.2. Bridge Inspection
- 10.1. Market Analysis, Insights and Forecast - by Application
- 11. Competitive Analysis
- 11.1. Global Market Share Analysis 2025
- 11.2. Company Profiles
- 11.2.1 SHE
- 11.2.1.1. Overview
- 11.2.1.2. Products
- 11.2.1.3. SWOT Analysis
- 11.2.1.4. Recent Developments
- 11.2.1.5. Financials (Based on Availability)
- 11.2.2 Applus+
- 11.2.2.1. Overview
- 11.2.2.2. Products
- 11.2.2.3. SWOT Analysis
- 11.2.2.4. Recent Developments
- 11.2.2.5. Financials (Based on Availability)
- 11.2.3 Mistras Group
- 11.2.3.1. Overview
- 11.2.3.2. Products
- 11.2.3.3. SWOT Analysis
- 11.2.3.4. Recent Developments
- 11.2.3.5. Financials (Based on Availability)
- 11.2.4 KCI Technologies
- 11.2.4.1. Overview
- 11.2.4.2. Products
- 11.2.4.3. SWOT Analysis
- 11.2.4.4. Recent Developments
- 11.2.4.5. Financials (Based on Availability)
- 11.2.5 River Structures
- 11.2.5.1. Overview
- 11.2.5.2. Products
- 11.2.5.3. SWOT Analysis
- 11.2.5.4. Recent Developments
- 11.2.5.5. Financials (Based on Availability)
- 11.2.6 VRX Global
- 11.2.6.1. Overview
- 11.2.6.2. Products
- 11.2.6.3. SWOT Analysis
- 11.2.6.4. Recent Developments
- 11.2.6.5. Financials (Based on Availability)
- 11.2.7 Collins Engineers
- 11.2.7.1. Overview
- 11.2.7.2. Products
- 11.2.7.3. SWOT Analysis
- 11.2.7.4. Recent Developments
- 11.2.7.5. Financials (Based on Availability)
- 11.2.8 Stantec
- 11.2.8.1. Overview
- 11.2.8.2. Products
- 11.2.8.3. SWOT Analysis
- 11.2.8.4. Recent Developments
- 11.2.8.5. Financials (Based on Availability)
- 11.2.9 TUV Rheinland
- 11.2.9.1. Overview
- 11.2.9.2. Products
- 11.2.9.3. SWOT Analysis
- 11.2.9.4. Recent Developments
- 11.2.9.5. Financials (Based on Availability)
- 11.2.10 Mabey Group
- 11.2.10.1. Overview
- 11.2.10.2. Products
- 11.2.10.3. SWOT Analysis
- 11.2.10.4. Recent Developments
- 11.2.10.5. Financials (Based on Availability)
- 11.2.11 ATS Engineering
- 11.2.11.1. Overview
- 11.2.11.2. Products
- 11.2.11.3. SWOT Analysis
- 11.2.11.4. Recent Developments
- 11.2.11.5. Financials (Based on Availability)
- 11.2.12 Burns & McDonnell
- 11.2.12.1. Overview
- 11.2.12.2. Products
- 11.2.12.3. SWOT Analysis
- 11.2.12.4. Recent Developments
- 11.2.12.5. Financials (Based on Availability)
- 11.2.13 Johnson Mirmiran & Thompson
- 11.2.13.1. Overview
- 11.2.13.2. Products
- 11.2.13.3. SWOT Analysis
- 11.2.13.4. Recent Developments
- 11.2.13.5. Financials (Based on Availability)
- 11.2.14 Collins Engineers
- 11.2.14.1. Overview
- 11.2.14.2. Products
- 11.2.14.3. SWOT Analysis
- 11.2.14.4. Recent Developments
- 11.2.14.5. Financials (Based on Availability)
- 11.2.15 Volkert
- 11.2.15.1. Overview
- 11.2.15.2. Products
- 11.2.15.3. SWOT Analysis
- 11.2.15.4. Recent Developments
- 11.2.15.5. Financials (Based on Availability)
- 11.2.16 Ayres Associates
- 11.2.16.1. Overview
- 11.2.16.2. Products
- 11.2.16.3. SWOT Analysis
- 11.2.16.4. Recent Developments
- 11.2.16.5. Financials (Based on Availability)
- 11.2.17 Kedmor Engineers
- 11.2.17.1. Overview
- 11.2.17.2. Products
- 11.2.17.3. SWOT Analysis
- 11.2.17.4. Recent Developments
- 11.2.17.5. Financials (Based on Availability)
- 11.2.18 Short Elliot Hendrickson
- 11.2.18.1. Overview
- 11.2.18.2. Products
- 11.2.18.3. SWOT Analysis
- 11.2.18.4. Recent Developments
- 11.2.18.5. Financials (Based on Availability)
- 11.2.19 Infrastructure Preservation Corporation
- 11.2.19.1. Overview
- 11.2.19.2. Products
- 11.2.19.3. SWOT Analysis
- 11.2.19.4. Recent Developments
- 11.2.19.5. Financials (Based on Availability)
- 11.2.20 Patriot Rail Company
- 11.2.20.1. Overview
- 11.2.20.2. Products
- 11.2.20.3. SWOT Analysis
- 11.2.20.4. Recent Developments
- 11.2.20.5. Financials (Based on Availability)
- 11.2.21 CEC Corporation
- 11.2.21.1. Overview
- 11.2.21.2. Products
- 11.2.21.3. SWOT Analysis
- 11.2.21.4. Recent Developments
- 11.2.21.5. Financials (Based on Availability)
- 11.2.22 Modjeski And Masters
- 11.2.22.1. Overview
- 11.2.22.2. Products
- 11.2.22.3. SWOT Analysis
- 11.2.22.4. Recent Developments
- 11.2.22.5. Financials (Based on Availability)
- 11.2.23 Baker Testing
- 11.2.23.1. Overview
- 11.2.23.2. Products
- 11.2.23.3. SWOT Analysis
- 11.2.23.4. Recent Developments
- 11.2.23.5. Financials (Based on Availability)
- 11.2.24 NTM Engineering
- 11.2.24.1. Overview
- 11.2.24.2. Products
- 11.2.24.3. SWOT Analysis
- 11.2.24.4. Recent Developments
- 11.2.24.5. Financials (Based on Availability)
- 11.2.25 Larson Design Group
- 11.2.25.1. Overview
- 11.2.25.2. Products
- 11.2.25.3. SWOT Analysis
- 11.2.25.4. Recent Developments
- 11.2.25.5. Financials (Based on Availability)
- 11.2.26 Clark Engineering
- 11.2.26.1. Overview
- 11.2.26.2. Products
- 11.2.26.3. SWOT Analysis
- 11.2.26.4. Recent Developments
- 11.2.26.5. Financials (Based on Availability)
- 11.2.1 SHE
List of Figures
- Figure 1: Global Bridge Design And Inspection Revenue Breakdown (undefined, %) by Region 2025 & 2033
- Figure 2: North America Bridge Design And Inspection Revenue (undefined), by Application 2025 & 2033
- Figure 3: North America Bridge Design And Inspection Revenue Share (%), by Application 2025 & 2033
- Figure 4: North America Bridge Design And Inspection Revenue (undefined), by Type 2025 & 2033
- Figure 5: North America Bridge Design And Inspection Revenue Share (%), by Type 2025 & 2033
- Figure 6: North America Bridge Design And Inspection Revenue (undefined), by Country 2025 & 2033
- Figure 7: North America Bridge Design And Inspection Revenue Share (%), by Country 2025 & 2033
- Figure 8: South America Bridge Design And Inspection Revenue (undefined), by Application 2025 & 2033
- Figure 9: South America Bridge Design And Inspection Revenue Share (%), by Application 2025 & 2033
- Figure 10: South America Bridge Design And Inspection Revenue (undefined), by Type 2025 & 2033
- Figure 11: South America Bridge Design And Inspection Revenue Share (%), by Type 2025 & 2033
- Figure 12: South America Bridge Design And Inspection Revenue (undefined), by Country 2025 & 2033
- Figure 13: South America Bridge Design And Inspection Revenue Share (%), by Country 2025 & 2033
- Figure 14: Europe Bridge Design And Inspection Revenue (undefined), by Application 2025 & 2033
- Figure 15: Europe Bridge Design And Inspection Revenue Share (%), by Application 2025 & 2033
- Figure 16: Europe Bridge Design And Inspection Revenue (undefined), by Type 2025 & 2033
- Figure 17: Europe Bridge Design And Inspection Revenue Share (%), by Type 2025 & 2033
- Figure 18: Europe Bridge Design And Inspection Revenue (undefined), by Country 2025 & 2033
- Figure 19: Europe Bridge Design And Inspection Revenue Share (%), by Country 2025 & 2033
- Figure 20: Middle East & Africa Bridge Design And Inspection Revenue (undefined), by Application 2025 & 2033
- Figure 21: Middle East & Africa Bridge Design And Inspection Revenue Share (%), by Application 2025 & 2033
- Figure 22: Middle East & Africa Bridge Design And Inspection Revenue (undefined), by Type 2025 & 2033
- Figure 23: Middle East & Africa Bridge Design And Inspection Revenue Share (%), by Type 2025 & 2033
- Figure 24: Middle East & Africa Bridge Design And Inspection Revenue (undefined), by Country 2025 & 2033
- Figure 25: Middle East & Africa Bridge Design And Inspection Revenue Share (%), by Country 2025 & 2033
- Figure 26: Asia Pacific Bridge Design And Inspection Revenue (undefined), by Application 2025 & 2033
- Figure 27: Asia Pacific Bridge Design And Inspection Revenue Share (%), by Application 2025 & 2033
- Figure 28: Asia Pacific Bridge Design And Inspection Revenue (undefined), by Type 2025 & 2033
- Figure 29: Asia Pacific Bridge Design And Inspection Revenue Share (%), by Type 2025 & 2033
- Figure 30: Asia Pacific Bridge Design And Inspection Revenue (undefined), by Country 2025 & 2033
- Figure 31: Asia Pacific Bridge Design And Inspection Revenue Share (%), by Country 2025 & 2033
List of Tables
- Table 1: Global Bridge Design And Inspection Revenue undefined Forecast, by Application 2020 & 2033
- Table 2: Global Bridge Design And Inspection Revenue undefined Forecast, by Type 2020 & 2033
- Table 3: Global Bridge Design And Inspection Revenue undefined Forecast, by Region 2020 & 2033
- Table 4: Global Bridge Design And Inspection Revenue undefined Forecast, by Application 2020 & 2033
- Table 5: Global Bridge Design And Inspection Revenue undefined Forecast, by Type 2020 & 2033
- Table 6: Global Bridge Design And Inspection Revenue undefined Forecast, by Country 2020 & 2033
- Table 7: United States Bridge Design And Inspection Revenue (undefined) Forecast, by Application 2020 & 2033
- Table 8: Canada Bridge Design And Inspection Revenue (undefined) Forecast, by Application 2020 & 2033
- Table 9: Mexico Bridge Design And Inspection Revenue (undefined) Forecast, by Application 2020 & 2033
- Table 10: Global Bridge Design And Inspection Revenue undefined Forecast, by Application 2020 & 2033
- Table 11: Global Bridge Design And Inspection Revenue undefined Forecast, by Type 2020 & 2033
- Table 12: Global Bridge Design And Inspection Revenue undefined Forecast, by Country 2020 & 2033
- Table 13: Brazil Bridge Design And Inspection Revenue (undefined) Forecast, by Application 2020 & 2033
- Table 14: Argentina Bridge Design And Inspection Revenue (undefined) Forecast, by Application 2020 & 2033
- Table 15: Rest of South America Bridge Design And Inspection Revenue (undefined) Forecast, by Application 2020 & 2033
- Table 16: Global Bridge Design And Inspection Revenue undefined Forecast, by Application 2020 & 2033
- Table 17: Global Bridge Design And Inspection Revenue undefined Forecast, by Type 2020 & 2033
- Table 18: Global Bridge Design And Inspection Revenue undefined Forecast, by Country 2020 & 2033
- Table 19: United Kingdom Bridge Design And Inspection Revenue (undefined) Forecast, by Application 2020 & 2033
- Table 20: Germany Bridge Design And Inspection Revenue (undefined) Forecast, by Application 2020 & 2033
- Table 21: France Bridge Design And Inspection Revenue (undefined) Forecast, by Application 2020 & 2033
- Table 22: Italy Bridge Design And Inspection Revenue (undefined) Forecast, by Application 2020 & 2033
- Table 23: Spain Bridge Design And Inspection Revenue (undefined) Forecast, by Application 2020 & 2033
- Table 24: Russia Bridge Design And Inspection Revenue (undefined) Forecast, by Application 2020 & 2033
- Table 25: Benelux Bridge Design And Inspection Revenue (undefined) Forecast, by Application 2020 & 2033
- Table 26: Nordics Bridge Design And Inspection Revenue (undefined) Forecast, by Application 2020 & 2033
- Table 27: Rest of Europe Bridge Design And Inspection Revenue (undefined) Forecast, by Application 2020 & 2033
- Table 28: Global Bridge Design And Inspection Revenue undefined Forecast, by Application 2020 & 2033
- Table 29: Global Bridge Design And Inspection Revenue undefined Forecast, by Type 2020 & 2033
- Table 30: Global Bridge Design And Inspection Revenue undefined Forecast, by Country 2020 & 2033
- Table 31: Turkey Bridge Design And Inspection Revenue (undefined) Forecast, by Application 2020 & 2033
- Table 32: Israel Bridge Design And Inspection Revenue (undefined) Forecast, by Application 2020 & 2033
- Table 33: GCC Bridge Design And Inspection Revenue (undefined) Forecast, by Application 2020 & 2033
- Table 34: North Africa Bridge Design And Inspection Revenue (undefined) Forecast, by Application 2020 & 2033
- Table 35: South Africa Bridge Design And Inspection Revenue (undefined) Forecast, by Application 2020 & 2033
- Table 36: Rest of Middle East & Africa Bridge Design And Inspection Revenue (undefined) Forecast, by Application 2020 & 2033
- Table 37: Global Bridge Design And Inspection Revenue undefined Forecast, by Application 2020 & 2033
- Table 38: Global Bridge Design And Inspection Revenue undefined Forecast, by Type 2020 & 2033
- Table 39: Global Bridge Design And Inspection Revenue undefined Forecast, by Country 2020 & 2033
- Table 40: China Bridge Design And Inspection Revenue (undefined) Forecast, by Application 2020 & 2033
- Table 41: India Bridge Design And Inspection Revenue (undefined) Forecast, by Application 2020 & 2033
- Table 42: Japan Bridge Design And Inspection Revenue (undefined) Forecast, by Application 2020 & 2033
- Table 43: South Korea Bridge Design And Inspection Revenue (undefined) Forecast, by Application 2020 & 2033
- Table 44: ASEAN Bridge Design And Inspection Revenue (undefined) Forecast, by Application 2020 & 2033
- Table 45: Oceania Bridge Design And Inspection Revenue (undefined) Forecast, by Application 2020 & 2033
- Table 46: Rest of Asia Pacific Bridge Design And Inspection Revenue (undefined) Forecast, by Application 2020 & 2033
Frequently Asked Questions
1. What is the projected Compound Annual Growth Rate (CAGR) of the Bridge Design And Inspection?
The projected CAGR is approximately 4.35%.
2. Which companies are prominent players in the Bridge Design And Inspection?
Key companies in the market include SHE, Applus+, Mistras Group, KCI Technologies, River Structures, VRX Global, Collins Engineers, Stantec, TUV Rheinland, Mabey Group, ATS Engineering, Burns & McDonnell, Johnson, Mirmiran & Thompson, Collins Engineers, Volkert, Ayres Associates, Kedmor Engineers, Short Elliot Hendrickson, Infrastructure Preservation Corporation, Patriot Rail Company, CEC Corporation, Modjeski And Masters, Baker Testing, NTM Engineering, Larson Design Group, Clark Engineering.
3. What are the main segments of the Bridge Design And Inspection?
The market segments include Application, Type.
4. Can you provide details about the market size?
The market size is estimated to be USD XXX N/A as of 2022.
5. What are some drivers contributing to market growth?
N/A
6. What are the notable trends driving market growth?
N/A
7. Are there any restraints impacting market growth?
N/A
8. Can you provide examples of recent developments in the market?
N/A
9. What pricing options are available for accessing the report?
Pricing options include single-user, multi-user, and enterprise licenses priced at USD 3950.00, USD 5925.00, and USD 7900.00 respectively.
10. Is the market size provided in terms of value or volume?
The market size is provided in terms of value, measured in N/A.
11. Are there any specific market keywords associated with the report?
Yes, the market keyword associated with the report is "Bridge Design And Inspection," which aids in identifying and referencing the specific market segment covered.
12. How do I determine which pricing option suits my needs best?
The pricing options vary based on user requirements and access needs. Individual users may opt for single-user licenses, while businesses requiring broader access may choose multi-user or enterprise licenses for cost-effective access to the report.
13. Are there any additional resources or data provided in the Bridge Design And Inspection report?
While the report offers comprehensive insights, it's advisable to review the specific contents or supplementary materials provided to ascertain if additional resources or data are available.
14. How can I stay updated on further developments or reports in the Bridge Design And Inspection?
To stay informed about further developments, trends, and reports in the Bridge Design And Inspection, consider subscribing to industry newsletters, following relevant companies and organizations, or regularly checking reputable industry news sources and publications.
Methodology
Step 1 - Identification of Relevant Samples Size from Population Database


Step 2 - Approaches for Defining Global Market Size (Value, Volume* & Price*)

Note*: In applicable scenarios
Step 3 - Data Sources
Primary Research
- Web Analytics
- Survey Reports
- Research Institute
- Latest Research Reports
- Opinion Leaders
Secondary Research
- Annual Reports
- White Paper
- Latest Press Release
- Industry Association
- Paid Database
- Investor Presentations

Step 4 - Data Triangulation
Involves using different sources of information in order to increase the validity of a study
These sources are likely to be stakeholders in a program - participants, other researchers, program staff, other community members, and so on.
Then we put all data in single framework & apply various statistical tools to find out the dynamic on the market.
During the analysis stage, feedback from the stakeholder groups would be compared to determine areas of agreement as well as areas of divergence