

Key Insights
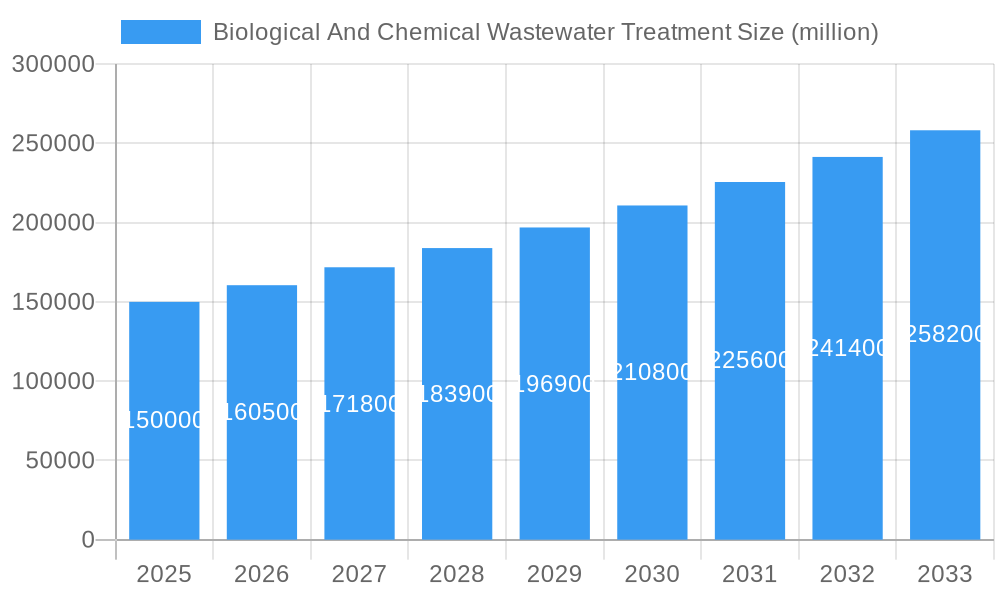
The global biological and chemical wastewater treatment market is experiencing robust growth, driven by stringent environmental regulations, increasing industrialization, and a rising awareness of water conservation. The market, estimated at $150 billion in 2025, is projected to exhibit a Compound Annual Growth Rate (CAGR) of 7% from 2025 to 2033, reaching approximately $250 billion by 2033. Key drivers include the escalating demand for clean water in various sectors, such as pulp and paper, meat and poultry processing, pharmaceuticals, and chemicals. Technological advancements in anaerobic and aerobic treatment methods, coupled with the development of efficient and sustainable solutions, are further fueling market expansion. The increasing adoption of advanced oxidation processes (AOPs) and membrane bioreactors (MBRs) is significantly impacting the market landscape. Geographic growth is uneven, with North America and Europe currently holding significant market share due to established infrastructure and stringent regulations. However, rapid industrialization in Asia Pacific, particularly in China and India, is creating lucrative growth opportunities in the coming years. Challenges remain, however, including the high initial investment costs associated with wastewater treatment plants and the need for skilled professionals to operate and maintain these facilities.
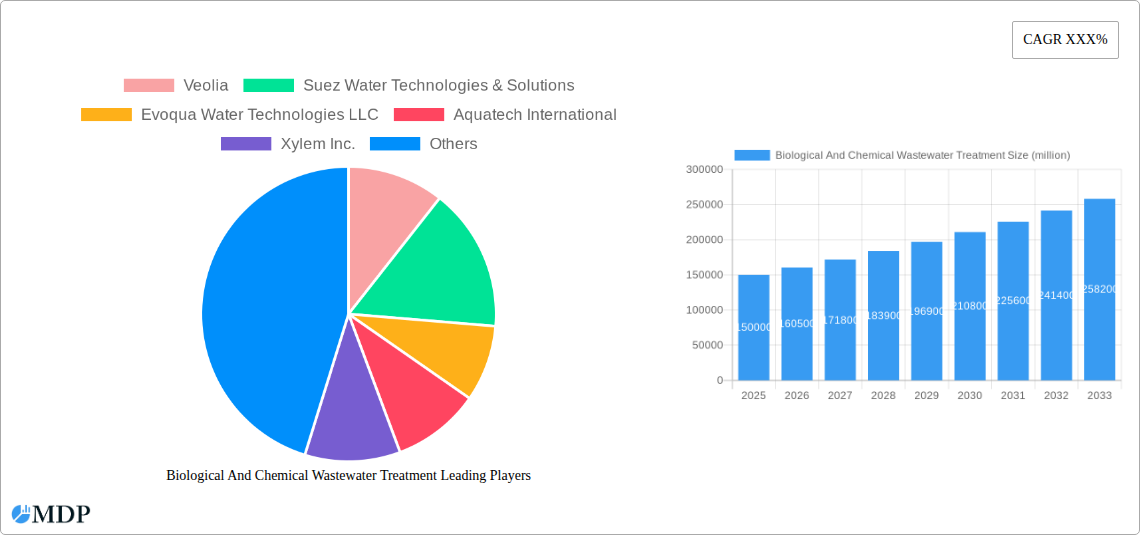
Biological And Chemical Wastewater Treatment Market Size (In Billion)
The market segmentation reveals a significant contribution from the pulp and paper industry, followed by the meat and poultry sector. Aerobic treatment dominates the type segment, reflecting its widespread adoption due to its relatively simpler operation and lower cost. Major players such as Veolia, Suez, Evoqua, and Xylem are shaping the market through technological innovations, strategic partnerships, and geographical expansion. The competitive landscape is characterized by both established multinational corporations and specialized smaller companies focusing on niche technologies. Future growth will be influenced by government policies promoting sustainable water management, advancements in artificial intelligence (AI) and machine learning (ML) for optimized treatment processes, and the growing adoption of circular economy principles to reduce water consumption and waste generation. The continuous development and deployment of more cost-effective and efficient biological and chemical wastewater treatment technologies is expected to further accelerate market growth.
Biological And Chemical Wastewater Treatment Company Market Share
Biological and Chemical Wastewater Treatment Market Report: 2019-2033
This comprehensive report provides an in-depth analysis of the global biological and chemical wastewater treatment market, projecting a market value of $XX million by 2033. The study covers the period from 2019 to 2033, with 2025 as the base and estimated year. This report is essential for industry stakeholders, investors, and researchers seeking actionable insights into this rapidly evolving sector. Key segments explored include Pulp & Paper, Meat & Poultry, Chemicals, Pharmaceuticals, and Others applications, along with Aerobic and Anaerobic treatment types. Leading companies such as Veolia, Suez, and Xylem are analyzed for their market strategies and impact.
Biological And Chemical Wastewater Treatment Market Dynamics & Concentration
The global biological and chemical wastewater treatment market is characterized by moderate concentration, with the top 10 players holding approximately 55% market share in 2024. Innovation is driven by stringent environmental regulations, the increasing demand for sustainable water management solutions, and the need to improve treatment efficiency and reduce operational costs. The market witnesses continuous M&A activity, with approximately XX deals recorded between 2019 and 2024, primarily focused on expanding geographic reach and technological capabilities. Key regulatory frameworks such as the Clean Water Act (in the US) and the EU Water Framework Directive significantly influence market growth. Product substitutes, like advanced oxidation processes, are gaining traction but are currently niche offerings. End-user trends show an increasing preference for sustainable, energy-efficient treatment solutions.
- Market Concentration: Top 10 players hold ~55% market share (2024).
- M&A Activity: Approximately XX deals between 2019-2024.
- Key Regulatory Drivers: Clean Water Act (US), EU Water Framework Directive.
- Product Substitutes: Advanced oxidation processes showing increasing adoption.
Biological And Chemical Wastewater Treatment Industry Trends & Analysis
The biological and chemical wastewater treatment market exhibits a robust CAGR of XX% during the forecast period (2025-2033), driven by rising industrial wastewater generation, increasing environmental awareness, and technological advancements. Significant technological disruptions include the integration of AI and IoT for real-time monitoring and optimization, the development of more efficient bioreactors, and the commercialization of advanced oxidation processes. Consumer preferences lean towards cost-effective, environmentally friendly, and energy-efficient solutions. The competitive landscape is highly fragmented, with companies focusing on differentiation through technological innovation, service offerings, and strategic partnerships. Market penetration of advanced technologies is estimated at XX% in 2025 and projected to increase to XX% by 2033.
Leading Markets & Segments in Biological And Chemical Wastewater Treatment
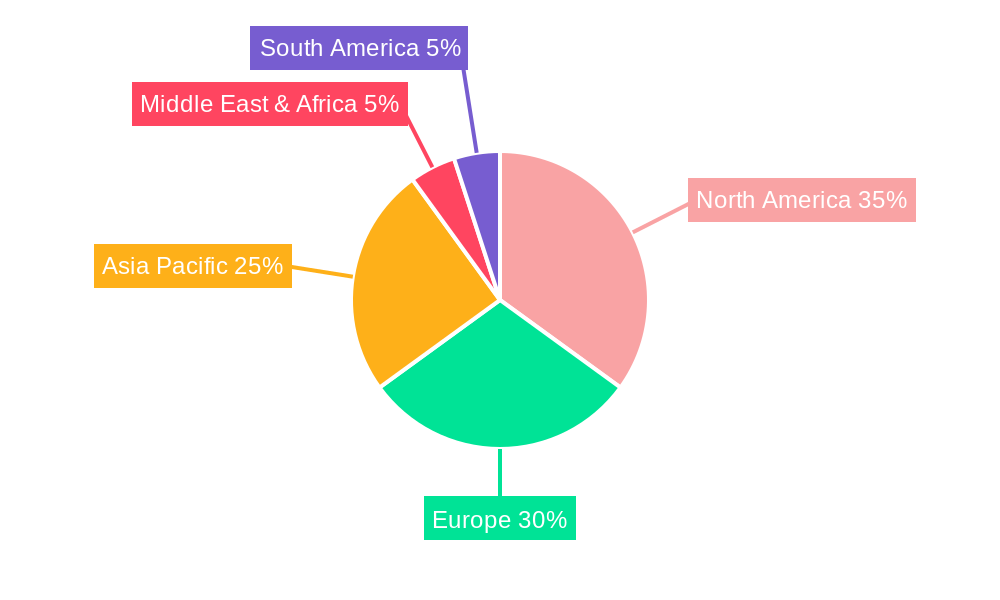
The Chemicals segment dominates the application landscape, accounting for approximately 30% of the market in 2025, primarily due to stringent regulatory requirements and the high volume of wastewater generated. Geographically, North America and Europe represent the largest markets, driven by robust industrial activity and stringent environmental regulations. Aerobic treatment technologies hold a larger market share compared to anaerobic systems, attributed to their relative simplicity and ease of operation.
- Dominant Application: Chemicals (30% market share in 2025)
- Dominant Region: North America and Europe.
- Dominant Type: Aerobic Treatment.
Key Drivers:
- Stringent Environmental Regulations: Driving the adoption of advanced treatment technologies.
- Industrial Growth: Increased wastewater generation in key sectors.
- Economic Policies: Government incentives and subsidies for sustainable water management.
- Infrastructure Development: Investments in wastewater treatment plants and infrastructure.
Biological And Chemical Wastewater Treatment Product Developments
Recent product innovations include the development of membrane bioreactors, advanced oxidation processes, and AI-powered monitoring systems. These advancements offer enhanced treatment efficiency, reduced energy consumption, and improved process control. Companies are focusing on developing customized solutions to address the specific needs of different industries, leading to increased market fit and competitive advantages.
Key Drivers of Biological And Chemical Wastewater Treatment Growth
The market's growth is fueled by several factors:
- Stringent Environmental Regulations: Globally increasing pressure to reduce water pollution.
- Industrial Growth: Expanding industries across various sectors leading to increased wastewater generation.
- Technological Advancements: Improved efficiency, reduced costs, and sustainable solutions.
Challenges in the Biological And Chemical Wastewater Treatment Market
Significant challenges include the high initial investment costs for advanced treatment technologies, the complexity of managing diverse wastewater streams, and intense competition amongst numerous market players. Regulatory hurdles and the variability in wastewater composition can also pose operational challenges. Supply chain disruptions related to critical components can impact project timelines and budgets, creating significant financial impacts in the range of XX million dollars annually for the industry.
Emerging Opportunities in Biological And Chemical Wastewater Treatment
Long-term growth is driven by technological breakthroughs like advanced membrane technologies and AI-powered optimization systems. Strategic partnerships between treatment providers and industrial end-users create mutually beneficial solutions. Expanding market penetration into developing economies presents substantial growth opportunities.
Leading Players in the Biological And Chemical Wastewater Treatment Sector
- Veolia
- Suez Water Technologies & Solutions
- Evoqua Water Technologies LLC
- Aquatech International
- Xylem Inc.
- Condorchem Envitech, S.L.
- Ecolab Inc.
- Pentair Plc
- Samco Technologies, Inc.
- DAS Environmental Expert GmbH
- Microvi Biotech, Inc.
- Organica Water, Inc.
- Dryden Aqua Ltd.
Key Milestones in Biological And Chemical Wastewater Treatment Industry
- 2020: Launch of AI-powered wastewater monitoring system by Xylem.
- 2021: Veolia acquires a smaller wastewater treatment company, expanding its portfolio.
- 2022: Suez introduces a new membrane bioreactor technology, boosting treatment efficiency.
- 2023: Significant regulatory changes in the EU impact market dynamics.
- 2024: Increased adoption of anaerobic digestion solutions for enhanced biogas production.
Strategic Outlook for Biological And Chemical Wastewater Treatment Market
The biological and chemical wastewater treatment market is poised for significant growth, driven by technological innovations and increasing environmental awareness. Strategic opportunities lie in developing sustainable and energy-efficient solutions, fostering collaborations across the value chain, and expanding into emerging markets. Focusing on providing customized solutions and leveraging data-driven insights will be crucial for success in this dynamic market.
Biological And Chemical Wastewater Treatment Segmentation
-
1. Application
- 1.1. Pulp & Paper
- 1.2. Meat & Poultry
- 1.3. Chemicals
- 1.4. Pharmaceuticals
- 1.5. Others
-
2. Type
- 2.1. Aerobic
- 2.2. Anaerobic
Biological And Chemical Wastewater Treatment Segmentation By Geography
-
1. North America
- 1.1. United States
- 1.2. Canada
- 1.3. Mexico
-
2. South America
- 2.1. Brazil
- 2.2. Argentina
- 2.3. Rest of South America
-
3. Europe
- 3.1. United Kingdom
- 3.2. Germany
- 3.3. France
- 3.4. Italy
- 3.5. Spain
- 3.6. Russia
- 3.7. Benelux
- 3.8. Nordics
- 3.9. Rest of Europe
-
4. Middle East & Africa
- 4.1. Turkey
- 4.2. Israel
- 4.3. GCC
- 4.4. North Africa
- 4.5. South Africa
- 4.6. Rest of Middle East & Africa
-
5. Asia Pacific
- 5.1. China
- 5.2. India
- 5.3. Japan
- 5.4. South Korea
- 5.5. ASEAN
- 5.6. Oceania
- 5.7. Rest of Asia Pacific
Biological And Chemical Wastewater Treatment Regional Market Share
Geographic Coverage of Biological And Chemical Wastewater Treatment
Biological And Chemical Wastewater Treatment REPORT HIGHLIGHTS
| Aspects | Details |
|---|---|
| Study Period | 2020-2034 |
| Base Year | 2025 |
| Estimated Year | 2026 |
| Forecast Period | 2026-2034 |
| Historical Period | 2020-2025 |
| Growth Rate | CAGR of 6.1% from 2020-2034 |
| Segmentation |
|
Table of Contents
- 1. Introduction
- 1.1. Research Scope
- 1.2. Market Segmentation
- 1.3. Research Methodology
- 1.4. Definitions and Assumptions
- 2. Executive Summary
- 2.1. Introduction
- 3. Market Dynamics
- 3.1. Introduction
- 3.2. Market Drivers
- 3.3. Market Restrains
- 3.4. Market Trends
- 4. Market Factor Analysis
- 4.1. Porters Five Forces
- 4.2. Supply/Value Chain
- 4.3. PESTEL analysis
- 4.4. Market Entropy
- 4.5. Patent/Trademark Analysis
- 5. Global Biological And Chemical Wastewater Treatment Analysis, Insights and Forecast, 2020-2032
- 5.1. Market Analysis, Insights and Forecast - by Application
- 5.1.1. Pulp & Paper
- 5.1.2. Meat & Poultry
- 5.1.3. Chemicals
- 5.1.4. Pharmaceuticals
- 5.1.5. Others
- 5.2. Market Analysis, Insights and Forecast - by Type
- 5.2.1. Aerobic
- 5.2.2. Anaerobic
- 5.3. Market Analysis, Insights and Forecast - by Region
- 5.3.1. North America
- 5.3.2. South America
- 5.3.3. Europe
- 5.3.4. Middle East & Africa
- 5.3.5. Asia Pacific
- 5.1. Market Analysis, Insights and Forecast - by Application
- 6. North America Biological And Chemical Wastewater Treatment Analysis, Insights and Forecast, 2020-2032
- 6.1. Market Analysis, Insights and Forecast - by Application
- 6.1.1. Pulp & Paper
- 6.1.2. Meat & Poultry
- 6.1.3. Chemicals
- 6.1.4. Pharmaceuticals
- 6.1.5. Others
- 6.2. Market Analysis, Insights and Forecast - by Type
- 6.2.1. Aerobic
- 6.2.2. Anaerobic
- 6.1. Market Analysis, Insights and Forecast - by Application
- 7. South America Biological And Chemical Wastewater Treatment Analysis, Insights and Forecast, 2020-2032
- 7.1. Market Analysis, Insights and Forecast - by Application
- 7.1.1. Pulp & Paper
- 7.1.2. Meat & Poultry
- 7.1.3. Chemicals
- 7.1.4. Pharmaceuticals
- 7.1.5. Others
- 7.2. Market Analysis, Insights and Forecast - by Type
- 7.2.1. Aerobic
- 7.2.2. Anaerobic
- 7.1. Market Analysis, Insights and Forecast - by Application
- 8. Europe Biological And Chemical Wastewater Treatment Analysis, Insights and Forecast, 2020-2032
- 8.1. Market Analysis, Insights and Forecast - by Application
- 8.1.1. Pulp & Paper
- 8.1.2. Meat & Poultry
- 8.1.3. Chemicals
- 8.1.4. Pharmaceuticals
- 8.1.5. Others
- 8.2. Market Analysis, Insights and Forecast - by Type
- 8.2.1. Aerobic
- 8.2.2. Anaerobic
- 8.1. Market Analysis, Insights and Forecast - by Application
- 9. Middle East & Africa Biological And Chemical Wastewater Treatment Analysis, Insights and Forecast, 2020-2032
- 9.1. Market Analysis, Insights and Forecast - by Application
- 9.1.1. Pulp & Paper
- 9.1.2. Meat & Poultry
- 9.1.3. Chemicals
- 9.1.4. Pharmaceuticals
- 9.1.5. Others
- 9.2. Market Analysis, Insights and Forecast - by Type
- 9.2.1. Aerobic
- 9.2.2. Anaerobic
- 9.1. Market Analysis, Insights and Forecast - by Application
- 10. Asia Pacific Biological And Chemical Wastewater Treatment Analysis, Insights and Forecast, 2020-2032
- 10.1. Market Analysis, Insights and Forecast - by Application
- 10.1.1. Pulp & Paper
- 10.1.2. Meat & Poultry
- 10.1.3. Chemicals
- 10.1.4. Pharmaceuticals
- 10.1.5. Others
- 10.2. Market Analysis, Insights and Forecast - by Type
- 10.2.1. Aerobic
- 10.2.2. Anaerobic
- 10.1. Market Analysis, Insights and Forecast - by Application
- 11. Competitive Analysis
- 11.1. Global Market Share Analysis 2025
- 11.2. Company Profiles
- 11.2.1 Veolia
- 11.2.1.1. Overview
- 11.2.1.2. Products
- 11.2.1.3. SWOT Analysis
- 11.2.1.4. Recent Developments
- 11.2.1.5. Financials (Based on Availability)
- 11.2.2 Suez Water Technologies & Solutions
- 11.2.2.1. Overview
- 11.2.2.2. Products
- 11.2.2.3. SWOT Analysis
- 11.2.2.4. Recent Developments
- 11.2.2.5. Financials (Based on Availability)
- 11.2.3 Evoqua Water Technologies LLC
- 11.2.3.1. Overview
- 11.2.3.2. Products
- 11.2.3.3. SWOT Analysis
- 11.2.3.4. Recent Developments
- 11.2.3.5. Financials (Based on Availability)
- 11.2.4 Aquatech International
- 11.2.4.1. Overview
- 11.2.4.2. Products
- 11.2.4.3. SWOT Analysis
- 11.2.4.4. Recent Developments
- 11.2.4.5. Financials (Based on Availability)
- 11.2.5 Xylem Inc.
- 11.2.5.1. Overview
- 11.2.5.2. Products
- 11.2.5.3. SWOT Analysis
- 11.2.5.4. Recent Developments
- 11.2.5.5. Financials (Based on Availability)
- 11.2.6 Condorchem Envitech S.L.
- 11.2.6.1. Overview
- 11.2.6.2. Products
- 11.2.6.3. SWOT Analysis
- 11.2.6.4. Recent Developments
- 11.2.6.5. Financials (Based on Availability)
- 11.2.7 Ecolab Inc.
- 11.2.7.1. Overview
- 11.2.7.2. Products
- 11.2.7.3. SWOT Analysis
- 11.2.7.4. Recent Developments
- 11.2.7.5. Financials (Based on Availability)
- 11.2.8 Pentair Plc
- 11.2.8.1. Overview
- 11.2.8.2. Products
- 11.2.8.3. SWOT Analysis
- 11.2.8.4. Recent Developments
- 11.2.8.5. Financials (Based on Availability)
- 11.2.9 Samco Technologies Inc.
- 11.2.9.1. Overview
- 11.2.9.2. Products
- 11.2.9.3. SWOT Analysis
- 11.2.9.4. Recent Developments
- 11.2.9.5. Financials (Based on Availability)
- 11.2.10 DAS Environmental Expert GmbH
- 11.2.10.1. Overview
- 11.2.10.2. Products
- 11.2.10.3. SWOT Analysis
- 11.2.10.4. Recent Developments
- 11.2.10.5. Financials (Based on Availability)
- 11.2.11 Microvi Biotech Inc.
- 11.2.11.1. Overview
- 11.2.11.2. Products
- 11.2.11.3. SWOT Analysis
- 11.2.11.4. Recent Developments
- 11.2.11.5. Financials (Based on Availability)
- 11.2.12 Organica Water Inc.
- 11.2.12.1. Overview
- 11.2.12.2. Products
- 11.2.12.3. SWOT Analysis
- 11.2.12.4. Recent Developments
- 11.2.12.5. Financials (Based on Availability)
- 11.2.13 Dryden Aqua Ltd.
- 11.2.13.1. Overview
- 11.2.13.2. Products
- 11.2.13.3. SWOT Analysis
- 11.2.13.4. Recent Developments
- 11.2.13.5. Financials (Based on Availability)
- 11.2.1 Veolia
List of Figures
- Figure 1: Global Biological And Chemical Wastewater Treatment Revenue Breakdown (undefined, %) by Region 2025 & 2033
- Figure 2: North America Biological And Chemical Wastewater Treatment Revenue (undefined), by Application 2025 & 2033
- Figure 3: North America Biological And Chemical Wastewater Treatment Revenue Share (%), by Application 2025 & 2033
- Figure 4: North America Biological And Chemical Wastewater Treatment Revenue (undefined), by Type 2025 & 2033
- Figure 5: North America Biological And Chemical Wastewater Treatment Revenue Share (%), by Type 2025 & 2033
- Figure 6: North America Biological And Chemical Wastewater Treatment Revenue (undefined), by Country 2025 & 2033
- Figure 7: North America Biological And Chemical Wastewater Treatment Revenue Share (%), by Country 2025 & 2033
- Figure 8: South America Biological And Chemical Wastewater Treatment Revenue (undefined), by Application 2025 & 2033
- Figure 9: South America Biological And Chemical Wastewater Treatment Revenue Share (%), by Application 2025 & 2033
- Figure 10: South America Biological And Chemical Wastewater Treatment Revenue (undefined), by Type 2025 & 2033
- Figure 11: South America Biological And Chemical Wastewater Treatment Revenue Share (%), by Type 2025 & 2033
- Figure 12: South America Biological And Chemical Wastewater Treatment Revenue (undefined), by Country 2025 & 2033
- Figure 13: South America Biological And Chemical Wastewater Treatment Revenue Share (%), by Country 2025 & 2033
- Figure 14: Europe Biological And Chemical Wastewater Treatment Revenue (undefined), by Application 2025 & 2033
- Figure 15: Europe Biological And Chemical Wastewater Treatment Revenue Share (%), by Application 2025 & 2033
- Figure 16: Europe Biological And Chemical Wastewater Treatment Revenue (undefined), by Type 2025 & 2033
- Figure 17: Europe Biological And Chemical Wastewater Treatment Revenue Share (%), by Type 2025 & 2033
- Figure 18: Europe Biological And Chemical Wastewater Treatment Revenue (undefined), by Country 2025 & 2033
- Figure 19: Europe Biological And Chemical Wastewater Treatment Revenue Share (%), by Country 2025 & 2033
- Figure 20: Middle East & Africa Biological And Chemical Wastewater Treatment Revenue (undefined), by Application 2025 & 2033
- Figure 21: Middle East & Africa Biological And Chemical Wastewater Treatment Revenue Share (%), by Application 2025 & 2033
- Figure 22: Middle East & Africa Biological And Chemical Wastewater Treatment Revenue (undefined), by Type 2025 & 2033
- Figure 23: Middle East & Africa Biological And Chemical Wastewater Treatment Revenue Share (%), by Type 2025 & 2033
- Figure 24: Middle East & Africa Biological And Chemical Wastewater Treatment Revenue (undefined), by Country 2025 & 2033
- Figure 25: Middle East & Africa Biological And Chemical Wastewater Treatment Revenue Share (%), by Country 2025 & 2033
- Figure 26: Asia Pacific Biological And Chemical Wastewater Treatment Revenue (undefined), by Application 2025 & 2033
- Figure 27: Asia Pacific Biological And Chemical Wastewater Treatment Revenue Share (%), by Application 2025 & 2033
- Figure 28: Asia Pacific Biological And Chemical Wastewater Treatment Revenue (undefined), by Type 2025 & 2033
- Figure 29: Asia Pacific Biological And Chemical Wastewater Treatment Revenue Share (%), by Type 2025 & 2033
- Figure 30: Asia Pacific Biological And Chemical Wastewater Treatment Revenue (undefined), by Country 2025 & 2033
- Figure 31: Asia Pacific Biological And Chemical Wastewater Treatment Revenue Share (%), by Country 2025 & 2033
List of Tables
- Table 1: Global Biological And Chemical Wastewater Treatment Revenue undefined Forecast, by Application 2020 & 2033
- Table 2: Global Biological And Chemical Wastewater Treatment Revenue undefined Forecast, by Type 2020 & 2033
- Table 3: Global Biological And Chemical Wastewater Treatment Revenue undefined Forecast, by Region 2020 & 2033
- Table 4: Global Biological And Chemical Wastewater Treatment Revenue undefined Forecast, by Application 2020 & 2033
- Table 5: Global Biological And Chemical Wastewater Treatment Revenue undefined Forecast, by Type 2020 & 2033
- Table 6: Global Biological And Chemical Wastewater Treatment Revenue undefined Forecast, by Country 2020 & 2033
- Table 7: United States Biological And Chemical Wastewater Treatment Revenue (undefined) Forecast, by Application 2020 & 2033
- Table 8: Canada Biological And Chemical Wastewater Treatment Revenue (undefined) Forecast, by Application 2020 & 2033
- Table 9: Mexico Biological And Chemical Wastewater Treatment Revenue (undefined) Forecast, by Application 2020 & 2033
- Table 10: Global Biological And Chemical Wastewater Treatment Revenue undefined Forecast, by Application 2020 & 2033
- Table 11: Global Biological And Chemical Wastewater Treatment Revenue undefined Forecast, by Type 2020 & 2033
- Table 12: Global Biological And Chemical Wastewater Treatment Revenue undefined Forecast, by Country 2020 & 2033
- Table 13: Brazil Biological And Chemical Wastewater Treatment Revenue (undefined) Forecast, by Application 2020 & 2033
- Table 14: Argentina Biological And Chemical Wastewater Treatment Revenue (undefined) Forecast, by Application 2020 & 2033
- Table 15: Rest of South America Biological And Chemical Wastewater Treatment Revenue (undefined) Forecast, by Application 2020 & 2033
- Table 16: Global Biological And Chemical Wastewater Treatment Revenue undefined Forecast, by Application 2020 & 2033
- Table 17: Global Biological And Chemical Wastewater Treatment Revenue undefined Forecast, by Type 2020 & 2033
- Table 18: Global Biological And Chemical Wastewater Treatment Revenue undefined Forecast, by Country 2020 & 2033
- Table 19: United Kingdom Biological And Chemical Wastewater Treatment Revenue (undefined) Forecast, by Application 2020 & 2033
- Table 20: Germany Biological And Chemical Wastewater Treatment Revenue (undefined) Forecast, by Application 2020 & 2033
- Table 21: France Biological And Chemical Wastewater Treatment Revenue (undefined) Forecast, by Application 2020 & 2033
- Table 22: Italy Biological And Chemical Wastewater Treatment Revenue (undefined) Forecast, by Application 2020 & 2033
- Table 23: Spain Biological And Chemical Wastewater Treatment Revenue (undefined) Forecast, by Application 2020 & 2033
- Table 24: Russia Biological And Chemical Wastewater Treatment Revenue (undefined) Forecast, by Application 2020 & 2033
- Table 25: Benelux Biological And Chemical Wastewater Treatment Revenue (undefined) Forecast, by Application 2020 & 2033
- Table 26: Nordics Biological And Chemical Wastewater Treatment Revenue (undefined) Forecast, by Application 2020 & 2033
- Table 27: Rest of Europe Biological And Chemical Wastewater Treatment Revenue (undefined) Forecast, by Application 2020 & 2033
- Table 28: Global Biological And Chemical Wastewater Treatment Revenue undefined Forecast, by Application 2020 & 2033
- Table 29: Global Biological And Chemical Wastewater Treatment Revenue undefined Forecast, by Type 2020 & 2033
- Table 30: Global Biological And Chemical Wastewater Treatment Revenue undefined Forecast, by Country 2020 & 2033
- Table 31: Turkey Biological And Chemical Wastewater Treatment Revenue (undefined) Forecast, by Application 2020 & 2033
- Table 32: Israel Biological And Chemical Wastewater Treatment Revenue (undefined) Forecast, by Application 2020 & 2033
- Table 33: GCC Biological And Chemical Wastewater Treatment Revenue (undefined) Forecast, by Application 2020 & 2033
- Table 34: North Africa Biological And Chemical Wastewater Treatment Revenue (undefined) Forecast, by Application 2020 & 2033
- Table 35: South Africa Biological And Chemical Wastewater Treatment Revenue (undefined) Forecast, by Application 2020 & 2033
- Table 36: Rest of Middle East & Africa Biological And Chemical Wastewater Treatment Revenue (undefined) Forecast, by Application 2020 & 2033
- Table 37: Global Biological And Chemical Wastewater Treatment Revenue undefined Forecast, by Application 2020 & 2033
- Table 38: Global Biological And Chemical Wastewater Treatment Revenue undefined Forecast, by Type 2020 & 2033
- Table 39: Global Biological And Chemical Wastewater Treatment Revenue undefined Forecast, by Country 2020 & 2033
- Table 40: China Biological And Chemical Wastewater Treatment Revenue (undefined) Forecast, by Application 2020 & 2033
- Table 41: India Biological And Chemical Wastewater Treatment Revenue (undefined) Forecast, by Application 2020 & 2033
- Table 42: Japan Biological And Chemical Wastewater Treatment Revenue (undefined) Forecast, by Application 2020 & 2033
- Table 43: South Korea Biological And Chemical Wastewater Treatment Revenue (undefined) Forecast, by Application 2020 & 2033
- Table 44: ASEAN Biological And Chemical Wastewater Treatment Revenue (undefined) Forecast, by Application 2020 & 2033
- Table 45: Oceania Biological And Chemical Wastewater Treatment Revenue (undefined) Forecast, by Application 2020 & 2033
- Table 46: Rest of Asia Pacific Biological And Chemical Wastewater Treatment Revenue (undefined) Forecast, by Application 2020 & 2033
Frequently Asked Questions
1. What is the projected Compound Annual Growth Rate (CAGR) of the Biological And Chemical Wastewater Treatment?
The projected CAGR is approximately 6.1%.
2. Which companies are prominent players in the Biological And Chemical Wastewater Treatment?
Key companies in the market include Veolia, Suez Water Technologies & Solutions, Evoqua Water Technologies LLC, Aquatech International, Xylem Inc., Condorchem Envitech, S.L., Ecolab Inc., Pentair Plc, Samco Technologies, Inc., DAS Environmental Expert GmbH, Microvi Biotech, Inc., Organica Water, Inc., Dryden Aqua Ltd..
3. What are the main segments of the Biological And Chemical Wastewater Treatment?
The market segments include Application, Type.
4. Can you provide details about the market size?
The market size is estimated to be USD XXX N/A as of 2022.
5. What are some drivers contributing to market growth?
N/A
6. What are the notable trends driving market growth?
N/A
7. Are there any restraints impacting market growth?
N/A
8. Can you provide examples of recent developments in the market?
N/A
9. What pricing options are available for accessing the report?
Pricing options include single-user, multi-user, and enterprise licenses priced at USD 2900.00, USD 4350.00, and USD 5800.00 respectively.
10. Is the market size provided in terms of value or volume?
The market size is provided in terms of value, measured in N/A.
11. Are there any specific market keywords associated with the report?
Yes, the market keyword associated with the report is "Biological And Chemical Wastewater Treatment," which aids in identifying and referencing the specific market segment covered.
12. How do I determine which pricing option suits my needs best?
The pricing options vary based on user requirements and access needs. Individual users may opt for single-user licenses, while businesses requiring broader access may choose multi-user or enterprise licenses for cost-effective access to the report.
13. Are there any additional resources or data provided in the Biological And Chemical Wastewater Treatment report?
While the report offers comprehensive insights, it's advisable to review the specific contents or supplementary materials provided to ascertain if additional resources or data are available.
14. How can I stay updated on further developments or reports in the Biological And Chemical Wastewater Treatment?
To stay informed about further developments, trends, and reports in the Biological And Chemical Wastewater Treatment, consider subscribing to industry newsletters, following relevant companies and organizations, or regularly checking reputable industry news sources and publications.
Methodology
Step 1 - Identification of Relevant Samples Size from Population Database


Step 2 - Approaches for Defining Global Market Size (Value, Volume* & Price*)

Note*: In applicable scenarios
Step 3 - Data Sources
Primary Research
- Web Analytics
- Survey Reports
- Research Institute
- Latest Research Reports
- Opinion Leaders
Secondary Research
- Annual Reports
- White Paper
- Latest Press Release
- Industry Association
- Paid Database
- Investor Presentations

Step 4 - Data Triangulation
Involves using different sources of information in order to increase the validity of a study
These sources are likely to be stakeholders in a program - participants, other researchers, program staff, other community members, and so on.
Then we put all data in single framework & apply various statistical tools to find out the dynamic on the market.
During the analysis stage, feedback from the stakeholder groups would be compared to determine areas of agreement as well as areas of divergence