

Key Insights
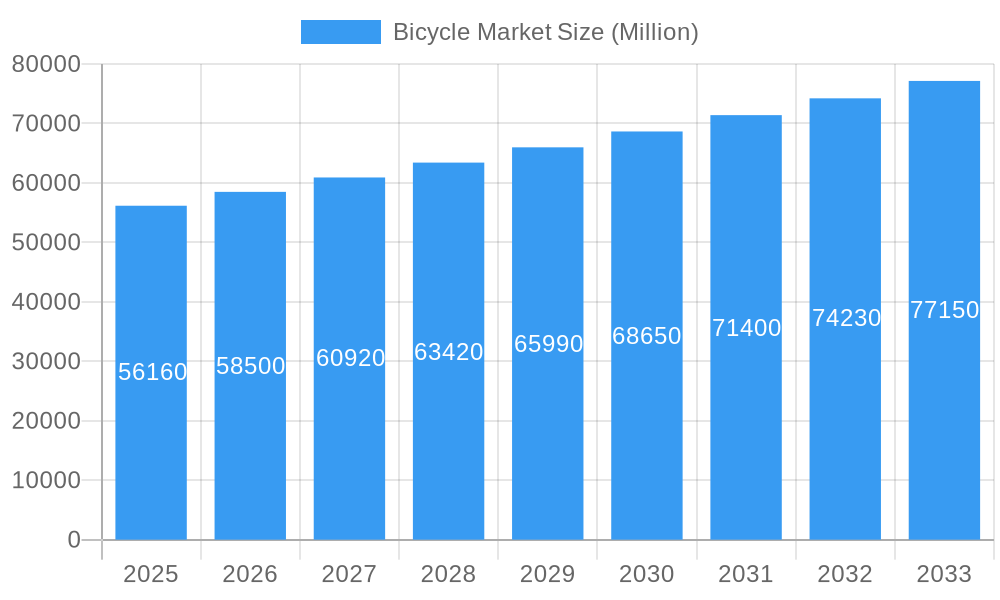
The global bicycle market, valued at $56.16 billion in 2025, is projected to experience robust growth, driven by several key factors. The increasing awareness of health and fitness benefits, coupled with the rising popularity of cycling as a sustainable mode of transportation, is significantly fueling market expansion. Government initiatives promoting cycling infrastructure and eco-friendly commuting options in various regions further contribute to this growth. The market segmentation reveals a diverse landscape, with road bicycles, hybrid bicycles, and e-bicycles holding significant market share. The rise of e-bikes, in particular, is a major growth driver, catering to a wider demographic seeking convenience and assisted propulsion. Online retail channels are witnessing substantial growth, reflecting the evolving consumer preferences for convenient purchasing options. Competitive landscape analysis reveals the presence of both established global players and emerging regional brands, leading to continuous product innovation and market diversification. The geographic distribution shows strong market presence in North America and Europe, with Asia-Pacific emerging as a rapidly growing region due to increasing disposable incomes and rising urbanization.
Bicycle Market Market Size (In Billion)
The projected Compound Annual Growth Rate (CAGR) of 4.20% from 2025 to 2033 suggests a steady and consistent expansion of the market. However, potential restraints such as fluctuating raw material prices and the impact of economic downturns need to be considered. The market’s future hinges on continuous innovation in bicycle technology, the expansion of cycling infrastructure, and the sustained consumer interest in healthy and sustainable lifestyles. Specific segments like e-bikes are expected to outperform the overall market growth, leading to shifts in market share distribution within the coming years. Companies are increasingly focusing on developing smart bicycle technologies, integrating features like GPS tracking and connectivity, thereby enhancing the user experience and further stimulating market growth. Regional differences in market growth will be influenced by factors like government policies, infrastructure development, and economic conditions.
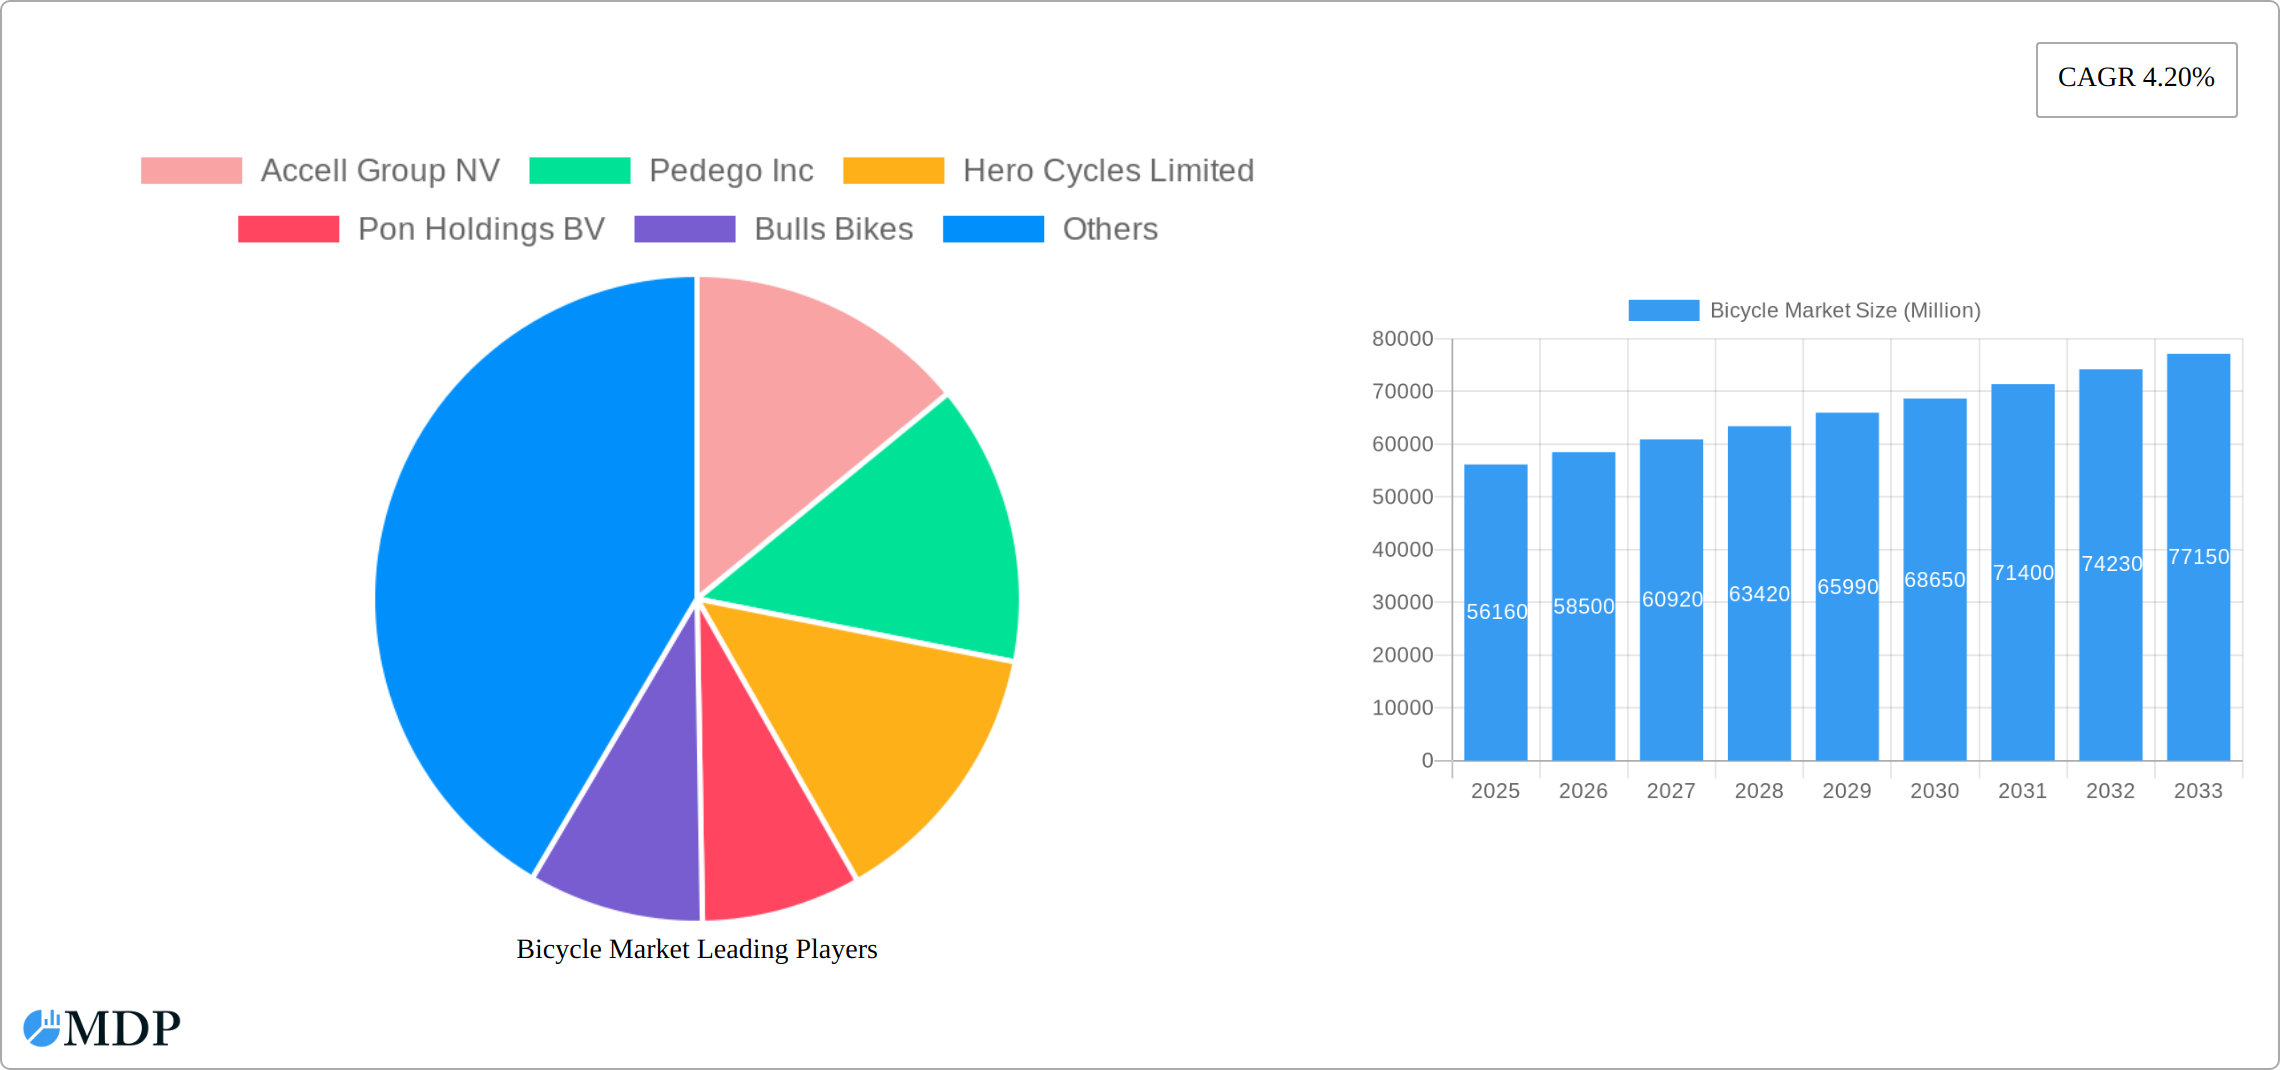
Bicycle Market Company Market Share
Bicycle Market Report: 2019-2033 - A Comprehensive Analysis of Growth, Trends, and Key Players
This in-depth report provides a comprehensive analysis of the global bicycle market, encompassing historical data (2019-2024), current estimates (2025), and future projections (2025-2033). The study delves into market dynamics, industry trends, leading segments, key players, and emerging opportunities, offering actionable insights for stakeholders across the bicycle value chain. The market is expected to reach xx Million by 2033, exhibiting a CAGR of xx% during the forecast period.
Bicycle Market Dynamics & Concentration
The global bicycle market exhibits a moderately concentrated landscape, with key players like Accell Group NV, Giant Manufacturing Co Ltd, and Trek Bicycle Corporation holding significant market share. However, the market is also characterized by the presence of numerous smaller players and niche brands, particularly in the e-bicycle and specialty bicycle segments. Market concentration is influenced by factors such as brand recognition, economies of scale, and technological innovation. The industry's dynamics are shaped by several key factors:
- Innovation Drivers: Continuous advancements in bicycle technology, including e-bike integration, lightweight materials, and improved safety features, are driving market growth and attracting new consumers.
- Regulatory Frameworks: Government initiatives promoting cycling infrastructure and e-bike adoption, coupled with safety regulations, significantly impact market expansion. Variations in these regulations across different regions influence market dynamics.
- Product Substitutes: Competition from other modes of transportation, such as cars, public transport, and scooters, influences bicycle market growth. The increasing popularity of e-bikes however, is mitigating this competition.
- End-User Trends: The rising awareness of health and fitness, coupled with environmental concerns, fuels demand for bicycles, especially in urban areas with increasing traffic congestion and air pollution.
- M&A Activities: The bicycle industry has seen a moderate level of mergers and acquisitions in recent years, with larger players seeking to expand their product portfolios and market reach. We estimate xx M&A deals in the past 5 years, resulting in a slight increase in market consolidation.
Bicycle Market Industry Trends & Analysis
The bicycle market is experiencing robust growth, driven by a confluence of factors. The increasing adoption of e-bikes, fueled by technological advancements and government subsidies, is a primary growth driver. Furthermore, the rising popularity of cycling as a recreational activity and mode of commuting contributes to market expansion. The CAGR for the overall bicycle market during the study period (2019-2024) is estimated at xx%, with a projected market penetration of xx% by 2033. This growth is further accelerated by:
- Technological Disruptions: The integration of smart technologies, including GPS tracking, connectivity features, and performance monitoring systems, enhances the appeal of bicycles, particularly among tech-savvy consumers.
- Consumer Preferences: A shift towards sustainable and eco-friendly transportation options is boosting demand for bicycles, particularly in environmentally conscious urban areas.
- Competitive Dynamics: Intense competition among manufacturers necessitates continuous product innovation and differentiation, driving overall market dynamism.
Leading Markets & Segments in Bicycle Market
The North American and European regions continue to lead the global bicycle market, buoyed by strong economies, extensive cycling infrastructure, and a cultural embrace of active and sustainable lifestyles. The burgeoning e-bike segment is a major growth engine worldwide, attracting consumers with its blend of convenience and eco-friendliness. While traditional brick-and-mortar stores maintain a significant presence, the online retail channel is experiencing rapid expansion, reflecting broader e-commerce trends and increasing consumer comfort with digital purchasing.
- Key Drivers for Dominant Regions:
- North America: Characterized by robust consumer spending, supportive government initiatives for e-bike adoption, and the ongoing development of dedicated cycling pathways and urban planning that prioritizes cycling.
- Europe: Boasts high bicycle ownership rates, substantial government investment in cycling infrastructure and promotion, and a strong societal commitment to sustainable urban mobility and reduced carbon footprints.
- E-bike Segment: Fueled by continuous technological innovation in battery efficiency and motor performance, attractive government subsidies and tax credits, and a growing consumer understanding of the health, environmental, and cost-saving advantages.
- Offline Retail: Benefits from established dealer networks offering immediate product accessibility, expert advice, and the invaluable opportunity for customers to test ride and physically inspect bicycles before purchase.
The sustained leadership of these regions and segments is a testament to the synergy between evolving consumer demands, forward-thinking governmental policies, and well-established market dynamics. A more in-depth exploration of these factors is detailed within the comprehensive market report.
Bicycle Market Product Developments
Recent years have witnessed significant innovations in bicycle design and technology. The integration of electric assist systems in e-bikes has dramatically expanded their appeal, while advancements in materials science have resulted in lighter, stronger, and more durable frames. Manufacturers are also focusing on enhanced safety features and personalized customization options, catering to diverse consumer needs and preferences.
Key Drivers of Bicycle Market Growth
The bicycle market's upward trajectory is propelled by a dynamic interplay of several critical factors:
- Technological Advancements: Innovations in e-bike powertrains, the utilization of lightweight and durable advanced materials, and the integration of smart connectivity features are revolutionizing the cycling experience and expanding market appeal.
- Economic Factors: Increasing disposable incomes in various global markets, coupled with targeted government incentives and tax rebates for bicycle purchases and cycling infrastructure, are significantly boosting market demand.
- Regulatory Support: Proactive government policies focused on promoting sustainable urban transport, investing in safe and accessible cycling infrastructure, and setting emissions reduction targets are creating a favorable environment for bicycle market expansion.
Challenges in the Bicycle Market Market
Several factors pose challenges to bicycle market growth:
- Supply Chain Disruptions: Global supply chain disruptions have led to increased manufacturing costs and product shortages. This has negatively impacted profit margins and market availability.
- Competitive Pressures: Intense competition, particularly in the e-bike segment, necessitates continuous innovation and investment.
- Regulatory Hurdles: Varying regulatory frameworks across different regions create complexities for manufacturers.
Emerging Opportunities in Bicycle Market
The bicycle market is poised for sustained long-term growth, driven by a landscape rich with emerging opportunities:
- Technological Breakthroughs: Ongoing advancements in battery technology, promising lighter, longer-lasting, and faster-charging power sources, alongside the integration of sophisticated smart features and seamless connectivity, will continue to redefine the capabilities and appeal of bicycles.
- Strategic Partnerships: Collaborative ventures between traditional bicycle manufacturers and innovative technology firms are fostering the development of cutting-edge solutions, enhancing product offerings, and extending market reach into new demographics and applications.
- Market Expansion: Significant untapped potential exists in developing economies, where a rising middle class, increasing urbanization, and a growing consciousness regarding health and environmental sustainability are creating a fertile ground for increased bicycle adoption.
Leading Players in the Bicycle Market Sector
- Accell Group NV
- Pedego Inc
- Hero Cycles Limited
- Pon Holdings BV
- Bulls Bikes
- Giant Manufacturing Co Ltd
- Riese Und Muller Gmbh
- Benno Bikes LLC
- Ribble Cycles
- Trek Bicycle Corporation
Key Milestones in Bicycle Market Industry
- 2020: Significant surge in e-bike sales due to increased demand during the pandemic.
- 2021: Several key players launch new e-bike models with improved battery technology and connectivity features.
- 2022: Government initiatives promoting cycling infrastructure gain momentum in several countries.
- 2023: Increased focus on sustainable manufacturing practices by leading bicycle manufacturers.
Strategic Outlook for Bicycle Market Market
The future outlook for the bicycle market is exceptionally positive, driven by a confluence of accelerating technological innovation, the global shift towards sustainable transportation solutions, and a heightened consumer awareness of the health and environmental benefits of cycling. The ongoing integration of advanced smart technologies and the widespread adoption of e-bikes are projected to be significant catalysts for market growth. Furthermore, strategic alliances and substantial investments in research and development are anticipated to foster continued market expansion and drive groundbreaking innovation in the years to come.
Bicycle Market Segmentation
-
1. Type
- 1.1. Road Bicycle
- 1.2. Hybrid Bicycle
- 1.3. All Terrain Bicycle
- 1.4. E-bicycle
- 1.5. Other Types
-
2. Distribution Channel
- 2.1. Offline Retail Stores
- 2.2. Online Retail Stores
Bicycle Market Segmentation By Geography
-
1. North America
- 1.1. United States
- 1.2. Canada
- 1.3. Mexico
- 1.4. Rest of North America
-
2. Europe
- 2.1. United Kingdom
- 2.2. Germany
- 2.3. Spain
- 2.4. France
- 2.5. Italy
- 2.6. Russia
- 2.7. Netherlands
- 2.8. Rest of Europe
-
3. Asia Pacific
- 3.1. China
- 3.2. Japan
- 3.3. India
- 3.4. Australia
- 3.5. Rest of Asia Pacific
-
4. South America
- 4.1. Brazil
- 4.2. Argentina
- 4.3. Chile
- 4.4. Rest of South America
-
5. Middle East and Africa
- 5.1. United Arab Emirates
- 5.2. South Africa
- 5.3. Rest of Middle East and Africa
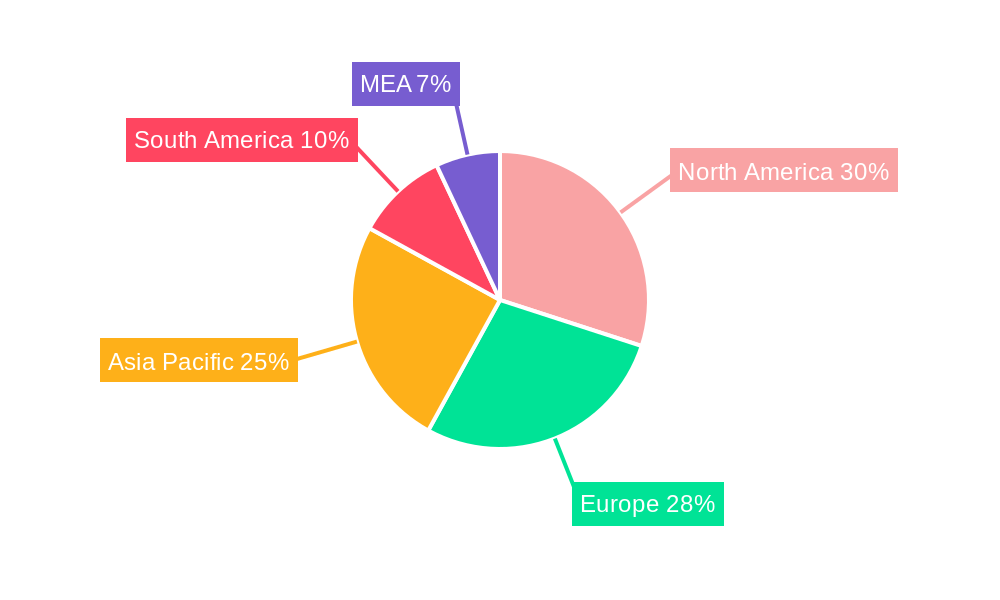
Bicycle Market Regional Market Share
Geographic Coverage of Bicycle Market
Bicycle Market REPORT HIGHLIGHTS
| Aspects | Details |
|---|---|
| Study Period | 2020-2034 |
| Base Year | 2025 |
| Estimated Year | 2026 |
| Forecast Period | 2026-2034 |
| Historical Period | 2020-2025 |
| Growth Rate | CAGR of 4.20% from 2020-2034 |
| Segmentation |
|
Table of Contents
- 1. Introduction
- 1.1. Research Scope
- 1.2. Market Segmentation
- 1.3. Research Objective
- 1.4. Definitions and Assumptions
- 2. Executive Summary
- 2.1. Market Snapshot
- 3. Market Dynamics
- 3.1. Market Drivers
- 3.2. Market Restrains
- 3.3. Market Trends
- 3.4. Market Opportunities
- 4. Market Factor Analysis
- 4.1. Porters Five Forces
- 4.1.1. Bargaining Power of Suppliers
- 4.1.2. Bargaining Power of Buyers
- 4.1.3. Threat of New Entrants
- 4.1.4. Threat of Substitutes
- 4.1.5. Competitive Rivalry
- 4.2. PESTEL analysis
- 4.3. BCG Analysis
- 4.3.1. Stars (High Growth, High Market Share)
- 4.3.2. Cash Cows (Low Growth, High Market Share)
- 4.3.3. Question Mark (High Growth, Low Market Share)
- 4.3.4. Dogs (Low Growth, Low Market Share)
- 4.4. Ansoff Matrix Analysis
- 4.5. Supply Chain Analysis
- 4.6. Regulatory Landscape
- 4.7. Current Market Potential and Opportunity Assessment (TAM–SAM–SOM Framework)
- 4.8. MDP Analyst Note
- 4.1. Porters Five Forces
- 5. Market Analysis, Insights and Forecast 2021-2033
- 5.1. Market Analysis, Insights and Forecast - by Type
- 5.1.1. Road Bicycle
- 5.1.2. Hybrid Bicycle
- 5.1.3. All Terrain Bicycle
- 5.1.4. E-bicycle
- 5.1.5. Other Types
- 5.2. Market Analysis, Insights and Forecast - by Distribution Channel
- 5.2.1. Offline Retail Stores
- 5.2.2. Online Retail Stores
- 5.3. Market Analysis, Insights and Forecast - by Region
- 5.3.1. North America
- 5.3.2. Europe
- 5.3.3. Asia Pacific
- 5.3.4. South America
- 5.3.5. Middle East and Africa
- 5.1. Market Analysis, Insights and Forecast - by Type
- 6. Global Bicycle Market Analysis, Insights and Forecast, 2021-2033
- 6.1. Market Analysis, Insights and Forecast - by Type
- 6.1.1. Road Bicycle
- 6.1.2. Hybrid Bicycle
- 6.1.3. All Terrain Bicycle
- 6.1.4. E-bicycle
- 6.1.5. Other Types
- 6.2. Market Analysis, Insights and Forecast - by Distribution Channel
- 6.2.1. Offline Retail Stores
- 6.2.2. Online Retail Stores
- 6.1. Market Analysis, Insights and Forecast - by Type
- 7. North America Bicycle Market Analysis, Insights and Forecast, 2020-2032
- 7.1. Market Analysis, Insights and Forecast - by Type
- 7.1.1. Road Bicycle
- 7.1.2. Hybrid Bicycle
- 7.1.3. All Terrain Bicycle
- 7.1.4. E-bicycle
- 7.1.5. Other Types
- 7.2. Market Analysis, Insights and Forecast - by Distribution Channel
- 7.2.1. Offline Retail Stores
- 7.2.2. Online Retail Stores
- 7.1. Market Analysis, Insights and Forecast - by Type
- 8. Europe Bicycle Market Analysis, Insights and Forecast, 2020-2032
- 8.1. Market Analysis, Insights and Forecast - by Type
- 8.1.1. Road Bicycle
- 8.1.2. Hybrid Bicycle
- 8.1.3. All Terrain Bicycle
- 8.1.4. E-bicycle
- 8.1.5. Other Types
- 8.2. Market Analysis, Insights and Forecast - by Distribution Channel
- 8.2.1. Offline Retail Stores
- 8.2.2. Online Retail Stores
- 8.1. Market Analysis, Insights and Forecast - by Type
- 9. Asia Pacific Bicycle Market Analysis, Insights and Forecast, 2020-2032
- 9.1. Market Analysis, Insights and Forecast - by Type
- 9.1.1. Road Bicycle
- 9.1.2. Hybrid Bicycle
- 9.1.3. All Terrain Bicycle
- 9.1.4. E-bicycle
- 9.1.5. Other Types
- 9.2. Market Analysis, Insights and Forecast - by Distribution Channel
- 9.2.1. Offline Retail Stores
- 9.2.2. Online Retail Stores
- 9.1. Market Analysis, Insights and Forecast - by Type
- 10. South America Bicycle Market Analysis, Insights and Forecast, 2020-2032
- 10.1. Market Analysis, Insights and Forecast - by Type
- 10.1.1. Road Bicycle
- 10.1.2. Hybrid Bicycle
- 10.1.3. All Terrain Bicycle
- 10.1.4. E-bicycle
- 10.1.5. Other Types
- 10.2. Market Analysis, Insights and Forecast - by Distribution Channel
- 10.2.1. Offline Retail Stores
- 10.2.2. Online Retail Stores
- 10.1. Market Analysis, Insights and Forecast - by Type
- 11. Middle East and Africa Bicycle Market Analysis, Insights and Forecast, 2020-2032
- 11.1. Market Analysis, Insights and Forecast - by Type
- 11.1.1. Road Bicycle
- 11.1.2. Hybrid Bicycle
- 11.1.3. All Terrain Bicycle
- 11.1.4. E-bicycle
- 11.1.5. Other Types
- 11.2. Market Analysis, Insights and Forecast - by Distribution Channel
- 11.2.1. Offline Retail Stores
- 11.2.2. Online Retail Stores
- 11.1. Market Analysis, Insights and Forecast - by Type
- 12. Competitive Analysis
- 12.1. Company Profiles
- 12.1.1 Accell Group NV
- 12.1.1.1. Company Overview
- 12.1.1.2. Products
- 12.1.1.3. Company Financials
- 12.1.1.4. SWOT Analysis
- 12.1.2 Pedego Inc
- 12.1.2.1. Company Overview
- 12.1.2.2. Products
- 12.1.2.3. Company Financials
- 12.1.2.4. SWOT Analysis
- 12.1.3 Hero Cycles Limited
- 12.1.3.1. Company Overview
- 12.1.3.2. Products
- 12.1.3.3. Company Financials
- 12.1.3.4. SWOT Analysis
- 12.1.4 Pon Holdings BV
- 12.1.4.1. Company Overview
- 12.1.4.2. Products
- 12.1.4.3. Company Financials
- 12.1.4.4. SWOT Analysis
- 12.1.5 Bulls Bikes
- 12.1.5.1. Company Overview
- 12.1.5.2. Products
- 12.1.5.3. Company Financials
- 12.1.5.4. SWOT Analysis
- 12.1.6 Giant Manufacturing Co Ltd
- 12.1.6.1. Company Overview
- 12.1.6.2. Products
- 12.1.6.3. Company Financials
- 12.1.6.4. SWOT Analysis
- 12.1.7 Riese Und Muller Gmbh*List Not Exhaustive
- 12.1.7.1. Company Overview
- 12.1.7.2. Products
- 12.1.7.3. Company Financials
- 12.1.7.4. SWOT Analysis
- 12.1.8 Benno Bikes LLC
- 12.1.8.1. Company Overview
- 12.1.8.2. Products
- 12.1.8.3. Company Financials
- 12.1.8.4. SWOT Analysis
- 12.1.9 Ribble Cycles
- 12.1.9.1. Company Overview
- 12.1.9.2. Products
- 12.1.9.3. Company Financials
- 12.1.9.4. SWOT Analysis
- 12.1.10 Trek Bicycle Corporation
- 12.1.10.1. Company Overview
- 12.1.10.2. Products
- 12.1.10.3. Company Financials
- 12.1.10.4. SWOT Analysis
- 12.1.1 Accell Group NV
- 12.2. Market Entropy
- 12.2.1 Company's Key Areas Served
- 12.2.2 Recent Developments
- 12.3. Company Market Share Analysis 2025
- 12.3.1 Top 5 Companies Market Share Analysis
- 12.3.2 Top 3 Companies Market Share Analysis
- 12.4. List of Potential Customers
- 13. Research Methodology
List of Figures
- Figure 1: Global Bicycle Market Revenue Breakdown (Million, %) by Region 2025 & 2033
- Figure 2: Global Bicycle Market Volume Breakdown (K Units, %) by Region 2025 & 2033
- Figure 3: North America Bicycle Market Revenue (Million), by Type 2025 & 2033
- Figure 4: North America Bicycle Market Volume (K Units), by Type 2025 & 2033
- Figure 5: North America Bicycle Market Revenue Share (%), by Type 2025 & 2033
- Figure 6: North America Bicycle Market Volume Share (%), by Type 2025 & 2033
- Figure 7: North America Bicycle Market Revenue (Million), by Distribution Channel 2025 & 2033
- Figure 8: North America Bicycle Market Volume (K Units), by Distribution Channel 2025 & 2033
- Figure 9: North America Bicycle Market Revenue Share (%), by Distribution Channel 2025 & 2033
- Figure 10: North America Bicycle Market Volume Share (%), by Distribution Channel 2025 & 2033
- Figure 11: North America Bicycle Market Revenue (Million), by Country 2025 & 2033
- Figure 12: North America Bicycle Market Volume (K Units), by Country 2025 & 2033
- Figure 13: North America Bicycle Market Revenue Share (%), by Country 2025 & 2033
- Figure 14: North America Bicycle Market Volume Share (%), by Country 2025 & 2033
- Figure 15: Europe Bicycle Market Revenue (Million), by Type 2025 & 2033
- Figure 16: Europe Bicycle Market Volume (K Units), by Type 2025 & 2033
- Figure 17: Europe Bicycle Market Revenue Share (%), by Type 2025 & 2033
- Figure 18: Europe Bicycle Market Volume Share (%), by Type 2025 & 2033
- Figure 19: Europe Bicycle Market Revenue (Million), by Distribution Channel 2025 & 2033
- Figure 20: Europe Bicycle Market Volume (K Units), by Distribution Channel 2025 & 2033
- Figure 21: Europe Bicycle Market Revenue Share (%), by Distribution Channel 2025 & 2033
- Figure 22: Europe Bicycle Market Volume Share (%), by Distribution Channel 2025 & 2033
- Figure 23: Europe Bicycle Market Revenue (Million), by Country 2025 & 2033
- Figure 24: Europe Bicycle Market Volume (K Units), by Country 2025 & 2033
- Figure 25: Europe Bicycle Market Revenue Share (%), by Country 2025 & 2033
- Figure 26: Europe Bicycle Market Volume Share (%), by Country 2025 & 2033
- Figure 27: Asia Pacific Bicycle Market Revenue (Million), by Type 2025 & 2033
- Figure 28: Asia Pacific Bicycle Market Volume (K Units), by Type 2025 & 2033
- Figure 29: Asia Pacific Bicycle Market Revenue Share (%), by Type 2025 & 2033
- Figure 30: Asia Pacific Bicycle Market Volume Share (%), by Type 2025 & 2033
- Figure 31: Asia Pacific Bicycle Market Revenue (Million), by Distribution Channel 2025 & 2033
- Figure 32: Asia Pacific Bicycle Market Volume (K Units), by Distribution Channel 2025 & 2033
- Figure 33: Asia Pacific Bicycle Market Revenue Share (%), by Distribution Channel 2025 & 2033
- Figure 34: Asia Pacific Bicycle Market Volume Share (%), by Distribution Channel 2025 & 2033
- Figure 35: Asia Pacific Bicycle Market Revenue (Million), by Country 2025 & 2033
- Figure 36: Asia Pacific Bicycle Market Volume (K Units), by Country 2025 & 2033
- Figure 37: Asia Pacific Bicycle Market Revenue Share (%), by Country 2025 & 2033
- Figure 38: Asia Pacific Bicycle Market Volume Share (%), by Country 2025 & 2033
- Figure 39: South America Bicycle Market Revenue (Million), by Type 2025 & 2033
- Figure 40: South America Bicycle Market Volume (K Units), by Type 2025 & 2033
- Figure 41: South America Bicycle Market Revenue Share (%), by Type 2025 & 2033
- Figure 42: South America Bicycle Market Volume Share (%), by Type 2025 & 2033
- Figure 43: South America Bicycle Market Revenue (Million), by Distribution Channel 2025 & 2033
- Figure 44: South America Bicycle Market Volume (K Units), by Distribution Channel 2025 & 2033
- Figure 45: South America Bicycle Market Revenue Share (%), by Distribution Channel 2025 & 2033
- Figure 46: South America Bicycle Market Volume Share (%), by Distribution Channel 2025 & 2033
- Figure 47: South America Bicycle Market Revenue (Million), by Country 2025 & 2033
- Figure 48: South America Bicycle Market Volume (K Units), by Country 2025 & 2033
- Figure 49: South America Bicycle Market Revenue Share (%), by Country 2025 & 2033
- Figure 50: South America Bicycle Market Volume Share (%), by Country 2025 & 2033
- Figure 51: Middle East and Africa Bicycle Market Revenue (Million), by Type 2025 & 2033
- Figure 52: Middle East and Africa Bicycle Market Volume (K Units), by Type 2025 & 2033
- Figure 53: Middle East and Africa Bicycle Market Revenue Share (%), by Type 2025 & 2033
- Figure 54: Middle East and Africa Bicycle Market Volume Share (%), by Type 2025 & 2033
- Figure 55: Middle East and Africa Bicycle Market Revenue (Million), by Distribution Channel 2025 & 2033
- Figure 56: Middle East and Africa Bicycle Market Volume (K Units), by Distribution Channel 2025 & 2033
- Figure 57: Middle East and Africa Bicycle Market Revenue Share (%), by Distribution Channel 2025 & 2033
- Figure 58: Middle East and Africa Bicycle Market Volume Share (%), by Distribution Channel 2025 & 2033
- Figure 59: Middle East and Africa Bicycle Market Revenue (Million), by Country 2025 & 2033
- Figure 60: Middle East and Africa Bicycle Market Volume (K Units), by Country 2025 & 2033
- Figure 61: Middle East and Africa Bicycle Market Revenue Share (%), by Country 2025 & 2033
- Figure 62: Middle East and Africa Bicycle Market Volume Share (%), by Country 2025 & 2033
List of Tables
- Table 1: Global Bicycle Market Revenue Million Forecast, by Type 2020 & 2033
- Table 2: Global Bicycle Market Volume K Units Forecast, by Type 2020 & 2033
- Table 3: Global Bicycle Market Revenue Million Forecast, by Distribution Channel 2020 & 2033
- Table 4: Global Bicycle Market Volume K Units Forecast, by Distribution Channel 2020 & 2033
- Table 5: Global Bicycle Market Revenue Million Forecast, by Region 2020 & 2033
- Table 6: Global Bicycle Market Volume K Units Forecast, by Region 2020 & 2033
- Table 7: Global Bicycle Market Revenue Million Forecast, by Type 2020 & 2033
- Table 8: Global Bicycle Market Volume K Units Forecast, by Type 2020 & 2033
- Table 9: Global Bicycle Market Revenue Million Forecast, by Distribution Channel 2020 & 2033
- Table 10: Global Bicycle Market Volume K Units Forecast, by Distribution Channel 2020 & 2033
- Table 11: Global Bicycle Market Revenue Million Forecast, by Country 2020 & 2033
- Table 12: Global Bicycle Market Volume K Units Forecast, by Country 2020 & 2033
- Table 13: United States Bicycle Market Revenue (Million) Forecast, by Application 2020 & 2033
- Table 14: United States Bicycle Market Volume (K Units) Forecast, by Application 2020 & 2033
- Table 15: Canada Bicycle Market Revenue (Million) Forecast, by Application 2020 & 2033
- Table 16: Canada Bicycle Market Volume (K Units) Forecast, by Application 2020 & 2033
- Table 17: Mexico Bicycle Market Revenue (Million) Forecast, by Application 2020 & 2033
- Table 18: Mexico Bicycle Market Volume (K Units) Forecast, by Application 2020 & 2033
- Table 19: Rest of North America Bicycle Market Revenue (Million) Forecast, by Application 2020 & 2033
- Table 20: Rest of North America Bicycle Market Volume (K Units) Forecast, by Application 2020 & 2033
- Table 21: Global Bicycle Market Revenue Million Forecast, by Type 2020 & 2033
- Table 22: Global Bicycle Market Volume K Units Forecast, by Type 2020 & 2033
- Table 23: Global Bicycle Market Revenue Million Forecast, by Distribution Channel 2020 & 2033
- Table 24: Global Bicycle Market Volume K Units Forecast, by Distribution Channel 2020 & 2033
- Table 25: Global Bicycle Market Revenue Million Forecast, by Country 2020 & 2033
- Table 26: Global Bicycle Market Volume K Units Forecast, by Country 2020 & 2033
- Table 27: United Kingdom Bicycle Market Revenue (Million) Forecast, by Application 2020 & 2033
- Table 28: United Kingdom Bicycle Market Volume (K Units) Forecast, by Application 2020 & 2033
- Table 29: Germany Bicycle Market Revenue (Million) Forecast, by Application 2020 & 2033
- Table 30: Germany Bicycle Market Volume (K Units) Forecast, by Application 2020 & 2033
- Table 31: Spain Bicycle Market Revenue (Million) Forecast, by Application 2020 & 2033
- Table 32: Spain Bicycle Market Volume (K Units) Forecast, by Application 2020 & 2033
- Table 33: France Bicycle Market Revenue (Million) Forecast, by Application 2020 & 2033
- Table 34: France Bicycle Market Volume (K Units) Forecast, by Application 2020 & 2033
- Table 35: Italy Bicycle Market Revenue (Million) Forecast, by Application 2020 & 2033
- Table 36: Italy Bicycle Market Volume (K Units) Forecast, by Application 2020 & 2033
- Table 37: Russia Bicycle Market Revenue (Million) Forecast, by Application 2020 & 2033
- Table 38: Russia Bicycle Market Volume (K Units) Forecast, by Application 2020 & 2033
- Table 39: Netherlands Bicycle Market Revenue (Million) Forecast, by Application 2020 & 2033
- Table 40: Netherlands Bicycle Market Volume (K Units) Forecast, by Application 2020 & 2033
- Table 41: Rest of Europe Bicycle Market Revenue (Million) Forecast, by Application 2020 & 2033
- Table 42: Rest of Europe Bicycle Market Volume (K Units) Forecast, by Application 2020 & 2033
- Table 43: Global Bicycle Market Revenue Million Forecast, by Type 2020 & 2033
- Table 44: Global Bicycle Market Volume K Units Forecast, by Type 2020 & 2033
- Table 45: Global Bicycle Market Revenue Million Forecast, by Distribution Channel 2020 & 2033
- Table 46: Global Bicycle Market Volume K Units Forecast, by Distribution Channel 2020 & 2033
- Table 47: Global Bicycle Market Revenue Million Forecast, by Country 2020 & 2033
- Table 48: Global Bicycle Market Volume K Units Forecast, by Country 2020 & 2033
- Table 49: China Bicycle Market Revenue (Million) Forecast, by Application 2020 & 2033
- Table 50: China Bicycle Market Volume (K Units) Forecast, by Application 2020 & 2033
- Table 51: Japan Bicycle Market Revenue (Million) Forecast, by Application 2020 & 2033
- Table 52: Japan Bicycle Market Volume (K Units) Forecast, by Application 2020 & 2033
- Table 53: India Bicycle Market Revenue (Million) Forecast, by Application 2020 & 2033
- Table 54: India Bicycle Market Volume (K Units) Forecast, by Application 2020 & 2033
- Table 55: Australia Bicycle Market Revenue (Million) Forecast, by Application 2020 & 2033
- Table 56: Australia Bicycle Market Volume (K Units) Forecast, by Application 2020 & 2033
- Table 57: Rest of Asia Pacific Bicycle Market Revenue (Million) Forecast, by Application 2020 & 2033
- Table 58: Rest of Asia Pacific Bicycle Market Volume (K Units) Forecast, by Application 2020 & 2033
- Table 59: Global Bicycle Market Revenue Million Forecast, by Type 2020 & 2033
- Table 60: Global Bicycle Market Volume K Units Forecast, by Type 2020 & 2033
- Table 61: Global Bicycle Market Revenue Million Forecast, by Distribution Channel 2020 & 2033
- Table 62: Global Bicycle Market Volume K Units Forecast, by Distribution Channel 2020 & 2033
- Table 63: Global Bicycle Market Revenue Million Forecast, by Country 2020 & 2033
- Table 64: Global Bicycle Market Volume K Units Forecast, by Country 2020 & 2033
- Table 65: Brazil Bicycle Market Revenue (Million) Forecast, by Application 2020 & 2033
- Table 66: Brazil Bicycle Market Volume (K Units) Forecast, by Application 2020 & 2033
- Table 67: Argentina Bicycle Market Revenue (Million) Forecast, by Application 2020 & 2033
- Table 68: Argentina Bicycle Market Volume (K Units) Forecast, by Application 2020 & 2033
- Table 69: Chile Bicycle Market Revenue (Million) Forecast, by Application 2020 & 2033
- Table 70: Chile Bicycle Market Volume (K Units) Forecast, by Application 2020 & 2033
- Table 71: Rest of South America Bicycle Market Revenue (Million) Forecast, by Application 2020 & 2033
- Table 72: Rest of South America Bicycle Market Volume (K Units) Forecast, by Application 2020 & 2033
- Table 73: Global Bicycle Market Revenue Million Forecast, by Type 2020 & 2033
- Table 74: Global Bicycle Market Volume K Units Forecast, by Type 2020 & 2033
- Table 75: Global Bicycle Market Revenue Million Forecast, by Distribution Channel 2020 & 2033
- Table 76: Global Bicycle Market Volume K Units Forecast, by Distribution Channel 2020 & 2033
- Table 77: Global Bicycle Market Revenue Million Forecast, by Country 2020 & 2033
- Table 78: Global Bicycle Market Volume K Units Forecast, by Country 2020 & 2033
- Table 79: United Arab Emirates Bicycle Market Revenue (Million) Forecast, by Application 2020 & 2033
- Table 80: United Arab Emirates Bicycle Market Volume (K Units) Forecast, by Application 2020 & 2033
- Table 81: South Africa Bicycle Market Revenue (Million) Forecast, by Application 2020 & 2033
- Table 82: South Africa Bicycle Market Volume (K Units) Forecast, by Application 2020 & 2033
- Table 83: Rest of Middle East and Africa Bicycle Market Revenue (Million) Forecast, by Application 2020 & 2033
- Table 84: Rest of Middle East and Africa Bicycle Market Volume (K Units) Forecast, by Application 2020 & 2033
Frequently Asked Questions
1. What is the projected Compound Annual Growth Rate (CAGR) of the Bicycle Market?
The projected CAGR is approximately 4.20%.
2. Which companies are prominent players in the Bicycle Market?
Key companies in the market include Accell Group NV, Pedego Inc, Hero Cycles Limited, Pon Holdings BV, Bulls Bikes, Giant Manufacturing Co Ltd, Riese Und Muller Gmbh*List Not Exhaustive, Benno Bikes LLC, Ribble Cycles, Trek Bicycle Corporation.
3. What are the main segments of the Bicycle Market?
The market segments include Type, Distribution Channel.
4. Can you provide details about the market size?
The market size is estimated to be USD 56.16 Million as of 2022.
5. What are some drivers contributing to market growth?
Increasing Number of Cycling Events; Growing Health Conscious and Environmentally Friendly Population.
6. What are the notable trends driving market growth?
Increasing Number of Cycling Events.
7. Are there any restraints impacting market growth?
Availability of Alternative Transport Solutions.
8. Can you provide examples of recent developments in the market?
N/A
9. What pricing options are available for accessing the report?
Pricing options include single-user, multi-user, and enterprise licenses priced at USD 4750, USD 5250, and USD 8750 respectively.
10. Is the market size provided in terms of value or volume?
The market size is provided in terms of value, measured in Million and volume, measured in K Units.
11. Are there any specific market keywords associated with the report?
Yes, the market keyword associated with the report is "Bicycle Market," which aids in identifying and referencing the specific market segment covered.
12. How do I determine which pricing option suits my needs best?
The pricing options vary based on user requirements and access needs. Individual users may opt for single-user licenses, while businesses requiring broader access may choose multi-user or enterprise licenses for cost-effective access to the report.
13. Are there any additional resources or data provided in the Bicycle Market report?
While the report offers comprehensive insights, it's advisable to review the specific contents or supplementary materials provided to ascertain if additional resources or data are available.
14. How can I stay updated on further developments or reports in the Bicycle Market?
To stay informed about further developments, trends, and reports in the Bicycle Market, consider subscribing to industry newsletters, following relevant companies and organizations, or regularly checking reputable industry news sources and publications.
Methodology
Step 1 - Identification of Relevant Samples Size from Population Database


Step 2 - Approaches for Defining Global Market Size (Value, Volume* & Price*)

Note*: In applicable scenarios
Step 3 - Data Sources
Primary Research
- Web Analytics
- Survey Reports
- Research Institute
- Latest Research Reports
- Opinion Leaders
Secondary Research
- Annual Reports
- White Paper
- Latest Press Release
- Industry Association
- Paid Database
- Investor Presentations

Step 4 - Data Triangulation
Involves using different sources of information in order to increase the validity of a study
These sources are likely to be stakeholders in a program - participants, other researchers, program staff, other community members, and so on.
Then we put all data in single framework & apply various statistical tools to find out the dynamic on the market.
During the analysis stage, feedback from the stakeholder groups would be compared to determine areas of agreement as well as areas of divergence