

Key Insights
The global automated breast ultrasound systems market is experiencing robust growth, driven by the increasing prevalence of breast cancer, advancements in imaging technology offering improved diagnostic accuracy and reduced discomfort for patients, and a rising preference for non-invasive diagnostic techniques. The market is segmented by application (hospitals, ambulatory surgery centers, others) and type (automated breast ultrasound system, automated breast volume scanner). Hospitals currently dominate the application segment due to their established infrastructure and higher diagnostic volumes. However, ambulatory surgery centers are witnessing significant growth owing to their increasing adoption of advanced technologies and the rising demand for convenient and cost-effective healthcare services. The automated breast ultrasound system segment holds a larger market share compared to automated breast volume scanners, primarily due to its wider availability and established clinical adoption. Technological advancements such as AI-powered image analysis and 3D ultrasound are further enhancing the capabilities of these systems, contributing to improved diagnostic accuracy and workflow efficiency. This leads to faster diagnosis and treatment initiation, improving patient outcomes. While the market faces certain restraints such as high initial investment costs and the need for skilled professionals to operate the systems, the overall positive trajectory is fueled by government initiatives promoting early breast cancer detection and increasing healthcare expenditure globally. We project consistent growth throughout the forecast period, driven by ongoing technological innovations and the rising demand for precise and efficient breast cancer screening.
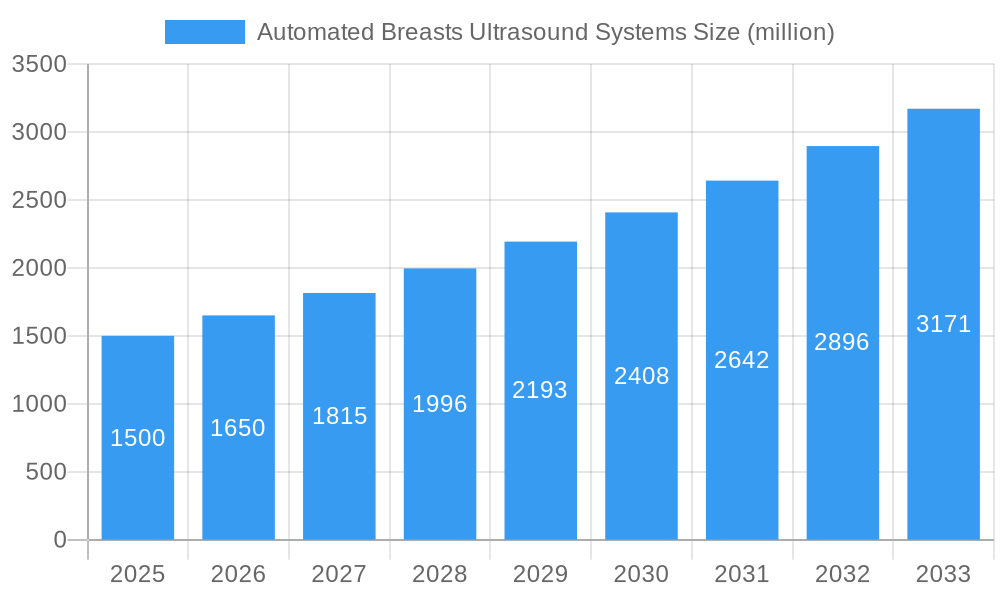
Automated Breasts Ultrasound Systems Market Size (In Billion)
The competitive landscape is characterized by the presence of established medical device manufacturers such as Canon Medical Systems, GE Healthcare, and Siemens AG, alongside specialized companies like Metritrack Inc. and QView Medical Inc. These companies are engaged in strategic partnerships, research and development, and mergers and acquisitions to strengthen their market positions and expand their product portfolios. Geographical growth is expected to be particularly strong in rapidly developing economies in Asia-Pacific and regions with increasing healthcare infrastructure investments. North America and Europe, however, will remain significant markets due to advanced healthcare systems and high breast cancer prevalence. The market's future success will depend heavily on continued technological improvements, regulatory approvals, and increasing awareness about early detection programs among the general population.
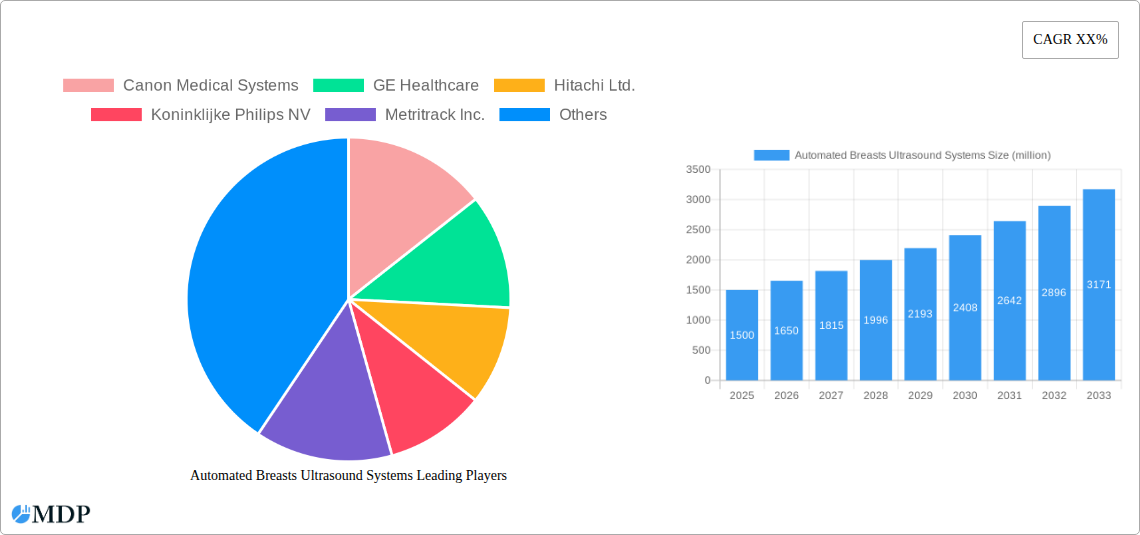
Automated Breasts Ultrasound Systems Company Market Share
Automated Breast Ultrasound Systems Market Report: 2019-2033
This comprehensive report provides an in-depth analysis of the global automated breast ultrasound systems market, projecting a market value exceeding $XX million by 2033. It offers actionable insights for stakeholders, encompassing market dynamics, industry trends, leading players, and future growth opportunities. The report covers the period from 2019 to 2033, with 2025 as the base and estimated year.
Automated Breasts Ultrasound Systems Market Dynamics & Concentration
The automated breast ultrasound systems market is experiencing significant growth driven by technological advancements, increasing prevalence of breast cancer, and rising demand for accurate and efficient diagnostic tools. Market concentration is moderate, with several key players holding substantial market share. Canon Medical Systems, GE Healthcare, and Siemens AG are among the dominant players, collectively accounting for an estimated xx% of the market share in 2025. However, the market also features several smaller, innovative companies such as Metritrack Inc. and SuperSonic Imagine contributing to the overall market dynamism.
Innovation Drivers:
- Development of AI-powered image analysis tools for improved diagnostic accuracy.
- Miniaturization and portability of systems for enhanced accessibility.
- Integration with other imaging modalities for comprehensive diagnostics.
Regulatory Frameworks: Stringent regulatory approvals and compliance requirements influence market entry and product development. The increasing emphasis on quality assurance and safety standards further shapes market dynamics.
Product Substitutes: While mammograms remain a primary screening method, automated breast ultrasound systems offer advantages in terms of comfort, radiation avoidance, and potentially higher sensitivity for certain breast densities.
End-User Trends: Hospitals and ambulatory surgery centers represent the largest market segments, driven by the increasing need for efficient breast cancer screening and diagnosis.
M&A Activities: The market has witnessed xx M&A deals between 2019 and 2024, primarily focused on technology acquisition and market expansion. These activities further contribute to market consolidation and innovation.
Automated Breasts Ultrasound Systems Industry Trends & Analysis
The global automated breast ultrasound systems market is projected to exhibit a Compound Annual Growth Rate (CAGR) of xx% during the forecast period (2025-2033). This robust growth is fueled by several key factors:
- Technological Disruptions: The integration of Artificial Intelligence (AI) and machine learning algorithms is significantly improving diagnostic accuracy and efficiency, leading to higher market penetration. Automated systems reduce dependence on highly trained specialists, enabling wider access to advanced breast imaging.
- Market Growth Drivers: The rising incidence of breast cancer globally is the primary driver for market growth. Increased awareness about early detection and the demand for advanced diagnostic tools are contributing factors. Government initiatives promoting breast cancer screening programs also stimulate market expansion.
- Consumer Preferences: Patients increasingly prefer less invasive and more comfortable screening methods. Automated breast ultrasound offers a relatively painless alternative to traditional methods, driving adoption among consumers.
- Competitive Dynamics: The market is characterized by both intense competition among established players and the emergence of innovative startups. This competitive landscape drives innovation and facilitates market expansion. However, pricing strategies and the need for specialized technical expertise influence market penetration.
Leading Markets & Segments in Automated Breasts Ultrasound Systems
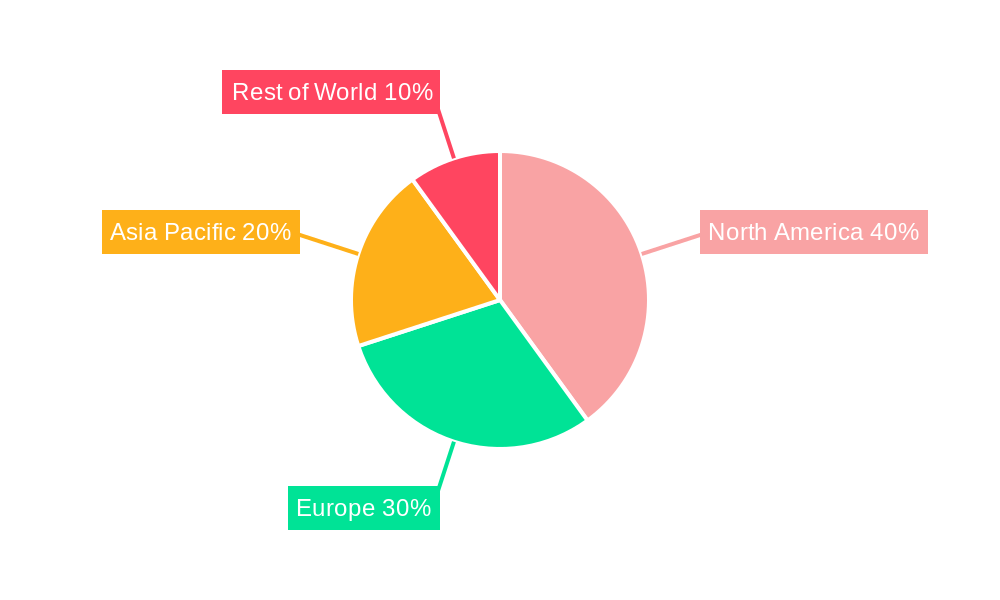
The North American market holds the dominant position in the automated breast ultrasound systems market, primarily due to the high prevalence of breast cancer, advanced healthcare infrastructure, and strong regulatory support. Within the application segment, hospitals are the primary users, owing to their higher patient volume and availability of skilled professionals. Automated Breast Ultrasound Systems constitute the largest segment by type, reflecting greater market maturity and wider adoption compared to Automated Breast Volume Scanners.
Key Drivers for North American Dominance:
- High healthcare expenditure and advanced medical infrastructure.
- Strong regulatory framework supporting the adoption of advanced diagnostic technologies.
- Early detection initiatives promoting breast cancer screening programs.
- Strong research and development activities in the medical device sector.
Other key markets include: Europe and Asia-Pacific, where the market is witnessing considerable growth, driven by factors such as increasing awareness about breast cancer, rising disposable incomes and improving healthcare infrastructure.
Automated Breasts Ultrasound Systems Product Developments
Recent product developments focus on enhancing image quality, improving workflow efficiency, and integrating advanced features such as AI-powered analysis. New systems offer improved ergonomics, user-friendly interfaces, and enhanced portability for wider accessibility. Manufacturers are increasingly incorporating 3D and 4D imaging capabilities, along with advanced compression techniques to enhance diagnostic accuracy and minimize patient discomfort. The integration of cloud-based platforms for data management and remote diagnostics is gaining traction, allowing for improved collaboration among healthcare professionals and more efficient workflows.
Key Drivers of Automated Breasts Ultrasound Systems Growth
Several factors contribute to the sustained growth of the automated breast ultrasound systems market. These include:
- The rising prevalence of breast cancer globally is a major driver. Early detection and effective treatment significantly improve patient outcomes, creating a demand for advanced diagnostic tools.
- Technological advancements, especially the integration of AI and machine learning, enhance diagnostic accuracy and efficiency, making the technology more appealing to both healthcare professionals and patients.
- Government initiatives and health policies promoting breast cancer screening and early detection contribute to market expansion.
Challenges in the Automated Breasts Ultrasound Systems Market
The market faces certain challenges, including:
- High initial investment costs associated with acquiring and implementing automated systems can pose a barrier for smaller healthcare facilities.
- The need for specialized training for healthcare professionals to operate and interpret the advanced imaging data can limit widespread adoption.
- Competition from established imaging modalities like mammography and the emergence of alternative technologies presents a challenge for market penetration.
Emerging Opportunities in Automated Breasts Ultrasound Systems
The market offers significant opportunities for growth. The development of AI-powered systems with improved image quality and faster processing speeds creates potential for higher accuracy and efficiency. Strategic partnerships between technology providers and healthcare institutions can drive wider adoption. Expanding market access into developing countries with rising awareness about breast health represents a significant opportunity for future growth.
Leading Players in the Automated Breasts Ultrasound Systems Sector
- Canon Medical Systems
- GE Healthcare
- Hitachi Ltd.
- Koninklijke Philips NV
- Metritrack Inc.
- Nova Medical Imaging Technology Co. Ltd.
- QView Medical Inc.
- Siemens AG
- SonoCine Inc.
- SuperSonic Imagine
Key Milestones in Automated Breasts Ultrasound Systems Industry
- 2020: Launch of AI-powered automated breast ultrasound system by [Company Name].
- 2022: FDA approval for a new automated breast volume scanner.
- 2023: Strategic partnership between [Company A] and [Company B] for joint development of advanced imaging technologies.
- 2024: Acquisition of [Company X] by [Company Y], expanding market reach.
Strategic Outlook for Automated Breasts Ultrasound Systems Market
The automated breast ultrasound systems market is poised for significant growth driven by technological advancements, increasing awareness of breast cancer, and favorable regulatory support. Strategic partnerships, focusing on product innovation and market penetration in developing economies, will be vital for long-term success. The integration of AI and machine learning will continue to reshape the market, improving diagnostic accuracy, efficiency, and accessibility of breast cancer screening.
Automated Breasts Ultrasound Systems Segmentation
-
1. Application
- 1.1. Hospitals
- 1.2. Ambulatory Surgery Centers
- 1.3. Others
-
2. Types
- 2.1. Automated Breast Ultrasound System
- 2.2. Automated Breast Volume Scanner
Automated Breasts Ultrasound Systems Segmentation By Geography
-
1. North America
- 1.1. United States
- 1.2. Canada
- 1.3. Mexico
-
2. South America
- 2.1. Brazil
- 2.2. Argentina
- 2.3. Rest of South America
-
3. Europe
- 3.1. United Kingdom
- 3.2. Germany
- 3.3. France
- 3.4. Italy
- 3.5. Spain
- 3.6. Russia
- 3.7. Benelux
- 3.8. Nordics
- 3.9. Rest of Europe
-
4. Middle East & Africa
- 4.1. Turkey
- 4.2. Israel
- 4.3. GCC
- 4.4. North Africa
- 4.5. South Africa
- 4.6. Rest of Middle East & Africa
-
5. Asia Pacific
- 5.1. China
- 5.2. India
- 5.3. Japan
- 5.4. South Korea
- 5.5. ASEAN
- 5.6. Oceania
- 5.7. Rest of Asia Pacific
Automated Breasts Ultrasound Systems Regional Market Share
Geographic Coverage of Automated Breasts Ultrasound Systems
Automated Breasts Ultrasound Systems REPORT HIGHLIGHTS
| Aspects | Details |
|---|---|
| Study Period | 2020-2034 |
| Base Year | 2025 |
| Estimated Year | 2026 |
| Forecast Period | 2026-2034 |
| Historical Period | 2020-2025 |
| Growth Rate | CAGR of XX% from 2020-2034 |
| Segmentation |
|
Table of Contents
- 1. Introduction
- 1.1. Research Scope
- 1.2. Market Segmentation
- 1.3. Research Methodology
- 1.4. Definitions and Assumptions
- 2. Executive Summary
- 2.1. Introduction
- 3. Market Dynamics
- 3.1. Introduction
- 3.2. Market Drivers
- 3.3. Market Restrains
- 3.4. Market Trends
- 4. Market Factor Analysis
- 4.1. Porters Five Forces
- 4.2. Supply/Value Chain
- 4.3. PESTEL analysis
- 4.4. Market Entropy
- 4.5. Patent/Trademark Analysis
- 5. Global Automated Breasts Ultrasound Systems Analysis, Insights and Forecast, 2020-2032
- 5.1. Market Analysis, Insights and Forecast - by Application
- 5.1.1. Hospitals
- 5.1.2. Ambulatory Surgery Centers
- 5.1.3. Others
- 5.2. Market Analysis, Insights and Forecast - by Types
- 5.2.1. Automated Breast Ultrasound System
- 5.2.2. Automated Breast Volume Scanner
- 5.3. Market Analysis, Insights and Forecast - by Region
- 5.3.1. North America
- 5.3.2. South America
- 5.3.3. Europe
- 5.3.4. Middle East & Africa
- 5.3.5. Asia Pacific
- 5.1. Market Analysis, Insights and Forecast - by Application
- 6. North America Automated Breasts Ultrasound Systems Analysis, Insights and Forecast, 2020-2032
- 6.1. Market Analysis, Insights and Forecast - by Application
- 6.1.1. Hospitals
- 6.1.2. Ambulatory Surgery Centers
- 6.1.3. Others
- 6.2. Market Analysis, Insights and Forecast - by Types
- 6.2.1. Automated Breast Ultrasound System
- 6.2.2. Automated Breast Volume Scanner
- 6.1. Market Analysis, Insights and Forecast - by Application
- 7. South America Automated Breasts Ultrasound Systems Analysis, Insights and Forecast, 2020-2032
- 7.1. Market Analysis, Insights and Forecast - by Application
- 7.1.1. Hospitals
- 7.1.2. Ambulatory Surgery Centers
- 7.1.3. Others
- 7.2. Market Analysis, Insights and Forecast - by Types
- 7.2.1. Automated Breast Ultrasound System
- 7.2.2. Automated Breast Volume Scanner
- 7.1. Market Analysis, Insights and Forecast - by Application
- 8. Europe Automated Breasts Ultrasound Systems Analysis, Insights and Forecast, 2020-2032
- 8.1. Market Analysis, Insights and Forecast - by Application
- 8.1.1. Hospitals
- 8.1.2. Ambulatory Surgery Centers
- 8.1.3. Others
- 8.2. Market Analysis, Insights and Forecast - by Types
- 8.2.1. Automated Breast Ultrasound System
- 8.2.2. Automated Breast Volume Scanner
- 8.1. Market Analysis, Insights and Forecast - by Application
- 9. Middle East & Africa Automated Breasts Ultrasound Systems Analysis, Insights and Forecast, 2020-2032
- 9.1. Market Analysis, Insights and Forecast - by Application
- 9.1.1. Hospitals
- 9.1.2. Ambulatory Surgery Centers
- 9.1.3. Others
- 9.2. Market Analysis, Insights and Forecast - by Types
- 9.2.1. Automated Breast Ultrasound System
- 9.2.2. Automated Breast Volume Scanner
- 9.1. Market Analysis, Insights and Forecast - by Application
- 10. Asia Pacific Automated Breasts Ultrasound Systems Analysis, Insights and Forecast, 2020-2032
- 10.1. Market Analysis, Insights and Forecast - by Application
- 10.1.1. Hospitals
- 10.1.2. Ambulatory Surgery Centers
- 10.1.3. Others
- 10.2. Market Analysis, Insights and Forecast - by Types
- 10.2.1. Automated Breast Ultrasound System
- 10.2.2. Automated Breast Volume Scanner
- 10.1. Market Analysis, Insights and Forecast - by Application
- 11. Competitive Analysis
- 11.1. Global Market Share Analysis 2025
- 11.2. Company Profiles
- 11.2.1 Canon Medical Systems
- 11.2.1.1. Overview
- 11.2.1.2. Products
- 11.2.1.3. SWOT Analysis
- 11.2.1.4. Recent Developments
- 11.2.1.5. Financials (Based on Availability)
- 11.2.2 GE Healthcare
- 11.2.2.1. Overview
- 11.2.2.2. Products
- 11.2.2.3. SWOT Analysis
- 11.2.2.4. Recent Developments
- 11.2.2.5. Financials (Based on Availability)
- 11.2.3 Hitachi Ltd.
- 11.2.3.1. Overview
- 11.2.3.2. Products
- 11.2.3.3. SWOT Analysis
- 11.2.3.4. Recent Developments
- 11.2.3.5. Financials (Based on Availability)
- 11.2.4 Koninklijke Philips NV
- 11.2.4.1. Overview
- 11.2.4.2. Products
- 11.2.4.3. SWOT Analysis
- 11.2.4.4. Recent Developments
- 11.2.4.5. Financials (Based on Availability)
- 11.2.5 Metritrack Inc.
- 11.2.5.1. Overview
- 11.2.5.2. Products
- 11.2.5.3. SWOT Analysis
- 11.2.5.4. Recent Developments
- 11.2.5.5. Financials (Based on Availability)
- 11.2.6 Nova Medical Imaging Technology Co. Ltd.
- 11.2.6.1. Overview
- 11.2.6.2. Products
- 11.2.6.3. SWOT Analysis
- 11.2.6.4. Recent Developments
- 11.2.6.5. Financials (Based on Availability)
- 11.2.7 QView Medical Inc.
- 11.2.7.1. Overview
- 11.2.7.2. Products
- 11.2.7.3. SWOT Analysis
- 11.2.7.4. Recent Developments
- 11.2.7.5. Financials (Based on Availability)
- 11.2.8 Siemens AG
- 11.2.8.1. Overview
- 11.2.8.2. Products
- 11.2.8.3. SWOT Analysis
- 11.2.8.4. Recent Developments
- 11.2.8.5. Financials (Based on Availability)
- 11.2.9 SonoCine Inc.
- 11.2.9.1. Overview
- 11.2.9.2. Products
- 11.2.9.3. SWOT Analysis
- 11.2.9.4. Recent Developments
- 11.2.9.5. Financials (Based on Availability)
- 11.2.10 SuperSonic Imagine
- 11.2.10.1. Overview
- 11.2.10.2. Products
- 11.2.10.3. SWOT Analysis
- 11.2.10.4. Recent Developments
- 11.2.10.5. Financials (Based on Availability)
- 11.2.1 Canon Medical Systems
List of Figures
- Figure 1: Global Automated Breasts Ultrasound Systems Revenue Breakdown (million, %) by Region 2025 & 2033
- Figure 2: Global Automated Breasts Ultrasound Systems Volume Breakdown (K, %) by Region 2025 & 2033
- Figure 3: North America Automated Breasts Ultrasound Systems Revenue (million), by Application 2025 & 2033
- Figure 4: North America Automated Breasts Ultrasound Systems Volume (K), by Application 2025 & 2033
- Figure 5: North America Automated Breasts Ultrasound Systems Revenue Share (%), by Application 2025 & 2033
- Figure 6: North America Automated Breasts Ultrasound Systems Volume Share (%), by Application 2025 & 2033
- Figure 7: North America Automated Breasts Ultrasound Systems Revenue (million), by Types 2025 & 2033
- Figure 8: North America Automated Breasts Ultrasound Systems Volume (K), by Types 2025 & 2033
- Figure 9: North America Automated Breasts Ultrasound Systems Revenue Share (%), by Types 2025 & 2033
- Figure 10: North America Automated Breasts Ultrasound Systems Volume Share (%), by Types 2025 & 2033
- Figure 11: North America Automated Breasts Ultrasound Systems Revenue (million), by Country 2025 & 2033
- Figure 12: North America Automated Breasts Ultrasound Systems Volume (K), by Country 2025 & 2033
- Figure 13: North America Automated Breasts Ultrasound Systems Revenue Share (%), by Country 2025 & 2033
- Figure 14: North America Automated Breasts Ultrasound Systems Volume Share (%), by Country 2025 & 2033
- Figure 15: South America Automated Breasts Ultrasound Systems Revenue (million), by Application 2025 & 2033
- Figure 16: South America Automated Breasts Ultrasound Systems Volume (K), by Application 2025 & 2033
- Figure 17: South America Automated Breasts Ultrasound Systems Revenue Share (%), by Application 2025 & 2033
- Figure 18: South America Automated Breasts Ultrasound Systems Volume Share (%), by Application 2025 & 2033
- Figure 19: South America Automated Breasts Ultrasound Systems Revenue (million), by Types 2025 & 2033
- Figure 20: South America Automated Breasts Ultrasound Systems Volume (K), by Types 2025 & 2033
- Figure 21: South America Automated Breasts Ultrasound Systems Revenue Share (%), by Types 2025 & 2033
- Figure 22: South America Automated Breasts Ultrasound Systems Volume Share (%), by Types 2025 & 2033
- Figure 23: South America Automated Breasts Ultrasound Systems Revenue (million), by Country 2025 & 2033
- Figure 24: South America Automated Breasts Ultrasound Systems Volume (K), by Country 2025 & 2033
- Figure 25: South America Automated Breasts Ultrasound Systems Revenue Share (%), by Country 2025 & 2033
- Figure 26: South America Automated Breasts Ultrasound Systems Volume Share (%), by Country 2025 & 2033
- Figure 27: Europe Automated Breasts Ultrasound Systems Revenue (million), by Application 2025 & 2033
- Figure 28: Europe Automated Breasts Ultrasound Systems Volume (K), by Application 2025 & 2033
- Figure 29: Europe Automated Breasts Ultrasound Systems Revenue Share (%), by Application 2025 & 2033
- Figure 30: Europe Automated Breasts Ultrasound Systems Volume Share (%), by Application 2025 & 2033
- Figure 31: Europe Automated Breasts Ultrasound Systems Revenue (million), by Types 2025 & 2033
- Figure 32: Europe Automated Breasts Ultrasound Systems Volume (K), by Types 2025 & 2033
- Figure 33: Europe Automated Breasts Ultrasound Systems Revenue Share (%), by Types 2025 & 2033
- Figure 34: Europe Automated Breasts Ultrasound Systems Volume Share (%), by Types 2025 & 2033
- Figure 35: Europe Automated Breasts Ultrasound Systems Revenue (million), by Country 2025 & 2033
- Figure 36: Europe Automated Breasts Ultrasound Systems Volume (K), by Country 2025 & 2033
- Figure 37: Europe Automated Breasts Ultrasound Systems Revenue Share (%), by Country 2025 & 2033
- Figure 38: Europe Automated Breasts Ultrasound Systems Volume Share (%), by Country 2025 & 2033
- Figure 39: Middle East & Africa Automated Breasts Ultrasound Systems Revenue (million), by Application 2025 & 2033
- Figure 40: Middle East & Africa Automated Breasts Ultrasound Systems Volume (K), by Application 2025 & 2033
- Figure 41: Middle East & Africa Automated Breasts Ultrasound Systems Revenue Share (%), by Application 2025 & 2033
- Figure 42: Middle East & Africa Automated Breasts Ultrasound Systems Volume Share (%), by Application 2025 & 2033
- Figure 43: Middle East & Africa Automated Breasts Ultrasound Systems Revenue (million), by Types 2025 & 2033
- Figure 44: Middle East & Africa Automated Breasts Ultrasound Systems Volume (K), by Types 2025 & 2033
- Figure 45: Middle East & Africa Automated Breasts Ultrasound Systems Revenue Share (%), by Types 2025 & 2033
- Figure 46: Middle East & Africa Automated Breasts Ultrasound Systems Volume Share (%), by Types 2025 & 2033
- Figure 47: Middle East & Africa Automated Breasts Ultrasound Systems Revenue (million), by Country 2025 & 2033
- Figure 48: Middle East & Africa Automated Breasts Ultrasound Systems Volume (K), by Country 2025 & 2033
- Figure 49: Middle East & Africa Automated Breasts Ultrasound Systems Revenue Share (%), by Country 2025 & 2033
- Figure 50: Middle East & Africa Automated Breasts Ultrasound Systems Volume Share (%), by Country 2025 & 2033
- Figure 51: Asia Pacific Automated Breasts Ultrasound Systems Revenue (million), by Application 2025 & 2033
- Figure 52: Asia Pacific Automated Breasts Ultrasound Systems Volume (K), by Application 2025 & 2033
- Figure 53: Asia Pacific Automated Breasts Ultrasound Systems Revenue Share (%), by Application 2025 & 2033
- Figure 54: Asia Pacific Automated Breasts Ultrasound Systems Volume Share (%), by Application 2025 & 2033
- Figure 55: Asia Pacific Automated Breasts Ultrasound Systems Revenue (million), by Types 2025 & 2033
- Figure 56: Asia Pacific Automated Breasts Ultrasound Systems Volume (K), by Types 2025 & 2033
- Figure 57: Asia Pacific Automated Breasts Ultrasound Systems Revenue Share (%), by Types 2025 & 2033
- Figure 58: Asia Pacific Automated Breasts Ultrasound Systems Volume Share (%), by Types 2025 & 2033
- Figure 59: Asia Pacific Automated Breasts Ultrasound Systems Revenue (million), by Country 2025 & 2033
- Figure 60: Asia Pacific Automated Breasts Ultrasound Systems Volume (K), by Country 2025 & 2033
- Figure 61: Asia Pacific Automated Breasts Ultrasound Systems Revenue Share (%), by Country 2025 & 2033
- Figure 62: Asia Pacific Automated Breasts Ultrasound Systems Volume Share (%), by Country 2025 & 2033
List of Tables
- Table 1: Global Automated Breasts Ultrasound Systems Revenue million Forecast, by Application 2020 & 2033
- Table 2: Global Automated Breasts Ultrasound Systems Volume K Forecast, by Application 2020 & 2033
- Table 3: Global Automated Breasts Ultrasound Systems Revenue million Forecast, by Types 2020 & 2033
- Table 4: Global Automated Breasts Ultrasound Systems Volume K Forecast, by Types 2020 & 2033
- Table 5: Global Automated Breasts Ultrasound Systems Revenue million Forecast, by Region 2020 & 2033
- Table 6: Global Automated Breasts Ultrasound Systems Volume K Forecast, by Region 2020 & 2033
- Table 7: Global Automated Breasts Ultrasound Systems Revenue million Forecast, by Application 2020 & 2033
- Table 8: Global Automated Breasts Ultrasound Systems Volume K Forecast, by Application 2020 & 2033
- Table 9: Global Automated Breasts Ultrasound Systems Revenue million Forecast, by Types 2020 & 2033
- Table 10: Global Automated Breasts Ultrasound Systems Volume K Forecast, by Types 2020 & 2033
- Table 11: Global Automated Breasts Ultrasound Systems Revenue million Forecast, by Country 2020 & 2033
- Table 12: Global Automated Breasts Ultrasound Systems Volume K Forecast, by Country 2020 & 2033
- Table 13: United States Automated Breasts Ultrasound Systems Revenue (million) Forecast, by Application 2020 & 2033
- Table 14: United States Automated Breasts Ultrasound Systems Volume (K) Forecast, by Application 2020 & 2033
- Table 15: Canada Automated Breasts Ultrasound Systems Revenue (million) Forecast, by Application 2020 & 2033
- Table 16: Canada Automated Breasts Ultrasound Systems Volume (K) Forecast, by Application 2020 & 2033
- Table 17: Mexico Automated Breasts Ultrasound Systems Revenue (million) Forecast, by Application 2020 & 2033
- Table 18: Mexico Automated Breasts Ultrasound Systems Volume (K) Forecast, by Application 2020 & 2033
- Table 19: Global Automated Breasts Ultrasound Systems Revenue million Forecast, by Application 2020 & 2033
- Table 20: Global Automated Breasts Ultrasound Systems Volume K Forecast, by Application 2020 & 2033
- Table 21: Global Automated Breasts Ultrasound Systems Revenue million Forecast, by Types 2020 & 2033
- Table 22: Global Automated Breasts Ultrasound Systems Volume K Forecast, by Types 2020 & 2033
- Table 23: Global Automated Breasts Ultrasound Systems Revenue million Forecast, by Country 2020 & 2033
- Table 24: Global Automated Breasts Ultrasound Systems Volume K Forecast, by Country 2020 & 2033
- Table 25: Brazil Automated Breasts Ultrasound Systems Revenue (million) Forecast, by Application 2020 & 2033
- Table 26: Brazil Automated Breasts Ultrasound Systems Volume (K) Forecast, by Application 2020 & 2033
- Table 27: Argentina Automated Breasts Ultrasound Systems Revenue (million) Forecast, by Application 2020 & 2033
- Table 28: Argentina Automated Breasts Ultrasound Systems Volume (K) Forecast, by Application 2020 & 2033
- Table 29: Rest of South America Automated Breasts Ultrasound Systems Revenue (million) Forecast, by Application 2020 & 2033
- Table 30: Rest of South America Automated Breasts Ultrasound Systems Volume (K) Forecast, by Application 2020 & 2033
- Table 31: Global Automated Breasts Ultrasound Systems Revenue million Forecast, by Application 2020 & 2033
- Table 32: Global Automated Breasts Ultrasound Systems Volume K Forecast, by Application 2020 & 2033
- Table 33: Global Automated Breasts Ultrasound Systems Revenue million Forecast, by Types 2020 & 2033
- Table 34: Global Automated Breasts Ultrasound Systems Volume K Forecast, by Types 2020 & 2033
- Table 35: Global Automated Breasts Ultrasound Systems Revenue million Forecast, by Country 2020 & 2033
- Table 36: Global Automated Breasts Ultrasound Systems Volume K Forecast, by Country 2020 & 2033
- Table 37: United Kingdom Automated Breasts Ultrasound Systems Revenue (million) Forecast, by Application 2020 & 2033
- Table 38: United Kingdom Automated Breasts Ultrasound Systems Volume (K) Forecast, by Application 2020 & 2033
- Table 39: Germany Automated Breasts Ultrasound Systems Revenue (million) Forecast, by Application 2020 & 2033
- Table 40: Germany Automated Breasts Ultrasound Systems Volume (K) Forecast, by Application 2020 & 2033
- Table 41: France Automated Breasts Ultrasound Systems Revenue (million) Forecast, by Application 2020 & 2033
- Table 42: France Automated Breasts Ultrasound Systems Volume (K) Forecast, by Application 2020 & 2033
- Table 43: Italy Automated Breasts Ultrasound Systems Revenue (million) Forecast, by Application 2020 & 2033
- Table 44: Italy Automated Breasts Ultrasound Systems Volume (K) Forecast, by Application 2020 & 2033
- Table 45: Spain Automated Breasts Ultrasound Systems Revenue (million) Forecast, by Application 2020 & 2033
- Table 46: Spain Automated Breasts Ultrasound Systems Volume (K) Forecast, by Application 2020 & 2033
- Table 47: Russia Automated Breasts Ultrasound Systems Revenue (million) Forecast, by Application 2020 & 2033
- Table 48: Russia Automated Breasts Ultrasound Systems Volume (K) Forecast, by Application 2020 & 2033
- Table 49: Benelux Automated Breasts Ultrasound Systems Revenue (million) Forecast, by Application 2020 & 2033
- Table 50: Benelux Automated Breasts Ultrasound Systems Volume (K) Forecast, by Application 2020 & 2033
- Table 51: Nordics Automated Breasts Ultrasound Systems Revenue (million) Forecast, by Application 2020 & 2033
- Table 52: Nordics Automated Breasts Ultrasound Systems Volume (K) Forecast, by Application 2020 & 2033
- Table 53: Rest of Europe Automated Breasts Ultrasound Systems Revenue (million) Forecast, by Application 2020 & 2033
- Table 54: Rest of Europe Automated Breasts Ultrasound Systems Volume (K) Forecast, by Application 2020 & 2033
- Table 55: Global Automated Breasts Ultrasound Systems Revenue million Forecast, by Application 2020 & 2033
- Table 56: Global Automated Breasts Ultrasound Systems Volume K Forecast, by Application 2020 & 2033
- Table 57: Global Automated Breasts Ultrasound Systems Revenue million Forecast, by Types 2020 & 2033
- Table 58: Global Automated Breasts Ultrasound Systems Volume K Forecast, by Types 2020 & 2033
- Table 59: Global Automated Breasts Ultrasound Systems Revenue million Forecast, by Country 2020 & 2033
- Table 60: Global Automated Breasts Ultrasound Systems Volume K Forecast, by Country 2020 & 2033
- Table 61: Turkey Automated Breasts Ultrasound Systems Revenue (million) Forecast, by Application 2020 & 2033
- Table 62: Turkey Automated Breasts Ultrasound Systems Volume (K) Forecast, by Application 2020 & 2033
- Table 63: Israel Automated Breasts Ultrasound Systems Revenue (million) Forecast, by Application 2020 & 2033
- Table 64: Israel Automated Breasts Ultrasound Systems Volume (K) Forecast, by Application 2020 & 2033
- Table 65: GCC Automated Breasts Ultrasound Systems Revenue (million) Forecast, by Application 2020 & 2033
- Table 66: GCC Automated Breasts Ultrasound Systems Volume (K) Forecast, by Application 2020 & 2033
- Table 67: North Africa Automated Breasts Ultrasound Systems Revenue (million) Forecast, by Application 2020 & 2033
- Table 68: North Africa Automated Breasts Ultrasound Systems Volume (K) Forecast, by Application 2020 & 2033
- Table 69: South Africa Automated Breasts Ultrasound Systems Revenue (million) Forecast, by Application 2020 & 2033
- Table 70: South Africa Automated Breasts Ultrasound Systems Volume (K) Forecast, by Application 2020 & 2033
- Table 71: Rest of Middle East & Africa Automated Breasts Ultrasound Systems Revenue (million) Forecast, by Application 2020 & 2033
- Table 72: Rest of Middle East & Africa Automated Breasts Ultrasound Systems Volume (K) Forecast, by Application 2020 & 2033
- Table 73: Global Automated Breasts Ultrasound Systems Revenue million Forecast, by Application 2020 & 2033
- Table 74: Global Automated Breasts Ultrasound Systems Volume K Forecast, by Application 2020 & 2033
- Table 75: Global Automated Breasts Ultrasound Systems Revenue million Forecast, by Types 2020 & 2033
- Table 76: Global Automated Breasts Ultrasound Systems Volume K Forecast, by Types 2020 & 2033
- Table 77: Global Automated Breasts Ultrasound Systems Revenue million Forecast, by Country 2020 & 2033
- Table 78: Global Automated Breasts Ultrasound Systems Volume K Forecast, by Country 2020 & 2033
- Table 79: China Automated Breasts Ultrasound Systems Revenue (million) Forecast, by Application 2020 & 2033
- Table 80: China Automated Breasts Ultrasound Systems Volume (K) Forecast, by Application 2020 & 2033
- Table 81: India Automated Breasts Ultrasound Systems Revenue (million) Forecast, by Application 2020 & 2033
- Table 82: India Automated Breasts Ultrasound Systems Volume (K) Forecast, by Application 2020 & 2033
- Table 83: Japan Automated Breasts Ultrasound Systems Revenue (million) Forecast, by Application 2020 & 2033
- Table 84: Japan Automated Breasts Ultrasound Systems Volume (K) Forecast, by Application 2020 & 2033
- Table 85: South Korea Automated Breasts Ultrasound Systems Revenue (million) Forecast, by Application 2020 & 2033
- Table 86: South Korea Automated Breasts Ultrasound Systems Volume (K) Forecast, by Application 2020 & 2033
- Table 87: ASEAN Automated Breasts Ultrasound Systems Revenue (million) Forecast, by Application 2020 & 2033
- Table 88: ASEAN Automated Breasts Ultrasound Systems Volume (K) Forecast, by Application 2020 & 2033
- Table 89: Oceania Automated Breasts Ultrasound Systems Revenue (million) Forecast, by Application 2020 & 2033
- Table 90: Oceania Automated Breasts Ultrasound Systems Volume (K) Forecast, by Application 2020 & 2033
- Table 91: Rest of Asia Pacific Automated Breasts Ultrasound Systems Revenue (million) Forecast, by Application 2020 & 2033
- Table 92: Rest of Asia Pacific Automated Breasts Ultrasound Systems Volume (K) Forecast, by Application 2020 & 2033
Frequently Asked Questions
1. What is the projected Compound Annual Growth Rate (CAGR) of the Automated Breasts Ultrasound Systems?
The projected CAGR is approximately XX%.
2. Which companies are prominent players in the Automated Breasts Ultrasound Systems?
Key companies in the market include Canon Medical Systems, GE Healthcare, Hitachi Ltd., Koninklijke Philips NV, Metritrack Inc., Nova Medical Imaging Technology Co. Ltd., QView Medical Inc., Siemens AG, SonoCine Inc., SuperSonic Imagine.
3. What are the main segments of the Automated Breasts Ultrasound Systems?
The market segments include Application, Types.
4. Can you provide details about the market size?
The market size is estimated to be USD XXX million as of 2022.
5. What are some drivers contributing to market growth?
N/A
6. What are the notable trends driving market growth?
N/A
7. Are there any restraints impacting market growth?
N/A
8. Can you provide examples of recent developments in the market?
N/A
9. What pricing options are available for accessing the report?
Pricing options include single-user, multi-user, and enterprise licenses priced at USD 3350.00, USD 5025.00, and USD 6700.00 respectively.
10. Is the market size provided in terms of value or volume?
The market size is provided in terms of value, measured in million and volume, measured in K.
11. Are there any specific market keywords associated with the report?
Yes, the market keyword associated with the report is "Automated Breasts Ultrasound Systems," which aids in identifying and referencing the specific market segment covered.
12. How do I determine which pricing option suits my needs best?
The pricing options vary based on user requirements and access needs. Individual users may opt for single-user licenses, while businesses requiring broader access may choose multi-user or enterprise licenses for cost-effective access to the report.
13. Are there any additional resources or data provided in the Automated Breasts Ultrasound Systems report?
While the report offers comprehensive insights, it's advisable to review the specific contents or supplementary materials provided to ascertain if additional resources or data are available.
14. How can I stay updated on further developments or reports in the Automated Breasts Ultrasound Systems?
To stay informed about further developments, trends, and reports in the Automated Breasts Ultrasound Systems, consider subscribing to industry newsletters, following relevant companies and organizations, or regularly checking reputable industry news sources and publications.
Methodology
Step 1 - Identification of Relevant Samples Size from Population Database


Step 2 - Approaches for Defining Global Market Size (Value, Volume* & Price*)

Note*: In applicable scenarios
Step 3 - Data Sources
Primary Research
- Web Analytics
- Survey Reports
- Research Institute
- Latest Research Reports
- Opinion Leaders
Secondary Research
- Annual Reports
- White Paper
- Latest Press Release
- Industry Association
- Paid Database
- Investor Presentations

Step 4 - Data Triangulation
Involves using different sources of information in order to increase the validity of a study
These sources are likely to be stakeholders in a program - participants, other researchers, program staff, other community members, and so on.
Then we put all data in single framework & apply various statistical tools to find out the dynamic on the market.
During the analysis stage, feedback from the stakeholder groups would be compared to determine areas of agreement as well as areas of divergence