

Key Insights
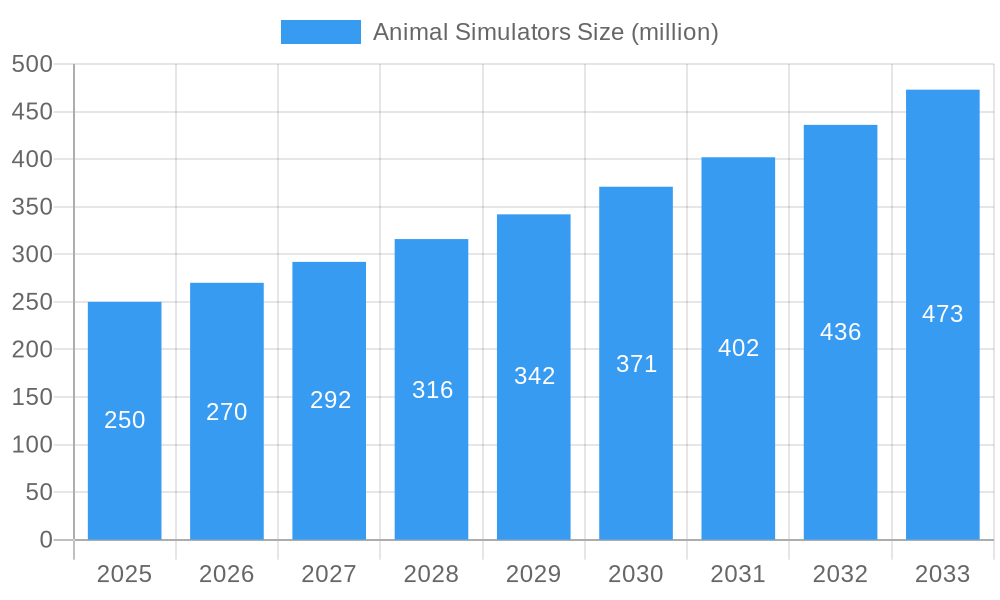
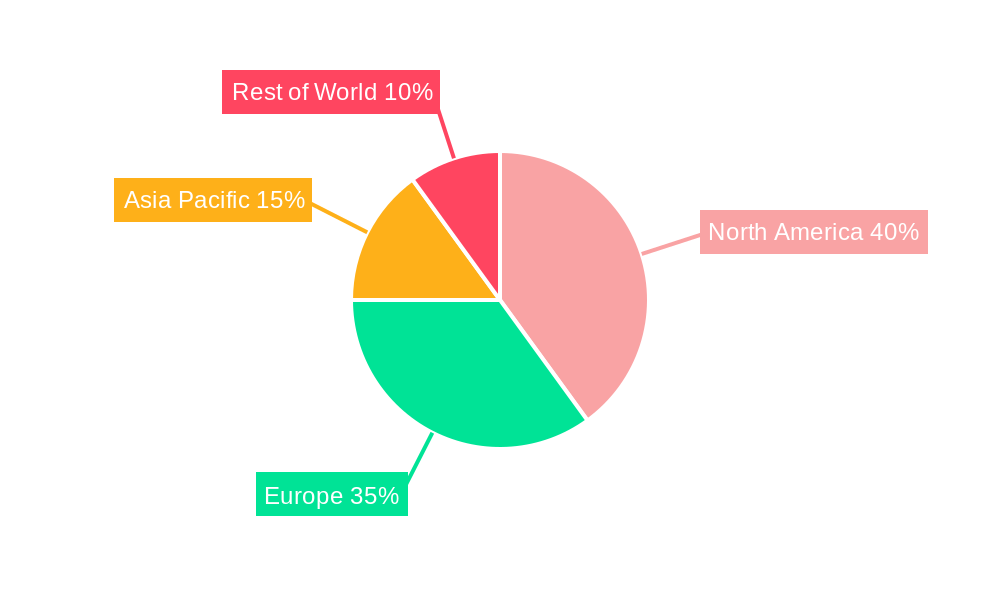
The global animal simulator market is experiencing robust growth, driven by increasing demand for advanced veterinary training and improved animal care practices. The market, estimated at $250 million in 2025, is projected to exhibit a Compound Annual Growth Rate (CAGR) of 8% from 2025 to 2033, reaching an estimated $450 million by 2033. This growth is fueled by several key factors. Firstly, the rising number of veterinary schools and training centers globally necessitates more sophisticated and realistic training tools. Secondly, the increasing focus on animal welfare and improved surgical techniques is driving adoption of simulators for practice and refinement of procedures. Thirdly, technological advancements leading to more lifelike and interactive simulators are enhancing their effectiveness and appeal. The market segmentation reveals strong demand across various application areas, including training for routine examinations, surgical procedures, and emergency response scenarios. Whole-body simulators currently dominate the market, but part-body simulators are witnessing rapid growth due to their specialized applications and cost-effectiveness. Key players like Veterinary Simulator Industries, TraumaFX, and Bioseb are continuously innovating, introducing new models with enhanced features and functionalities to maintain their competitive edge. Geographic analysis indicates that North America and Europe currently hold the largest market shares, driven by well-established veterinary infrastructure and advanced medical technologies. However, the Asia-Pacific region is expected to showcase substantial growth in the coming years due to increasing investments in veterinary education and a rising pet-owning population.
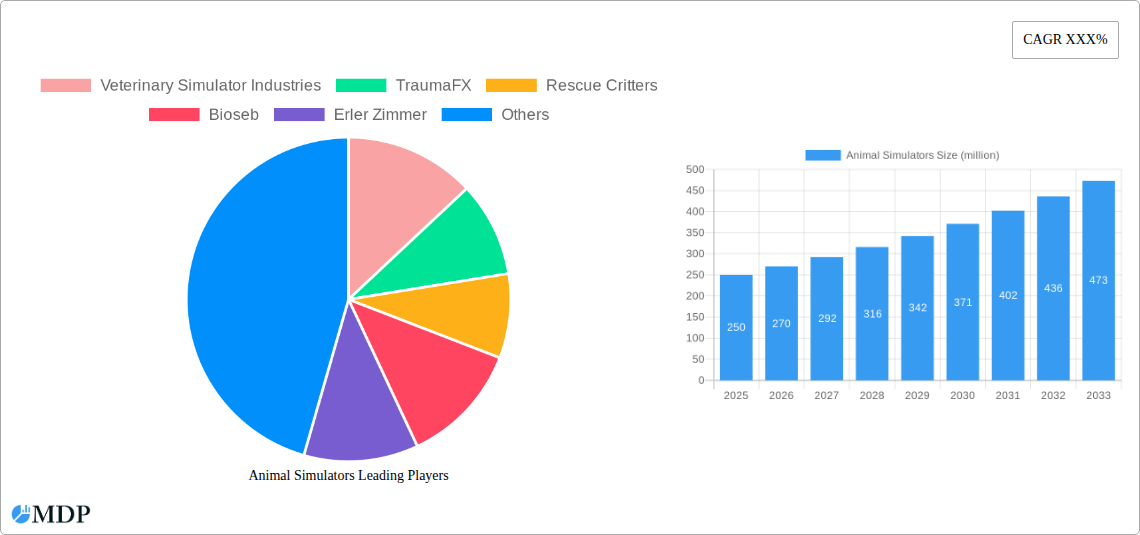
Animal Simulators Market Size (In Million)
The market's growth is not without challenges. High initial investment costs associated with acquiring sophisticated simulators can pose a barrier to entry for smaller veterinary clinics and training facilities. Furthermore, the need for regular maintenance and software updates can contribute to ongoing operational expenses. However, the long-term benefits of enhanced training and improved patient outcomes outweigh these challenges, ensuring continued market expansion. The ongoing development of virtual reality (VR) and augmented reality (AR) integrated simulators is poised to further revolutionize the industry, fostering even greater realism and improving training effectiveness in the years to come. The integration of AI-driven feedback mechanisms is another area of significant innovation, promising to personalize training and optimize learning outcomes.
Animal Simulators Company Market Share
Animal Simulators Market Report: 2019-2033 – A Comprehensive Analysis of a Multi-Million Dollar Industry
This comprehensive report provides an in-depth analysis of the global animal simulators market, projecting a multi-million dollar valuation by 2033. The study period covers 2019-2033, with 2025 as the base and estimated year. The report offers actionable insights for industry stakeholders, including manufacturers like Veterinary Simulator Industries, TraumaFX, Rescue Critters, Bioseb, and Erler Zimmer, and investors seeking opportunities in this rapidly evolving sector. Key market segments are analyzed, including application (training and treatment) and simulator type (whole body and part body). The report utilizes a robust methodology incorporating historical data (2019-2024) and detailed forecasting (2025-2033) to provide a clear picture of market dynamics and future growth potential. This report is designed to be delivered without modification.
Animal Simulators Market Dynamics & Concentration
The global animal simulators market, valued at xx million in 2025, is characterized by moderate concentration with several key players vying for market share. Veterinary Simulator Industries currently holds an estimated xx% market share, followed by TraumaFX with xx%, Bioseb at xx%, and Erler Zimmer with xx%. Rescue Critters holds a smaller, but significant xx% market share. The market exhibits a dynamic landscape influenced by several factors:
- Innovation Drivers: Ongoing advancements in materials science, robotics, and simulation software are driving the development of more realistic and sophisticated animal simulators.
- Regulatory Frameworks: Stringent regulations regarding animal welfare and ethical research are shaping market growth and innovation, particularly in the training segment. xx% of the market's growth is estimated to be influenced by these regulations.
- Product Substitutes: While limited, traditional training methods using live animals remain a substitute for simulators. However, the rising costs and ethical concerns surrounding live animal use are driving increased adoption of simulators.
- End-User Trends: The increasing demand for improved veterinary training and advancements in surgical techniques are key drivers of market growth. Animal shelters and research institutions are also important end-users, accounting for xx million in spending in 2025.
- M&A Activities: The past five years have witnessed xx M&A deals in the animal simulators market, indicating a trend towards consolidation and strategic partnerships within the industry. These deals primarily focused on expanding product portfolios and enhancing technological capabilities.
Animal Simulators Industry Trends & Analysis
The global animal simulators market is projected to experience a CAGR of xx% during the forecast period (2025-2033), driven by a multitude of factors. Market penetration currently sits at xx%, indicating significant potential for future growth. Technological disruptions are reshaping the industry with the emergence of advanced simulation software and the integration of haptic feedback technologies enhancing the realism and effectiveness of training and treatment. This technological disruption has influenced xx% of market changes in the last 5 years. Consumer preferences are shifting towards more realistic and versatile simulators that can accommodate a wider range of animal species and procedures. Competitive dynamics are intensifying with companies focusing on product differentiation, technological innovation, and strategic partnerships to maintain a competitive edge. The increased emphasis on cost-effectiveness and training efficiency also fuels market growth, particularly in emerging economies. The increasing prevalence of chronic diseases in companion animals is further driving demand, as simulators aid in specialized treatment training and simulations.
Leading Markets & Segments in Animal Simulators
The North American region currently dominates the animal simulators market, holding approximately xx% of the global market share in 2025. This dominance is primarily attributed to:
- Strong Regulatory Support: Favorable regulatory frameworks supporting advancements in animal welfare and research contribute to higher adoption rates.
- Advanced Healthcare Infrastructure: Well-established veterinary schools and research institutions provide a strong foundation for the market's growth.
- High Disposable Incomes: Increased disposable income among pet owners fuels higher spending on advanced veterinary care and training.
Within the application segment, the training segment accounts for the largest share (xx%) of the market, driven by the growing need for skilled veterinary professionals. In terms of simulator type, whole-body simulators hold a significant market share (xx%), primarily because of their versatility in accommodating different training scenarios and procedures. The part-body segment, however, is exhibiting strong growth due to specialized needs and cost-effectiveness.
Animal Simulators Product Developments
Recent product innovations focus on enhancing realism, incorporating advanced haptic feedback technologies, and expanding simulator functionalities. New simulators are being designed with modularity, allowing customization for different animal species and procedures. These advancements enhance training effectiveness and cater to the specific needs of different veterinary specialties. The integration of virtual reality (VR) and augmented reality (AR) technologies further enhances training experience and efficacy, leading to improved learning outcomes and ultimately, better animal care.
Key Drivers of Animal Simulators Growth
Several key factors are driving the growth of the animal simulators market:
- Technological advancements: The integration of VR/AR, haptic feedback, and advanced software is significantly enhancing the realism and effectiveness of simulators.
- Rising veterinary education costs: Simulators offer a cost-effective alternative to traditional training methods using live animals.
- Increasing awareness of animal welfare: Simulators are seen as ethical alternatives, reducing the reliance on live animals for training purposes.
Challenges in the Animal Simulators Market
The animal simulators market faces several challenges:
- High initial investment costs: The high cost of purchasing advanced simulators can be a barrier for smaller veterinary clinics and educational institutions. This accounts for approximately xx% of market entry barriers.
- Limited availability of skilled technicians: Specialized training and expertise are required to operate and maintain complex simulators.
- Competition from traditional training methods: The continued use of live animals for training poses a challenge to market penetration.
Emerging Opportunities in Animal Simulators
The market presents exciting opportunities for long-term growth:
- Expansion into emerging markets: The growing veterinary sector in developing countries presents significant opportunities for market expansion.
- Development of specialized simulators: Creating simulators for specific animal species and procedures can address unmet market needs.
- Strategic partnerships: Collaborations between simulator manufacturers and veterinary institutions can enhance product development and market reach.
Leading Players in the Animal Simulators Sector
- Bioseb
- Erler Zimmer
- Rescue Critters
- TraumaFX
- Veterinary Simulator Industries
Key Milestones in Animal Simulators Industry
- 2020: Bioseb launched a new generation of canine surgical simulators.
- 2021: Veterinary Simulator Industries partnered with a major veterinary school to develop a custom equine simulator.
- 2022: TraumaFX introduced a highly realistic small animal trauma simulator.
- 2023: Significant regulatory changes in the EU impacted the market positively.
- 2024: Several smaller companies were acquired by major players.
Strategic Outlook for Animal Simulators Market
The animal simulators market is poised for substantial growth over the next decade. Strategic investments in research and development, focusing on innovative technologies and expanding product portfolios, will be crucial for success. Focusing on expanding into new geographic markets and developing specialized simulators tailored to specific animal species and procedures will be key growth accelerators. Partnerships with veterinary schools and research institutions will be vital for achieving market penetration and shaping future industry standards.
Animal Simulators Segmentation
-
1. Application
- 1.1. Training
- 1.2. Treatment
-
2. Type
- 2.1. Whole Body
- 2.2. Part Body
Animal Simulators Segmentation By Geography
-
1. North America
- 1.1. United States
- 1.2. Canada
- 1.3. Mexico
-
2. South America
- 2.1. Brazil
- 2.2. Argentina
- 2.3. Rest of South America
-
3. Europe
- 3.1. United Kingdom
- 3.2. Germany
- 3.3. France
- 3.4. Italy
- 3.5. Spain
- 3.6. Russia
- 3.7. Benelux
- 3.8. Nordics
- 3.9. Rest of Europe
-
4. Middle East & Africa
- 4.1. Turkey
- 4.2. Israel
- 4.3. GCC
- 4.4. North Africa
- 4.5. South Africa
- 4.6. Rest of Middle East & Africa
-
5. Asia Pacific
- 5.1. China
- 5.2. India
- 5.3. Japan
- 5.4. South Korea
- 5.5. ASEAN
- 5.6. Oceania
- 5.7. Rest of Asia Pacific
Animal Simulators Regional Market Share
Geographic Coverage of Animal Simulators
Animal Simulators REPORT HIGHLIGHTS
| Aspects | Details |
|---|---|
| Study Period | 2020-2034 |
| Base Year | 2025 |
| Estimated Year | 2026 |
| Forecast Period | 2026-2034 |
| Historical Period | 2020-2025 |
| Growth Rate | CAGR of XXX% from 2020-2034 |
| Segmentation |
|
Table of Contents
- 1. Introduction
- 1.1. Research Scope
- 1.2. Market Segmentation
- 1.3. Research Methodology
- 1.4. Definitions and Assumptions
- 2. Executive Summary
- 2.1. Introduction
- 3. Market Dynamics
- 3.1. Introduction
- 3.2. Market Drivers
- 3.3. Market Restrains
- 3.4. Market Trends
- 4. Market Factor Analysis
- 4.1. Porters Five Forces
- 4.2. Supply/Value Chain
- 4.3. PESTEL analysis
- 4.4. Market Entropy
- 4.5. Patent/Trademark Analysis
- 5. Global Animal Simulators Analysis, Insights and Forecast, 2020-2032
- 5.1. Market Analysis, Insights and Forecast - by Application
- 5.1.1. Training
- 5.1.2. Treatment
- 5.2. Market Analysis, Insights and Forecast - by Type
- 5.2.1. Whole Body
- 5.2.2. Part Body
- 5.3. Market Analysis, Insights and Forecast - by Region
- 5.3.1. North America
- 5.3.2. South America
- 5.3.3. Europe
- 5.3.4. Middle East & Africa
- 5.3.5. Asia Pacific
- 5.1. Market Analysis, Insights and Forecast - by Application
- 6. North America Animal Simulators Analysis, Insights and Forecast, 2020-2032
- 6.1. Market Analysis, Insights and Forecast - by Application
- 6.1.1. Training
- 6.1.2. Treatment
- 6.2. Market Analysis, Insights and Forecast - by Type
- 6.2.1. Whole Body
- 6.2.2. Part Body
- 6.1. Market Analysis, Insights and Forecast - by Application
- 7. South America Animal Simulators Analysis, Insights and Forecast, 2020-2032
- 7.1. Market Analysis, Insights and Forecast - by Application
- 7.1.1. Training
- 7.1.2. Treatment
- 7.2. Market Analysis, Insights and Forecast - by Type
- 7.2.1. Whole Body
- 7.2.2. Part Body
- 7.1. Market Analysis, Insights and Forecast - by Application
- 8. Europe Animal Simulators Analysis, Insights and Forecast, 2020-2032
- 8.1. Market Analysis, Insights and Forecast - by Application
- 8.1.1. Training
- 8.1.2. Treatment
- 8.2. Market Analysis, Insights and Forecast - by Type
- 8.2.1. Whole Body
- 8.2.2. Part Body
- 8.1. Market Analysis, Insights and Forecast - by Application
- 9. Middle East & Africa Animal Simulators Analysis, Insights and Forecast, 2020-2032
- 9.1. Market Analysis, Insights and Forecast - by Application
- 9.1.1. Training
- 9.1.2. Treatment
- 9.2. Market Analysis, Insights and Forecast - by Type
- 9.2.1. Whole Body
- 9.2.2. Part Body
- 9.1. Market Analysis, Insights and Forecast - by Application
- 10. Asia Pacific Animal Simulators Analysis, Insights and Forecast, 2020-2032
- 10.1. Market Analysis, Insights and Forecast - by Application
- 10.1.1. Training
- 10.1.2. Treatment
- 10.2. Market Analysis, Insights and Forecast - by Type
- 10.2.1. Whole Body
- 10.2.2. Part Body
- 10.1. Market Analysis, Insights and Forecast - by Application
- 11. Competitive Analysis
- 11.1. Global Market Share Analysis 2025
- 11.2. Company Profiles
- 11.2.1 Veterinary Simulator Industries
- 11.2.1.1. Overview
- 11.2.1.2. Products
- 11.2.1.3. SWOT Analysis
- 11.2.1.4. Recent Developments
- 11.2.1.5. Financials (Based on Availability)
- 11.2.2 TraumaFX
- 11.2.2.1. Overview
- 11.2.2.2. Products
- 11.2.2.3. SWOT Analysis
- 11.2.2.4. Recent Developments
- 11.2.2.5. Financials (Based on Availability)
- 11.2.3 Rescue Critters
- 11.2.3.1. Overview
- 11.2.3.2. Products
- 11.2.3.3. SWOT Analysis
- 11.2.3.4. Recent Developments
- 11.2.3.5. Financials (Based on Availability)
- 11.2.4 Bioseb
- 11.2.4.1. Overview
- 11.2.4.2. Products
- 11.2.4.3. SWOT Analysis
- 11.2.4.4. Recent Developments
- 11.2.4.5. Financials (Based on Availability)
- 11.2.5 Erler Zimmer
- 11.2.5.1. Overview
- 11.2.5.2. Products
- 11.2.5.3. SWOT Analysis
- 11.2.5.4. Recent Developments
- 11.2.5.5. Financials (Based on Availability)
- 11.2.1 Veterinary Simulator Industries
List of Figures
- Figure 1: Global Animal Simulators Revenue Breakdown (million, %) by Region 2025 & 2033
- Figure 2: North America Animal Simulators Revenue (million), by Application 2025 & 2033
- Figure 3: North America Animal Simulators Revenue Share (%), by Application 2025 & 2033
- Figure 4: North America Animal Simulators Revenue (million), by Type 2025 & 2033
- Figure 5: North America Animal Simulators Revenue Share (%), by Type 2025 & 2033
- Figure 6: North America Animal Simulators Revenue (million), by Country 2025 & 2033
- Figure 7: North America Animal Simulators Revenue Share (%), by Country 2025 & 2033
- Figure 8: South America Animal Simulators Revenue (million), by Application 2025 & 2033
- Figure 9: South America Animal Simulators Revenue Share (%), by Application 2025 & 2033
- Figure 10: South America Animal Simulators Revenue (million), by Type 2025 & 2033
- Figure 11: South America Animal Simulators Revenue Share (%), by Type 2025 & 2033
- Figure 12: South America Animal Simulators Revenue (million), by Country 2025 & 2033
- Figure 13: South America Animal Simulators Revenue Share (%), by Country 2025 & 2033
- Figure 14: Europe Animal Simulators Revenue (million), by Application 2025 & 2033
- Figure 15: Europe Animal Simulators Revenue Share (%), by Application 2025 & 2033
- Figure 16: Europe Animal Simulators Revenue (million), by Type 2025 & 2033
- Figure 17: Europe Animal Simulators Revenue Share (%), by Type 2025 & 2033
- Figure 18: Europe Animal Simulators Revenue (million), by Country 2025 & 2033
- Figure 19: Europe Animal Simulators Revenue Share (%), by Country 2025 & 2033
- Figure 20: Middle East & Africa Animal Simulators Revenue (million), by Application 2025 & 2033
- Figure 21: Middle East & Africa Animal Simulators Revenue Share (%), by Application 2025 & 2033
- Figure 22: Middle East & Africa Animal Simulators Revenue (million), by Type 2025 & 2033
- Figure 23: Middle East & Africa Animal Simulators Revenue Share (%), by Type 2025 & 2033
- Figure 24: Middle East & Africa Animal Simulators Revenue (million), by Country 2025 & 2033
- Figure 25: Middle East & Africa Animal Simulators Revenue Share (%), by Country 2025 & 2033
- Figure 26: Asia Pacific Animal Simulators Revenue (million), by Application 2025 & 2033
- Figure 27: Asia Pacific Animal Simulators Revenue Share (%), by Application 2025 & 2033
- Figure 28: Asia Pacific Animal Simulators Revenue (million), by Type 2025 & 2033
- Figure 29: Asia Pacific Animal Simulators Revenue Share (%), by Type 2025 & 2033
- Figure 30: Asia Pacific Animal Simulators Revenue (million), by Country 2025 & 2033
- Figure 31: Asia Pacific Animal Simulators Revenue Share (%), by Country 2025 & 2033
List of Tables
- Table 1: Global Animal Simulators Revenue million Forecast, by Application 2020 & 2033
- Table 2: Global Animal Simulators Revenue million Forecast, by Type 2020 & 2033
- Table 3: Global Animal Simulators Revenue million Forecast, by Region 2020 & 2033
- Table 4: Global Animal Simulators Revenue million Forecast, by Application 2020 & 2033
- Table 5: Global Animal Simulators Revenue million Forecast, by Type 2020 & 2033
- Table 6: Global Animal Simulators Revenue million Forecast, by Country 2020 & 2033
- Table 7: United States Animal Simulators Revenue (million) Forecast, by Application 2020 & 2033
- Table 8: Canada Animal Simulators Revenue (million) Forecast, by Application 2020 & 2033
- Table 9: Mexico Animal Simulators Revenue (million) Forecast, by Application 2020 & 2033
- Table 10: Global Animal Simulators Revenue million Forecast, by Application 2020 & 2033
- Table 11: Global Animal Simulators Revenue million Forecast, by Type 2020 & 2033
- Table 12: Global Animal Simulators Revenue million Forecast, by Country 2020 & 2033
- Table 13: Brazil Animal Simulators Revenue (million) Forecast, by Application 2020 & 2033
- Table 14: Argentina Animal Simulators Revenue (million) Forecast, by Application 2020 & 2033
- Table 15: Rest of South America Animal Simulators Revenue (million) Forecast, by Application 2020 & 2033
- Table 16: Global Animal Simulators Revenue million Forecast, by Application 2020 & 2033
- Table 17: Global Animal Simulators Revenue million Forecast, by Type 2020 & 2033
- Table 18: Global Animal Simulators Revenue million Forecast, by Country 2020 & 2033
- Table 19: United Kingdom Animal Simulators Revenue (million) Forecast, by Application 2020 & 2033
- Table 20: Germany Animal Simulators Revenue (million) Forecast, by Application 2020 & 2033
- Table 21: France Animal Simulators Revenue (million) Forecast, by Application 2020 & 2033
- Table 22: Italy Animal Simulators Revenue (million) Forecast, by Application 2020 & 2033
- Table 23: Spain Animal Simulators Revenue (million) Forecast, by Application 2020 & 2033
- Table 24: Russia Animal Simulators Revenue (million) Forecast, by Application 2020 & 2033
- Table 25: Benelux Animal Simulators Revenue (million) Forecast, by Application 2020 & 2033
- Table 26: Nordics Animal Simulators Revenue (million) Forecast, by Application 2020 & 2033
- Table 27: Rest of Europe Animal Simulators Revenue (million) Forecast, by Application 2020 & 2033
- Table 28: Global Animal Simulators Revenue million Forecast, by Application 2020 & 2033
- Table 29: Global Animal Simulators Revenue million Forecast, by Type 2020 & 2033
- Table 30: Global Animal Simulators Revenue million Forecast, by Country 2020 & 2033
- Table 31: Turkey Animal Simulators Revenue (million) Forecast, by Application 2020 & 2033
- Table 32: Israel Animal Simulators Revenue (million) Forecast, by Application 2020 & 2033
- Table 33: GCC Animal Simulators Revenue (million) Forecast, by Application 2020 & 2033
- Table 34: North Africa Animal Simulators Revenue (million) Forecast, by Application 2020 & 2033
- Table 35: South Africa Animal Simulators Revenue (million) Forecast, by Application 2020 & 2033
- Table 36: Rest of Middle East & Africa Animal Simulators Revenue (million) Forecast, by Application 2020 & 2033
- Table 37: Global Animal Simulators Revenue million Forecast, by Application 2020 & 2033
- Table 38: Global Animal Simulators Revenue million Forecast, by Type 2020 & 2033
- Table 39: Global Animal Simulators Revenue million Forecast, by Country 2020 & 2033
- Table 40: China Animal Simulators Revenue (million) Forecast, by Application 2020 & 2033
- Table 41: India Animal Simulators Revenue (million) Forecast, by Application 2020 & 2033
- Table 42: Japan Animal Simulators Revenue (million) Forecast, by Application 2020 & 2033
- Table 43: South Korea Animal Simulators Revenue (million) Forecast, by Application 2020 & 2033
- Table 44: ASEAN Animal Simulators Revenue (million) Forecast, by Application 2020 & 2033
- Table 45: Oceania Animal Simulators Revenue (million) Forecast, by Application 2020 & 2033
- Table 46: Rest of Asia Pacific Animal Simulators Revenue (million) Forecast, by Application 2020 & 2033
Frequently Asked Questions
1. What is the projected Compound Annual Growth Rate (CAGR) of the Animal Simulators?
The projected CAGR is approximately XXX%.
2. Which companies are prominent players in the Animal Simulators?
Key companies in the market include Veterinary Simulator Industries, TraumaFX, Rescue Critters, Bioseb, Erler Zimmer.
3. What are the main segments of the Animal Simulators?
The market segments include Application, Type.
4. Can you provide details about the market size?
The market size is estimated to be USD XXX million as of 2022.
5. What are some drivers contributing to market growth?
N/A
6. What are the notable trends driving market growth?
N/A
7. Are there any restraints impacting market growth?
N/A
8. Can you provide examples of recent developments in the market?
N/A
9. What pricing options are available for accessing the report?
Pricing options include single-user, multi-user, and enterprise licenses priced at USD 4250.00, USD 6375.00, and USD 8500.00 respectively.
10. Is the market size provided in terms of value or volume?
The market size is provided in terms of value, measured in million.
11. Are there any specific market keywords associated with the report?
Yes, the market keyword associated with the report is "Animal Simulators," which aids in identifying and referencing the specific market segment covered.
12. How do I determine which pricing option suits my needs best?
The pricing options vary based on user requirements and access needs. Individual users may opt for single-user licenses, while businesses requiring broader access may choose multi-user or enterprise licenses for cost-effective access to the report.
13. Are there any additional resources or data provided in the Animal Simulators report?
While the report offers comprehensive insights, it's advisable to review the specific contents or supplementary materials provided to ascertain if additional resources or data are available.
14. How can I stay updated on further developments or reports in the Animal Simulators?
To stay informed about further developments, trends, and reports in the Animal Simulators, consider subscribing to industry newsletters, following relevant companies and organizations, or regularly checking reputable industry news sources and publications.
Methodology
Step 1 - Identification of Relevant Samples Size from Population Database


Step 2 - Approaches for Defining Global Market Size (Value, Volume* & Price*)

Note*: In applicable scenarios
Step 3 - Data Sources
Primary Research
- Web Analytics
- Survey Reports
- Research Institute
- Latest Research Reports
- Opinion Leaders
Secondary Research
- Annual Reports
- White Paper
- Latest Press Release
- Industry Association
- Paid Database
- Investor Presentations

Step 4 - Data Triangulation
Involves using different sources of information in order to increase the validity of a study
These sources are likely to be stakeholders in a program - participants, other researchers, program staff, other community members, and so on.
Then we put all data in single framework & apply various statistical tools to find out the dynamic on the market.
During the analysis stage, feedback from the stakeholder groups would be compared to determine areas of agreement as well as areas of divergence