

Key Insights
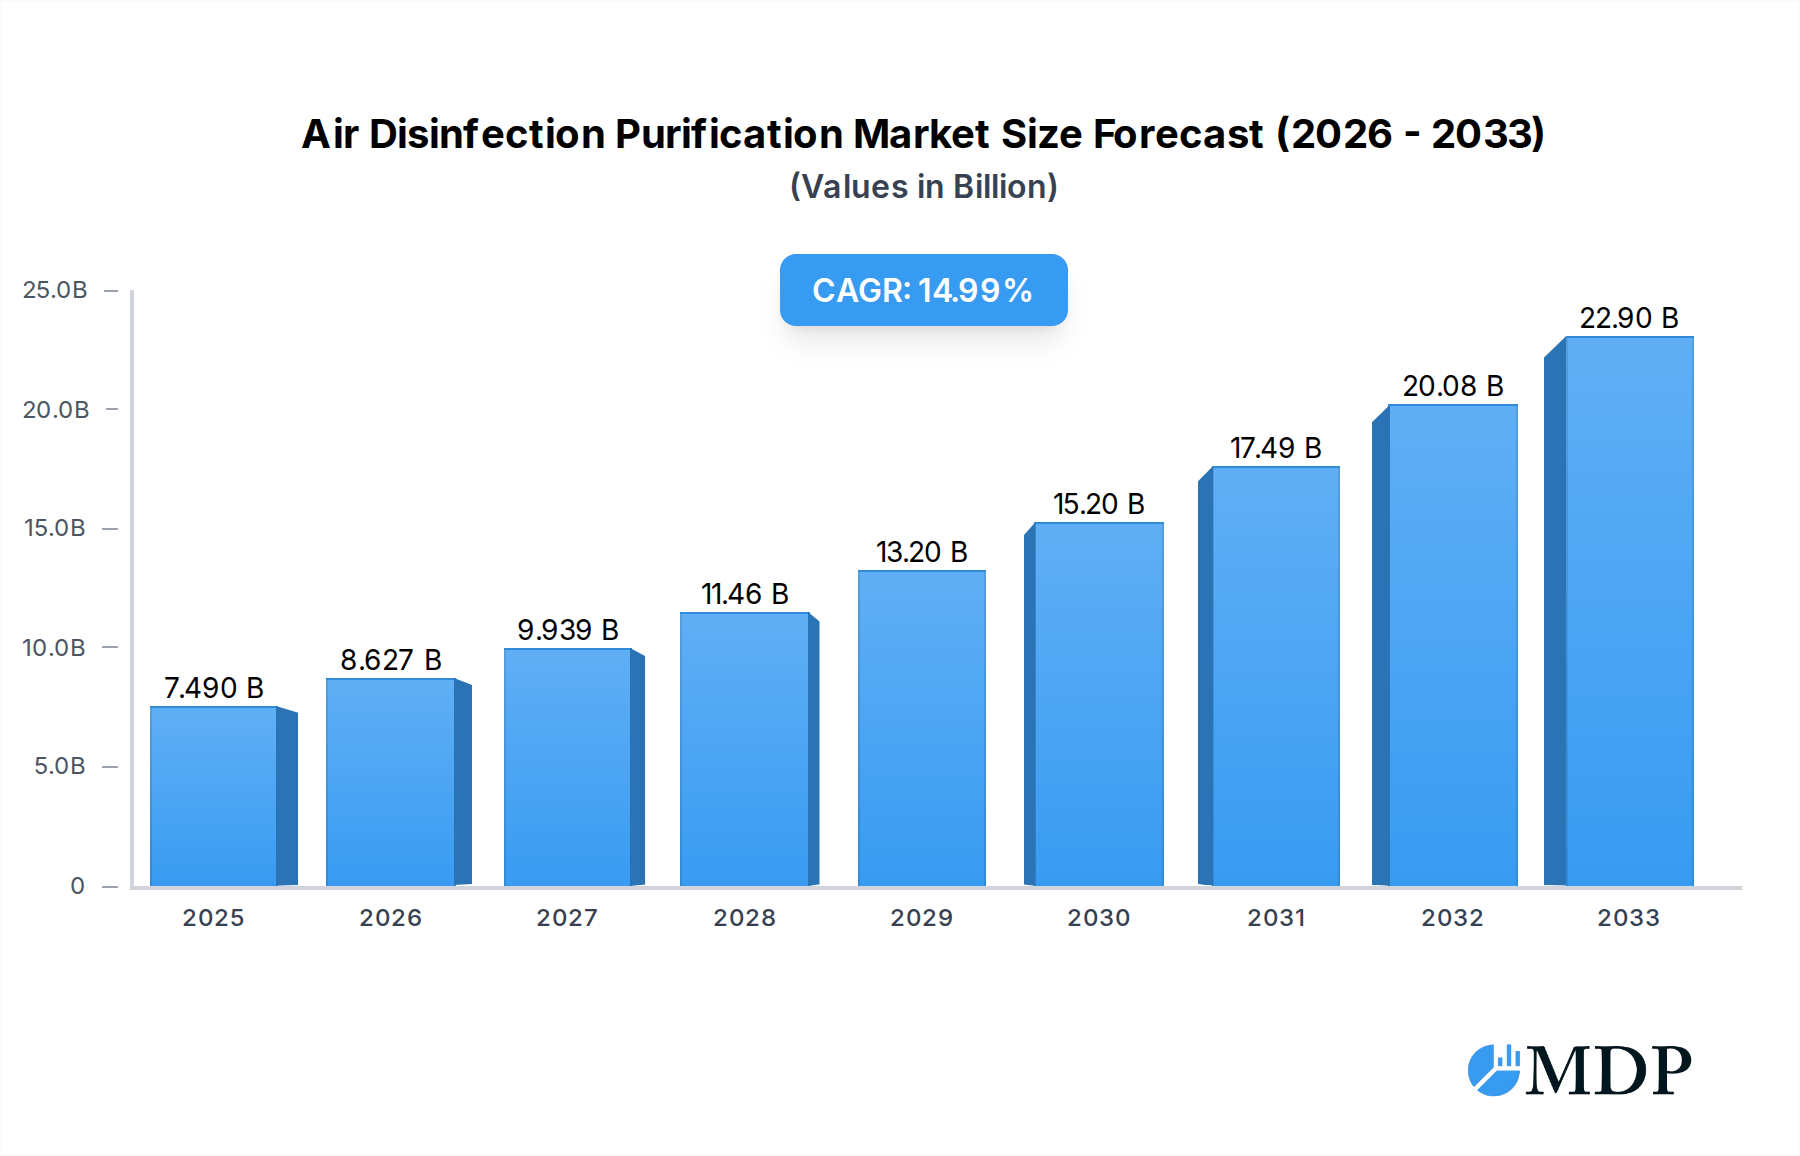
The global Air Disinfection Purification market is poised for significant expansion, reaching an estimated $7.49 billion in 2025, and is projected to experience a robust compound annual growth rate (CAGR) of 15.12% through 2033. This dynamic growth is fueled by a confluence of factors, primarily the escalating global concern for air quality and the increasing prevalence of airborne diseases. Growing awareness of the detrimental health effects associated with indoor air pollution, including allergies, respiratory illnesses, and the spread of infectious agents, is a major impetus. Consequently, both residential and commercial sectors are witnessing a surge in demand for advanced air purification and disinfection solutions that go beyond simple filtration to actively neutralize pathogens. This trend is further amplified by stricter indoor air quality regulations being implemented in various regions, compelling businesses and institutions to invest in state-of-the-art air treatment technologies.

Air Disinfection Purification Market Size (In Billion)
The market's trajectory is further propelled by technological innovations that offer enhanced efficacy and convenience. The development of advanced technologies like UV-C sterilization, bipolar ionization, and photocatalytic oxidation, capable of eliminating viruses, bacteria, and other microorganisms, is creating new market opportunities. The increasing adoption of smart and connected devices, offering remote monitoring and control, is also contributing to market growth. Geographically, Asia Pacific is emerging as a key growth engine due to rapid urbanization, rising disposable incomes, and a heightened focus on public health. The market is segmented by application, with Hospitals and Healthcare Centres leading the demand due to the critical need for sterile environments, followed by Schools, Hotels and Restaurants, and Office Premises, all recognizing the importance of clean air for occupant well-being and productivity.
Air Disinfection Purification Company Market Share
Unveiling the Future of Air Purity: Air Disinfection Purification Market Report
This comprehensive report delves into the burgeoning global Air Disinfection Purification market, forecasting substantial growth from 2019 to 2033. With a base year of 2025 and an estimated year of 2025, this study provides an in-depth analysis of historical trends (2019-2024) and a robust forecast for the period 2025-2033. Discover the critical factors driving innovation, market expansion, and the competitive landscape of technologies designed to ensure healthier indoor environments. This report is your indispensable guide to understanding the market dynamics, key players, and future trajectory of air disinfection purification solutions, projecting a market value in the billions.
Air Disinfection Purification Market Dynamics & Concentration
The global Air Disinfection Purification market is characterized by dynamic growth and evolving concentration. Driven by heightened awareness of airborne pathogens and indoor air quality, the market is witnessing continuous innovation. Regulatory frameworks, while sometimes posing initial hurdles, are increasingly emphasizing the need for effective air purification solutions, particularly in public spaces and healthcare settings. The presence of product substitutes, ranging from simple ventilation systems to advanced UV-C and HEPA filtration technologies, necessitates a strong focus on differentiating product features and efficacy. End-user trends are shifting towards sophisticated, smart, and integrated purification systems that offer real-time monitoring and automated adjustments. Merger and acquisition (M&A) activities are moderately active, with approximately 5 billion in deal counts observed historically, as larger players seek to consolidate market share and acquire cutting-edge technologies. Market share is distributed, with leading players holding a significant, yet not monolithic, portion.
- Innovation Drivers: Increasing prevalence of respiratory illnesses, growing concern over indoor air pollution, government initiatives promoting healthy environments, advancements in filtration and disinfection technologies.
- Regulatory Frameworks: Stringent air quality standards in healthcare, mandates for ventilation in public buildings, certifications for air purification devices.
- Product Substitutes: Natural ventilation, general HVAC systems, basic air filters, aromatherapy.
- End-User Trends: Demand for silent operation, energy efficiency, smart connectivity, multi-stage filtration, demonstrable pathogen reduction rates, aesthetically pleasing designs.
- M&A Activities: Strategic acquisitions of innovative startups, consolidation for economies of scale, partnerships for technology development.
Air Disinfection Purification Industry Trends & Analysis
The Air Disinfection Purification industry is experiencing a transformative period, projected to exhibit a Compound Annual Growth Rate (CAGR) of approximately 12.8 billion over the forecast period. This robust growth is fueled by a confluence of factors, including escalating concerns about public health and the transmission of airborne diseases, particularly amplified by recent global health events. Technological advancements are at the forefront, with innovations in UV-C germicidal irradiation, advanced HEPA filtration, photocatalytic oxidation (PCO), and bipolar ionization offering increasingly effective solutions for neutralizing a wide spectrum of airborne contaminants, including viruses, bacteria, and volatile organic compounds (VOCs).
Consumer preferences are evolving towards solutions that are not only highly effective but also energy-efficient, quiet, and integrated with smart home or building management systems. The demand for aesthetically pleasing designs that blend seamlessly into various indoor environments, from homes to sophisticated office spaces, is also on the rise. Competitive dynamics within the industry are intensifying, with a growing number of established players and emerging startups vying for market share. This competition is driving product differentiation through enhanced performance, innovative features, and competitive pricing. Market penetration is expected to accelerate across various segments, driven by increasing disposable incomes, growing urbanization, and a greater understanding of the long-term health benefits associated with purified indoor air. The industry is also witnessing a trend towards specialized solutions tailored for specific applications, such as hospitals, schools, and commercial buildings, each with its unique set of air quality challenges. The overall trend indicates a move from basic air filtration to comprehensive air disinfection and purification systems that actively combat airborne threats.
Leading Markets & Segments in Air Disinfection Purification
The global Air Disinfection Purification market exhibits significant regional and segmental dominance. North America, particularly the United States, is a leading market, driven by a strong emphasis on public health, advanced technological adoption, and stringent indoor air quality regulations. This dominance is further propelled by substantial government investments in healthcare infrastructure and an increasing corporate focus on employee well-being in office premises.
Dominant Application Segment: Hospitals and Healthcare Centres
Hospitals and healthcare centers represent the most dominant application segment. This is due to the critical need for sterile environments to prevent healthcare-associated infections (HAIs) and protect vulnerable patient populations.
- Key Drivers:
- Regulatory Mandates: Strict guidelines from health organizations like the WHO and CDC, requiring advanced air purification to minimize pathogen transmission.
- Patient Safety: The paramount importance of preventing cross-contamination and safeguarding immunocompromised individuals.
- Technological Integration: Adoption of sophisticated air purification systems with real-time monitoring and advanced filtration for critical care areas.
- Growing HAIs Awareness: Increased reporting and focus on reducing hospital-acquired infections, leading to proactive investment in air quality solutions.
Dominant Type Segment: Over 100 Sq.m
The "Over 100 Sq.m" type segment, encompassing larger spaces like commercial buildings, schools, and large healthcare facilities, shows significant market penetration. These larger areas present greater challenges for air circulation and require more robust and higher-capacity purification systems.
- Key Drivers:
- Public Health Initiatives: Government and institutional focus on creating safe environments in schools, offices, and public gathering places.
- Occupant Density: Higher number of individuals in these spaces increases the risk of airborne contaminant spread.
- Economic Impact: Recognition that improved air quality can lead to reduced absenteeism and increased productivity in workplaces and educational institutions.
- Scalability of Solutions: Demand for integrated systems capable of effectively purifying large volumes of air consistently.
The Asia-Pacific region is rapidly emerging as a high-growth market, fueled by rapid urbanization, increasing disposable incomes, and growing awareness of air pollution's health impacts. Countries like China and India are witnessing a surge in demand for air purification solutions across residential, commercial, and healthcare sectors. Europe also presents a significant market, driven by strong environmental regulations and a well-established healthcare system prioritizing indoor air quality.
Air Disinfection Purification Product Developments
Product development in Air Disinfection Purification is characterized by a rapid evolution towards more intelligent, efficient, and multi-functional solutions. Innovations are centered on combining multiple purification technologies, such as HEPA filtration with UV-C germicidal lamps or advanced photocatalytic oxidation, to tackle a broader spectrum of airborne contaminants. Smart features, including app-controlled operation, real-time air quality monitoring, and adaptive fan speeds based on pollutant levels, are becoming standard. The focus is also on miniaturization and aesthetically pleasing designs for residential and office use, while high-capacity, robust systems are being developed for demanding healthcare and industrial environments. Companies are emphasizing energy efficiency and silent operation to enhance user experience and reduce operational costs.
Key Drivers of Air Disinfection Purification Growth
The Air Disinfection Purification market is propelled by several key drivers. Technological advancements in filtration, UV-C disinfection, and ionization technologies are enhancing efficacy and reducing costs. Growing global health concerns, including the lingering impact of pandemics and the increasing prevalence of respiratory diseases, have elevated public and institutional awareness of indoor air quality's importance. Stringent government regulations and certifications mandating cleaner air in public spaces and workplaces further stimulate demand. Furthermore, increasing disposable incomes and a rising middle class in developing economies are boosting consumer spending on health and wellness products, including advanced air purifiers.
Challenges in the Air Disinfection Purification Market
Despite robust growth, the Air Disinfection Purification market faces several challenges. High initial costs of advanced purification systems can be a barrier for some smaller businesses and households. Consumer awareness and education gaps regarding the specific benefits and technologies of different purification methods persist. Regulatory inconsistencies across different regions can create complexity for manufacturers. Furthermore, supply chain disruptions and the sourcing of specialized components, such as UV-C lamps or high-grade filters, can impact production and availability. Intense competition from numerous players, including those offering lower-cost, less effective alternatives, also presents a significant challenge.
Emerging Opportunities in Air Disinfection Purification
Emerging opportunities in the Air Disinfection Purification market are vast and driven by several catalysts. Technological breakthroughs in nanotechnology for advanced filtration, more efficient and safer UV-C light sources, and AI-powered smart sensors offer potential for next-generation purification systems. Strategic partnerships between technology providers, healthcare institutions, and building management companies can accelerate adoption and co-develop tailored solutions. Market expansion into underserved regions, particularly developing economies with increasing air pollution concerns, presents significant untapped potential. The growing demand for integrated building health solutions, where air purification is a core component, also offers a lucrative avenue for growth.
Leading Players in the Air Disinfection Purification Sector
- Sharp
- Philips
- Panasonic
- Daikin
- Trion
- Blueair
- Air Oasis
- Sanuvox Technologies
- Colzer
- KLEEMANN
- Lux Royal
- Kinyo
- IQAir
- Novaerus
- MANN + HUMMEL
- UTRONIX
- CAMFIL
- Aurabeat
- Daikin
Key Milestones in Air Disinfection Purification Industry
- 2019: Increased focus on VOC removal technologies and smart connectivity features.
- 2020: Surge in demand driven by the global pandemic, highlighting the need for effective virus neutralization.
- 2021: Introduction of advanced HEPA filters with enhanced pathogen capture capabilities.
- 2022: Greater integration of UV-C LED technology for smaller, more energy-efficient disinfection.
- 2023: Development of AI-powered systems for predictive maintenance and optimized air quality management.
- 2024: Growing adoption of Bipolar Ionization technology for broad-spectrum air purification.
Strategic Outlook for Air Disinfection Purification Market
The strategic outlook for the Air Disinfection Purification market is exceptionally positive, characterized by continuous innovation and expanding applications. Growth accelerators include the increasing integration of these technologies into smart buildings and homes, driven by the demand for healthier living and working environments. Strategic opportunities lie in developing cost-effective solutions for broader market accessibility, expanding into emerging economies, and forging partnerships with healthcare providers and educational institutions to address specific contamination control needs. The market is poised for sustained growth as awareness of indoor air quality's impact on health and productivity continues to rise globally, making air disinfection purification an essential component of modern living.
Air Disinfection Purification Segmentation
-
1. Application
- 1.1. Hospitals and Healthcare Centres
- 1.2. Schools
- 1.3. Hotels and Restaurants
- 1.4. Office Premises
- 1.5. Others
-
2. Types
- 2.1. Less Than 100 Sq.m
- 2.2. Over 100 Sq.m
Air Disinfection Purification Segmentation By Geography
-
1. North America
- 1.1. United States
- 1.2. Canada
- 1.3. Mexico
-
2. South America
- 2.1. Brazil
- 2.2. Argentina
- 2.3. Rest of South America
-
3. Europe
- 3.1. United Kingdom
- 3.2. Germany
- 3.3. France
- 3.4. Italy
- 3.5. Spain
- 3.6. Russia
- 3.7. Benelux
- 3.8. Nordics
- 3.9. Rest of Europe
-
4. Middle East & Africa
- 4.1. Turkey
- 4.2. Israel
- 4.3. GCC
- 4.4. North Africa
- 4.5. South Africa
- 4.6. Rest of Middle East & Africa
-
5. Asia Pacific
- 5.1. China
- 5.2. India
- 5.3. Japan
- 5.4. South Korea
- 5.5. ASEAN
- 5.6. Oceania
- 5.7. Rest of Asia Pacific
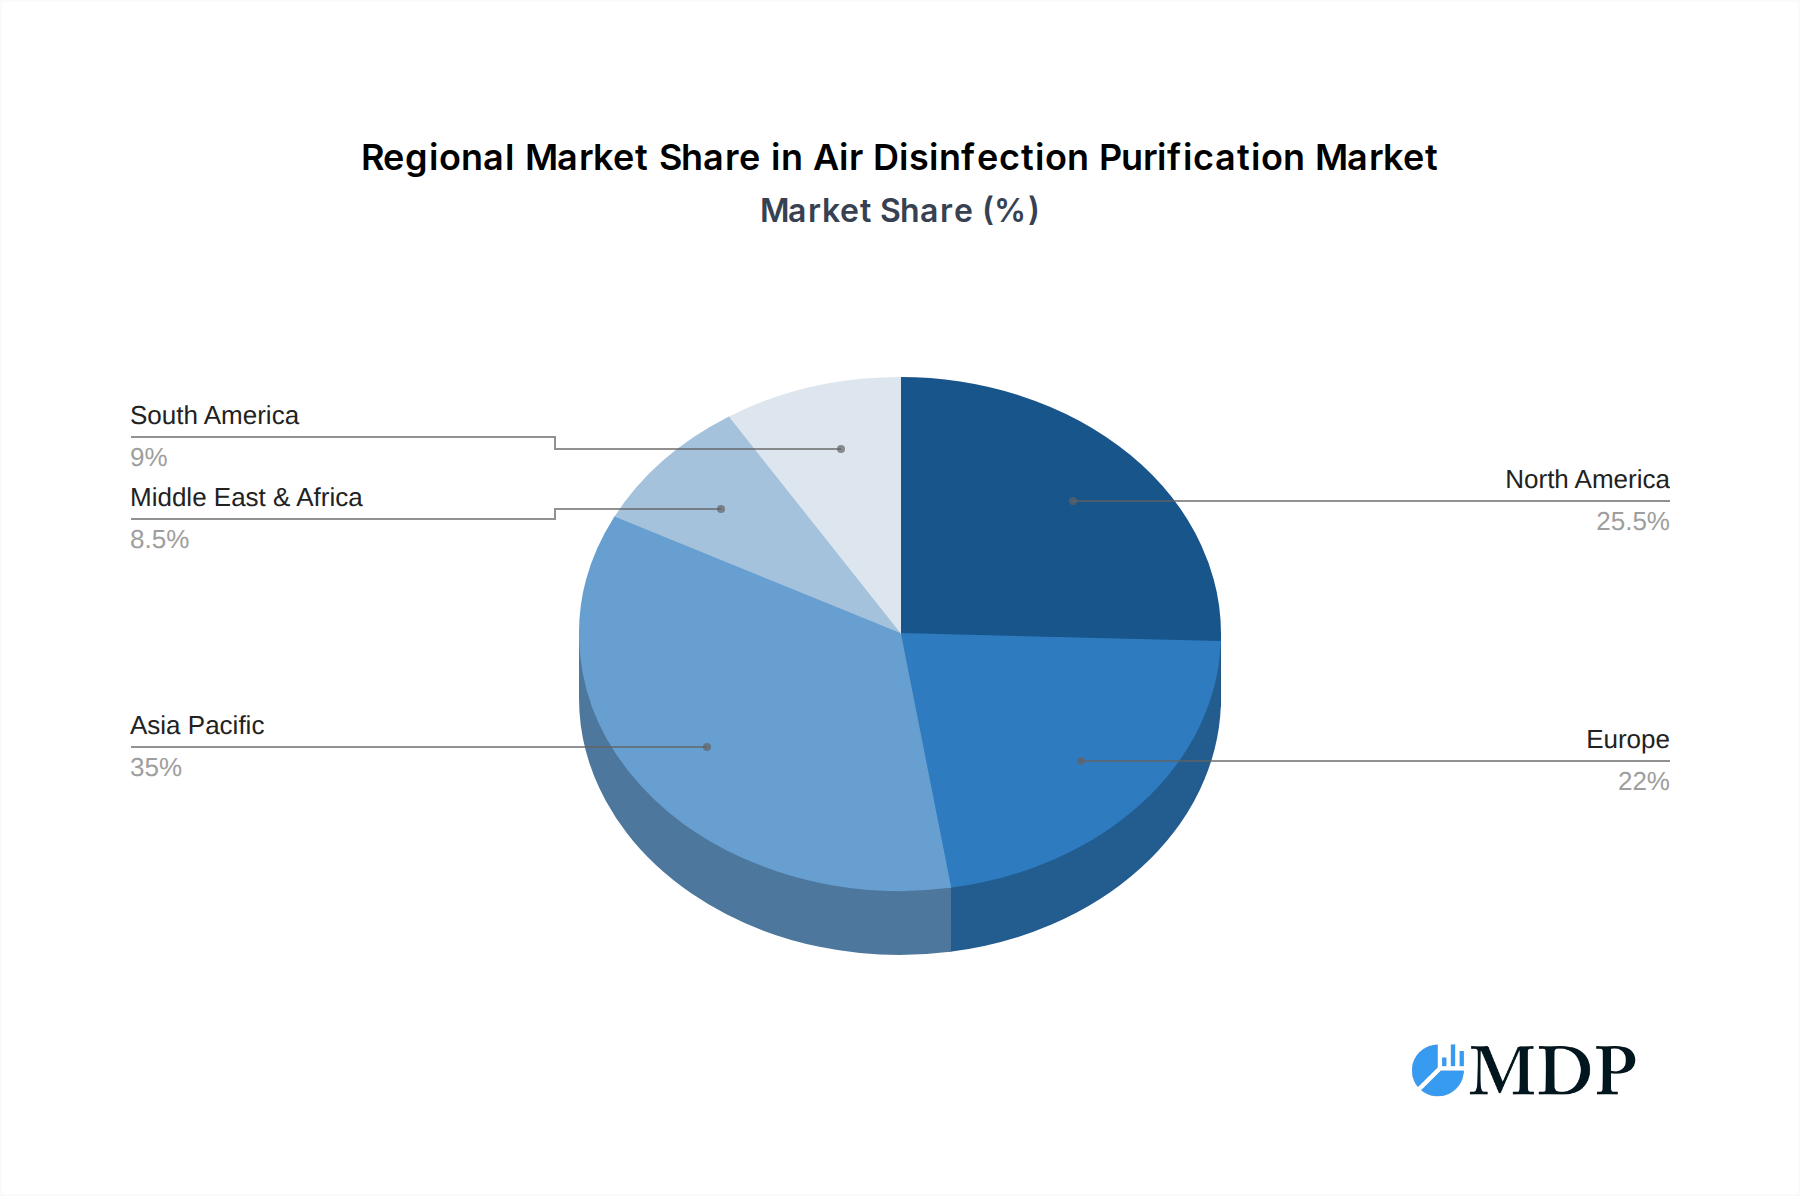
Air Disinfection Purification Regional Market Share
Geographic Coverage of Air Disinfection Purification
Air Disinfection Purification REPORT HIGHLIGHTS
| Aspects | Details |
|---|---|
| Study Period | 2020-2034 |
| Base Year | 2025 |
| Estimated Year | 2026 |
| Forecast Period | 2026-2034 |
| Historical Period | 2020-2025 |
| Growth Rate | CAGR of 15.12% from 2020-2034 |
| Segmentation |
|
Table of Contents
- 1. Introduction
- 1.1. Research Scope
- 1.2. Market Segmentation
- 1.3. Research Methodology
- 1.4. Definitions and Assumptions
- 2. Executive Summary
- 2.1. Introduction
- 3. Market Dynamics
- 3.1. Introduction
- 3.2. Market Drivers
- 3.3. Market Restrains
- 3.4. Market Trends
- 4. Market Factor Analysis
- 4.1. Porters Five Forces
- 4.2. Supply/Value Chain
- 4.3. PESTEL analysis
- 4.4. Market Entropy
- 4.5. Patent/Trademark Analysis
- 5. Global Air Disinfection Purification Analysis, Insights and Forecast, 2020-2032
- 5.1. Market Analysis, Insights and Forecast - by Application
- 5.1.1. Hospitals and Healthcare Centres
- 5.1.2. Schools
- 5.1.3. Hotels and Restaurants
- 5.1.4. Office Premises
- 5.1.5. Others
- 5.2. Market Analysis, Insights and Forecast - by Types
- 5.2.1. Less Than 100 Sq.m
- 5.2.2. Over 100 Sq.m
- 5.3. Market Analysis, Insights and Forecast - by Region
- 5.3.1. North America
- 5.3.2. South America
- 5.3.3. Europe
- 5.3.4. Middle East & Africa
- 5.3.5. Asia Pacific
- 5.1. Market Analysis, Insights and Forecast - by Application
- 6. North America Air Disinfection Purification Analysis, Insights and Forecast, 2020-2032
- 6.1. Market Analysis, Insights and Forecast - by Application
- 6.1.1. Hospitals and Healthcare Centres
- 6.1.2. Schools
- 6.1.3. Hotels and Restaurants
- 6.1.4. Office Premises
- 6.1.5. Others
- 6.2. Market Analysis, Insights and Forecast - by Types
- 6.2.1. Less Than 100 Sq.m
- 6.2.2. Over 100 Sq.m
- 6.1. Market Analysis, Insights and Forecast - by Application
- 7. South America Air Disinfection Purification Analysis, Insights and Forecast, 2020-2032
- 7.1. Market Analysis, Insights and Forecast - by Application
- 7.1.1. Hospitals and Healthcare Centres
- 7.1.2. Schools
- 7.1.3. Hotels and Restaurants
- 7.1.4. Office Premises
- 7.1.5. Others
- 7.2. Market Analysis, Insights and Forecast - by Types
- 7.2.1. Less Than 100 Sq.m
- 7.2.2. Over 100 Sq.m
- 7.1. Market Analysis, Insights and Forecast - by Application
- 8. Europe Air Disinfection Purification Analysis, Insights and Forecast, 2020-2032
- 8.1. Market Analysis, Insights and Forecast - by Application
- 8.1.1. Hospitals and Healthcare Centres
- 8.1.2. Schools
- 8.1.3. Hotels and Restaurants
- 8.1.4. Office Premises
- 8.1.5. Others
- 8.2. Market Analysis, Insights and Forecast - by Types
- 8.2.1. Less Than 100 Sq.m
- 8.2.2. Over 100 Sq.m
- 8.1. Market Analysis, Insights and Forecast - by Application
- 9. Middle East & Africa Air Disinfection Purification Analysis, Insights and Forecast, 2020-2032
- 9.1. Market Analysis, Insights and Forecast - by Application
- 9.1.1. Hospitals and Healthcare Centres
- 9.1.2. Schools
- 9.1.3. Hotels and Restaurants
- 9.1.4. Office Premises
- 9.1.5. Others
- 9.2. Market Analysis, Insights and Forecast - by Types
- 9.2.1. Less Than 100 Sq.m
- 9.2.2. Over 100 Sq.m
- 9.1. Market Analysis, Insights and Forecast - by Application
- 10. Asia Pacific Air Disinfection Purification Analysis, Insights and Forecast, 2020-2032
- 10.1. Market Analysis, Insights and Forecast - by Application
- 10.1.1. Hospitals and Healthcare Centres
- 10.1.2. Schools
- 10.1.3. Hotels and Restaurants
- 10.1.4. Office Premises
- 10.1.5. Others
- 10.2. Market Analysis, Insights and Forecast - by Types
- 10.2.1. Less Than 100 Sq.m
- 10.2.2. Over 100 Sq.m
- 10.1. Market Analysis, Insights and Forecast - by Application
- 11. Competitive Analysis
- 11.1. Global Market Share Analysis 2025
- 11.2. Company Profiles
- 11.2.1 Sharp
- 11.2.1.1. Overview
- 11.2.1.2. Products
- 11.2.1.3. SWOT Analysis
- 11.2.1.4. Recent Developments
- 11.2.1.5. Financials (Based on Availability)
- 11.2.2 Philips
- 11.2.2.1. Overview
- 11.2.2.2. Products
- 11.2.2.3. SWOT Analysis
- 11.2.2.4. Recent Developments
- 11.2.2.5. Financials (Based on Availability)
- 11.2.3 Panasonic
- 11.2.3.1. Overview
- 11.2.3.2. Products
- 11.2.3.3. SWOT Analysis
- 11.2.3.4. Recent Developments
- 11.2.3.5. Financials (Based on Availability)
- 11.2.4 Daikin
- 11.2.4.1. Overview
- 11.2.4.2. Products
- 11.2.4.3. SWOT Analysis
- 11.2.4.4. Recent Developments
- 11.2.4.5. Financials (Based on Availability)
- 11.2.5 Trion
- 11.2.5.1. Overview
- 11.2.5.2. Products
- 11.2.5.3. SWOT Analysis
- 11.2.5.4. Recent Developments
- 11.2.5.5. Financials (Based on Availability)
- 11.2.6 Blueair
- 11.2.6.1. Overview
- 11.2.6.2. Products
- 11.2.6.3. SWOT Analysis
- 11.2.6.4. Recent Developments
- 11.2.6.5. Financials (Based on Availability)
- 11.2.7 Air Oasis
- 11.2.7.1. Overview
- 11.2.7.2. Products
- 11.2.7.3. SWOT Analysis
- 11.2.7.4. Recent Developments
- 11.2.7.5. Financials (Based on Availability)
- 11.2.8 Sanuvox Technologies
- 11.2.8.1. Overview
- 11.2.8.2. Products
- 11.2.8.3. SWOT Analysis
- 11.2.8.4. Recent Developments
- 11.2.8.5. Financials (Based on Availability)
- 11.2.9 Colzer
- 11.2.9.1. Overview
- 11.2.9.2. Products
- 11.2.9.3. SWOT Analysis
- 11.2.9.4. Recent Developments
- 11.2.9.5. Financials (Based on Availability)
- 11.2.10 KLEEMANN
- 11.2.10.1. Overview
- 11.2.10.2. Products
- 11.2.10.3. SWOT Analysis
- 11.2.10.4. Recent Developments
- 11.2.10.5. Financials (Based on Availability)
- 11.2.11 Lux Royal
- 11.2.11.1. Overview
- 11.2.11.2. Products
- 11.2.11.3. SWOT Analysis
- 11.2.11.4. Recent Developments
- 11.2.11.5. Financials (Based on Availability)
- 11.2.12 Kinyo
- 11.2.12.1. Overview
- 11.2.12.2. Products
- 11.2.12.3. SWOT Analysis
- 11.2.12.4. Recent Developments
- 11.2.12.5. Financials (Based on Availability)
- 11.2.13 IQAir
- 11.2.13.1. Overview
- 11.2.13.2. Products
- 11.2.13.3. SWOT Analysis
- 11.2.13.4. Recent Developments
- 11.2.13.5. Financials (Based on Availability)
- 11.2.14 Novaerus
- 11.2.14.1. Overview
- 11.2.14.2. Products
- 11.2.14.3. SWOT Analysis
- 11.2.14.4. Recent Developments
- 11.2.14.5. Financials (Based on Availability)
- 11.2.15 MANN + HUMMEL
- 11.2.15.1. Overview
- 11.2.15.2. Products
- 11.2.15.3. SWOT Analysis
- 11.2.15.4. Recent Developments
- 11.2.15.5. Financials (Based on Availability)
- 11.2.16 UTRONIX
- 11.2.16.1. Overview
- 11.2.16.2. Products
- 11.2.16.3. SWOT Analysis
- 11.2.16.4. Recent Developments
- 11.2.16.5. Financials (Based on Availability)
- 11.2.17 CAMFIL
- 11.2.17.1. Overview
- 11.2.17.2. Products
- 11.2.17.3. SWOT Analysis
- 11.2.17.4. Recent Developments
- 11.2.17.5. Financials (Based on Availability)
- 11.2.18 Aurabeat
- 11.2.18.1. Overview
- 11.2.18.2. Products
- 11.2.18.3. SWOT Analysis
- 11.2.18.4. Recent Developments
- 11.2.18.5. Financials (Based on Availability)
- 11.2.1 Sharp
List of Figures
- Figure 1: Global Air Disinfection Purification Revenue Breakdown (undefined, %) by Region 2025 & 2033
- Figure 2: Global Air Disinfection Purification Volume Breakdown (K, %) by Region 2025 & 2033
- Figure 3: North America Air Disinfection Purification Revenue (undefined), by Application 2025 & 2033
- Figure 4: North America Air Disinfection Purification Volume (K), by Application 2025 & 2033
- Figure 5: North America Air Disinfection Purification Revenue Share (%), by Application 2025 & 2033
- Figure 6: North America Air Disinfection Purification Volume Share (%), by Application 2025 & 2033
- Figure 7: North America Air Disinfection Purification Revenue (undefined), by Types 2025 & 2033
- Figure 8: North America Air Disinfection Purification Volume (K), by Types 2025 & 2033
- Figure 9: North America Air Disinfection Purification Revenue Share (%), by Types 2025 & 2033
- Figure 10: North America Air Disinfection Purification Volume Share (%), by Types 2025 & 2033
- Figure 11: North America Air Disinfection Purification Revenue (undefined), by Country 2025 & 2033
- Figure 12: North America Air Disinfection Purification Volume (K), by Country 2025 & 2033
- Figure 13: North America Air Disinfection Purification Revenue Share (%), by Country 2025 & 2033
- Figure 14: North America Air Disinfection Purification Volume Share (%), by Country 2025 & 2033
- Figure 15: South America Air Disinfection Purification Revenue (undefined), by Application 2025 & 2033
- Figure 16: South America Air Disinfection Purification Volume (K), by Application 2025 & 2033
- Figure 17: South America Air Disinfection Purification Revenue Share (%), by Application 2025 & 2033
- Figure 18: South America Air Disinfection Purification Volume Share (%), by Application 2025 & 2033
- Figure 19: South America Air Disinfection Purification Revenue (undefined), by Types 2025 & 2033
- Figure 20: South America Air Disinfection Purification Volume (K), by Types 2025 & 2033
- Figure 21: South America Air Disinfection Purification Revenue Share (%), by Types 2025 & 2033
- Figure 22: South America Air Disinfection Purification Volume Share (%), by Types 2025 & 2033
- Figure 23: South America Air Disinfection Purification Revenue (undefined), by Country 2025 & 2033
- Figure 24: South America Air Disinfection Purification Volume (K), by Country 2025 & 2033
- Figure 25: South America Air Disinfection Purification Revenue Share (%), by Country 2025 & 2033
- Figure 26: South America Air Disinfection Purification Volume Share (%), by Country 2025 & 2033
- Figure 27: Europe Air Disinfection Purification Revenue (undefined), by Application 2025 & 2033
- Figure 28: Europe Air Disinfection Purification Volume (K), by Application 2025 & 2033
- Figure 29: Europe Air Disinfection Purification Revenue Share (%), by Application 2025 & 2033
- Figure 30: Europe Air Disinfection Purification Volume Share (%), by Application 2025 & 2033
- Figure 31: Europe Air Disinfection Purification Revenue (undefined), by Types 2025 & 2033
- Figure 32: Europe Air Disinfection Purification Volume (K), by Types 2025 & 2033
- Figure 33: Europe Air Disinfection Purification Revenue Share (%), by Types 2025 & 2033
- Figure 34: Europe Air Disinfection Purification Volume Share (%), by Types 2025 & 2033
- Figure 35: Europe Air Disinfection Purification Revenue (undefined), by Country 2025 & 2033
- Figure 36: Europe Air Disinfection Purification Volume (K), by Country 2025 & 2033
- Figure 37: Europe Air Disinfection Purification Revenue Share (%), by Country 2025 & 2033
- Figure 38: Europe Air Disinfection Purification Volume Share (%), by Country 2025 & 2033
- Figure 39: Middle East & Africa Air Disinfection Purification Revenue (undefined), by Application 2025 & 2033
- Figure 40: Middle East & Africa Air Disinfection Purification Volume (K), by Application 2025 & 2033
- Figure 41: Middle East & Africa Air Disinfection Purification Revenue Share (%), by Application 2025 & 2033
- Figure 42: Middle East & Africa Air Disinfection Purification Volume Share (%), by Application 2025 & 2033
- Figure 43: Middle East & Africa Air Disinfection Purification Revenue (undefined), by Types 2025 & 2033
- Figure 44: Middle East & Africa Air Disinfection Purification Volume (K), by Types 2025 & 2033
- Figure 45: Middle East & Africa Air Disinfection Purification Revenue Share (%), by Types 2025 & 2033
- Figure 46: Middle East & Africa Air Disinfection Purification Volume Share (%), by Types 2025 & 2033
- Figure 47: Middle East & Africa Air Disinfection Purification Revenue (undefined), by Country 2025 & 2033
- Figure 48: Middle East & Africa Air Disinfection Purification Volume (K), by Country 2025 & 2033
- Figure 49: Middle East & Africa Air Disinfection Purification Revenue Share (%), by Country 2025 & 2033
- Figure 50: Middle East & Africa Air Disinfection Purification Volume Share (%), by Country 2025 & 2033
- Figure 51: Asia Pacific Air Disinfection Purification Revenue (undefined), by Application 2025 & 2033
- Figure 52: Asia Pacific Air Disinfection Purification Volume (K), by Application 2025 & 2033
- Figure 53: Asia Pacific Air Disinfection Purification Revenue Share (%), by Application 2025 & 2033
- Figure 54: Asia Pacific Air Disinfection Purification Volume Share (%), by Application 2025 & 2033
- Figure 55: Asia Pacific Air Disinfection Purification Revenue (undefined), by Types 2025 & 2033
- Figure 56: Asia Pacific Air Disinfection Purification Volume (K), by Types 2025 & 2033
- Figure 57: Asia Pacific Air Disinfection Purification Revenue Share (%), by Types 2025 & 2033
- Figure 58: Asia Pacific Air Disinfection Purification Volume Share (%), by Types 2025 & 2033
- Figure 59: Asia Pacific Air Disinfection Purification Revenue (undefined), by Country 2025 & 2033
- Figure 60: Asia Pacific Air Disinfection Purification Volume (K), by Country 2025 & 2033
- Figure 61: Asia Pacific Air Disinfection Purification Revenue Share (%), by Country 2025 & 2033
- Figure 62: Asia Pacific Air Disinfection Purification Volume Share (%), by Country 2025 & 2033
List of Tables
- Table 1: Global Air Disinfection Purification Revenue undefined Forecast, by Application 2020 & 2033
- Table 2: Global Air Disinfection Purification Volume K Forecast, by Application 2020 & 2033
- Table 3: Global Air Disinfection Purification Revenue undefined Forecast, by Types 2020 & 2033
- Table 4: Global Air Disinfection Purification Volume K Forecast, by Types 2020 & 2033
- Table 5: Global Air Disinfection Purification Revenue undefined Forecast, by Region 2020 & 2033
- Table 6: Global Air Disinfection Purification Volume K Forecast, by Region 2020 & 2033
- Table 7: Global Air Disinfection Purification Revenue undefined Forecast, by Application 2020 & 2033
- Table 8: Global Air Disinfection Purification Volume K Forecast, by Application 2020 & 2033
- Table 9: Global Air Disinfection Purification Revenue undefined Forecast, by Types 2020 & 2033
- Table 10: Global Air Disinfection Purification Volume K Forecast, by Types 2020 & 2033
- Table 11: Global Air Disinfection Purification Revenue undefined Forecast, by Country 2020 & 2033
- Table 12: Global Air Disinfection Purification Volume K Forecast, by Country 2020 & 2033
- Table 13: United States Air Disinfection Purification Revenue (undefined) Forecast, by Application 2020 & 2033
- Table 14: United States Air Disinfection Purification Volume (K) Forecast, by Application 2020 & 2033
- Table 15: Canada Air Disinfection Purification Revenue (undefined) Forecast, by Application 2020 & 2033
- Table 16: Canada Air Disinfection Purification Volume (K) Forecast, by Application 2020 & 2033
- Table 17: Mexico Air Disinfection Purification Revenue (undefined) Forecast, by Application 2020 & 2033
- Table 18: Mexico Air Disinfection Purification Volume (K) Forecast, by Application 2020 & 2033
- Table 19: Global Air Disinfection Purification Revenue undefined Forecast, by Application 2020 & 2033
- Table 20: Global Air Disinfection Purification Volume K Forecast, by Application 2020 & 2033
- Table 21: Global Air Disinfection Purification Revenue undefined Forecast, by Types 2020 & 2033
- Table 22: Global Air Disinfection Purification Volume K Forecast, by Types 2020 & 2033
- Table 23: Global Air Disinfection Purification Revenue undefined Forecast, by Country 2020 & 2033
- Table 24: Global Air Disinfection Purification Volume K Forecast, by Country 2020 & 2033
- Table 25: Brazil Air Disinfection Purification Revenue (undefined) Forecast, by Application 2020 & 2033
- Table 26: Brazil Air Disinfection Purification Volume (K) Forecast, by Application 2020 & 2033
- Table 27: Argentina Air Disinfection Purification Revenue (undefined) Forecast, by Application 2020 & 2033
- Table 28: Argentina Air Disinfection Purification Volume (K) Forecast, by Application 2020 & 2033
- Table 29: Rest of South America Air Disinfection Purification Revenue (undefined) Forecast, by Application 2020 & 2033
- Table 30: Rest of South America Air Disinfection Purification Volume (K) Forecast, by Application 2020 & 2033
- Table 31: Global Air Disinfection Purification Revenue undefined Forecast, by Application 2020 & 2033
- Table 32: Global Air Disinfection Purification Volume K Forecast, by Application 2020 & 2033
- Table 33: Global Air Disinfection Purification Revenue undefined Forecast, by Types 2020 & 2033
- Table 34: Global Air Disinfection Purification Volume K Forecast, by Types 2020 & 2033
- Table 35: Global Air Disinfection Purification Revenue undefined Forecast, by Country 2020 & 2033
- Table 36: Global Air Disinfection Purification Volume K Forecast, by Country 2020 & 2033
- Table 37: United Kingdom Air Disinfection Purification Revenue (undefined) Forecast, by Application 2020 & 2033
- Table 38: United Kingdom Air Disinfection Purification Volume (K) Forecast, by Application 2020 & 2033
- Table 39: Germany Air Disinfection Purification Revenue (undefined) Forecast, by Application 2020 & 2033
- Table 40: Germany Air Disinfection Purification Volume (K) Forecast, by Application 2020 & 2033
- Table 41: France Air Disinfection Purification Revenue (undefined) Forecast, by Application 2020 & 2033
- Table 42: France Air Disinfection Purification Volume (K) Forecast, by Application 2020 & 2033
- Table 43: Italy Air Disinfection Purification Revenue (undefined) Forecast, by Application 2020 & 2033
- Table 44: Italy Air Disinfection Purification Volume (K) Forecast, by Application 2020 & 2033
- Table 45: Spain Air Disinfection Purification Revenue (undefined) Forecast, by Application 2020 & 2033
- Table 46: Spain Air Disinfection Purification Volume (K) Forecast, by Application 2020 & 2033
- Table 47: Russia Air Disinfection Purification Revenue (undefined) Forecast, by Application 2020 & 2033
- Table 48: Russia Air Disinfection Purification Volume (K) Forecast, by Application 2020 & 2033
- Table 49: Benelux Air Disinfection Purification Revenue (undefined) Forecast, by Application 2020 & 2033
- Table 50: Benelux Air Disinfection Purification Volume (K) Forecast, by Application 2020 & 2033
- Table 51: Nordics Air Disinfection Purification Revenue (undefined) Forecast, by Application 2020 & 2033
- Table 52: Nordics Air Disinfection Purification Volume (K) Forecast, by Application 2020 & 2033
- Table 53: Rest of Europe Air Disinfection Purification Revenue (undefined) Forecast, by Application 2020 & 2033
- Table 54: Rest of Europe Air Disinfection Purification Volume (K) Forecast, by Application 2020 & 2033
- Table 55: Global Air Disinfection Purification Revenue undefined Forecast, by Application 2020 & 2033
- Table 56: Global Air Disinfection Purification Volume K Forecast, by Application 2020 & 2033
- Table 57: Global Air Disinfection Purification Revenue undefined Forecast, by Types 2020 & 2033
- Table 58: Global Air Disinfection Purification Volume K Forecast, by Types 2020 & 2033
- Table 59: Global Air Disinfection Purification Revenue undefined Forecast, by Country 2020 & 2033
- Table 60: Global Air Disinfection Purification Volume K Forecast, by Country 2020 & 2033
- Table 61: Turkey Air Disinfection Purification Revenue (undefined) Forecast, by Application 2020 & 2033
- Table 62: Turkey Air Disinfection Purification Volume (K) Forecast, by Application 2020 & 2033
- Table 63: Israel Air Disinfection Purification Revenue (undefined) Forecast, by Application 2020 & 2033
- Table 64: Israel Air Disinfection Purification Volume (K) Forecast, by Application 2020 & 2033
- Table 65: GCC Air Disinfection Purification Revenue (undefined) Forecast, by Application 2020 & 2033
- Table 66: GCC Air Disinfection Purification Volume (K) Forecast, by Application 2020 & 2033
- Table 67: North Africa Air Disinfection Purification Revenue (undefined) Forecast, by Application 2020 & 2033
- Table 68: North Africa Air Disinfection Purification Volume (K) Forecast, by Application 2020 & 2033
- Table 69: South Africa Air Disinfection Purification Revenue (undefined) Forecast, by Application 2020 & 2033
- Table 70: South Africa Air Disinfection Purification Volume (K) Forecast, by Application 2020 & 2033
- Table 71: Rest of Middle East & Africa Air Disinfection Purification Revenue (undefined) Forecast, by Application 2020 & 2033
- Table 72: Rest of Middle East & Africa Air Disinfection Purification Volume (K) Forecast, by Application 2020 & 2033
- Table 73: Global Air Disinfection Purification Revenue undefined Forecast, by Application 2020 & 2033
- Table 74: Global Air Disinfection Purification Volume K Forecast, by Application 2020 & 2033
- Table 75: Global Air Disinfection Purification Revenue undefined Forecast, by Types 2020 & 2033
- Table 76: Global Air Disinfection Purification Volume K Forecast, by Types 2020 & 2033
- Table 77: Global Air Disinfection Purification Revenue undefined Forecast, by Country 2020 & 2033
- Table 78: Global Air Disinfection Purification Volume K Forecast, by Country 2020 & 2033
- Table 79: China Air Disinfection Purification Revenue (undefined) Forecast, by Application 2020 & 2033
- Table 80: China Air Disinfection Purification Volume (K) Forecast, by Application 2020 & 2033
- Table 81: India Air Disinfection Purification Revenue (undefined) Forecast, by Application 2020 & 2033
- Table 82: India Air Disinfection Purification Volume (K) Forecast, by Application 2020 & 2033
- Table 83: Japan Air Disinfection Purification Revenue (undefined) Forecast, by Application 2020 & 2033
- Table 84: Japan Air Disinfection Purification Volume (K) Forecast, by Application 2020 & 2033
- Table 85: South Korea Air Disinfection Purification Revenue (undefined) Forecast, by Application 2020 & 2033
- Table 86: South Korea Air Disinfection Purification Volume (K) Forecast, by Application 2020 & 2033
- Table 87: ASEAN Air Disinfection Purification Revenue (undefined) Forecast, by Application 2020 & 2033
- Table 88: ASEAN Air Disinfection Purification Volume (K) Forecast, by Application 2020 & 2033
- Table 89: Oceania Air Disinfection Purification Revenue (undefined) Forecast, by Application 2020 & 2033
- Table 90: Oceania Air Disinfection Purification Volume (K) Forecast, by Application 2020 & 2033
- Table 91: Rest of Asia Pacific Air Disinfection Purification Revenue (undefined) Forecast, by Application 2020 & 2033
- Table 92: Rest of Asia Pacific Air Disinfection Purification Volume (K) Forecast, by Application 2020 & 2033
Frequently Asked Questions
1. What is the projected Compound Annual Growth Rate (CAGR) of the Air Disinfection Purification?
The projected CAGR is approximately 15.12%.
2. Which companies are prominent players in the Air Disinfection Purification?
Key companies in the market include Sharp, Philips, Panasonic, Daikin, Trion, Blueair, Air Oasis, Sanuvox Technologies, Colzer, KLEEMANN, Lux Royal, Kinyo, IQAir, Novaerus, MANN + HUMMEL, UTRONIX, CAMFIL, Aurabeat.
3. What are the main segments of the Air Disinfection Purification?
The market segments include Application, Types.
4. Can you provide details about the market size?
The market size is estimated to be USD XXX N/A as of 2022.
5. What are some drivers contributing to market growth?
N/A
6. What are the notable trends driving market growth?
N/A
7. Are there any restraints impacting market growth?
N/A
8. Can you provide examples of recent developments in the market?
N/A
9. What pricing options are available for accessing the report?
Pricing options include single-user, multi-user, and enterprise licenses priced at USD 3350.00, USD 5025.00, and USD 6700.00 respectively.
10. Is the market size provided in terms of value or volume?
The market size is provided in terms of value, measured in N/A and volume, measured in K.
11. Are there any specific market keywords associated with the report?
Yes, the market keyword associated with the report is "Air Disinfection Purification," which aids in identifying and referencing the specific market segment covered.
12. How do I determine which pricing option suits my needs best?
The pricing options vary based on user requirements and access needs. Individual users may opt for single-user licenses, while businesses requiring broader access may choose multi-user or enterprise licenses for cost-effective access to the report.
13. Are there any additional resources or data provided in the Air Disinfection Purification report?
While the report offers comprehensive insights, it's advisable to review the specific contents or supplementary materials provided to ascertain if additional resources or data are available.
14. How can I stay updated on further developments or reports in the Air Disinfection Purification?
To stay informed about further developments, trends, and reports in the Air Disinfection Purification, consider subscribing to industry newsletters, following relevant companies and organizations, or regularly checking reputable industry news sources and publications.
Methodology
Step 1 - Identification of Relevant Samples Size from Population Database


Step 2 - Approaches for Defining Global Market Size (Value, Volume* & Price*)

Note*: In applicable scenarios
Step 3 - Data Sources
Primary Research
- Web Analytics
- Survey Reports
- Research Institute
- Latest Research Reports
- Opinion Leaders
Secondary Research
- Annual Reports
- White Paper
- Latest Press Release
- Industry Association
- Paid Database
- Investor Presentations

Step 4 - Data Triangulation
Involves using different sources of information in order to increase the validity of a study
These sources are likely to be stakeholders in a program - participants, other researchers, program staff, other community members, and so on.
Then we put all data in single framework & apply various statistical tools to find out the dynamic on the market.
During the analysis stage, feedback from the stakeholder groups would be compared to determine areas of agreement as well as areas of divergence