

Key Insights
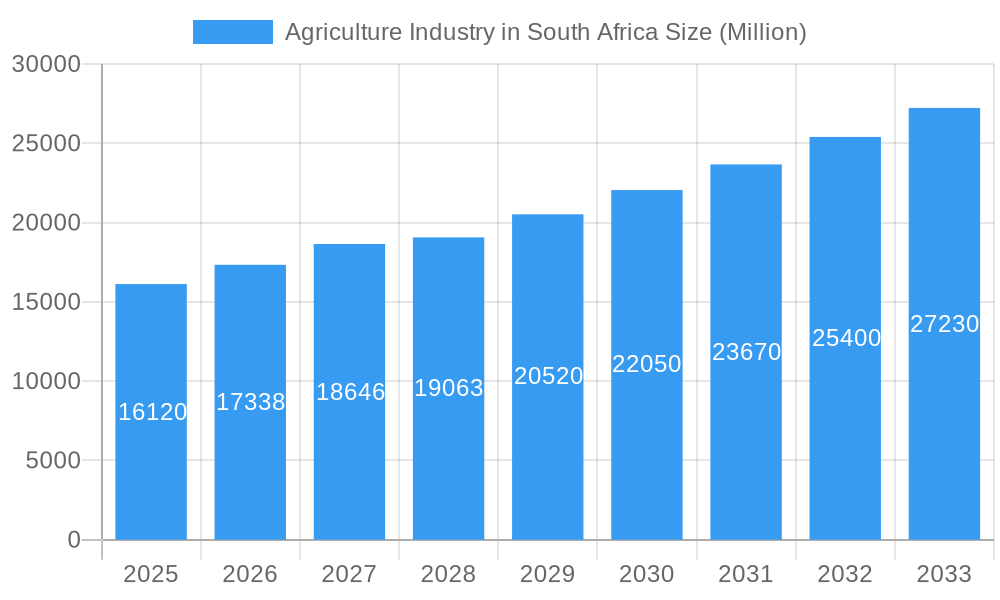
The South African agricultural industry, valued at approximately $16.12 billion in 2025, is projected to experience robust growth, with a Compound Annual Growth Rate (CAGR) of 7.60% from 2025 to 2033. This expansion is driven by several key factors. Increasing global demand for food, particularly from a growing African population, presents significant opportunities for South African producers. Technological advancements in precision agriculture, including improved irrigation techniques, data analytics for optimized resource management, and the adoption of genetically modified crops resistant to pests and diseases, are enhancing productivity and yields. Government initiatives promoting agricultural infrastructure development and farmer support programs also contribute to market growth. Furthermore, diversification into high-value crops like fruits and vegetables for both domestic and export markets is boosting revenue streams. However, challenges remain, including climate change impacts like droughts and unpredictable rainfall patterns, which necessitate investment in climate-resilient farming practices. Land reform and access to resources for smallholder farmers continue to be significant hurdles that affect overall industry productivity. Competition from international players and fluctuating global commodity prices also pose ongoing risks to profitability and stability.
Agriculture Industry in South Africa Market Size (In Billion)
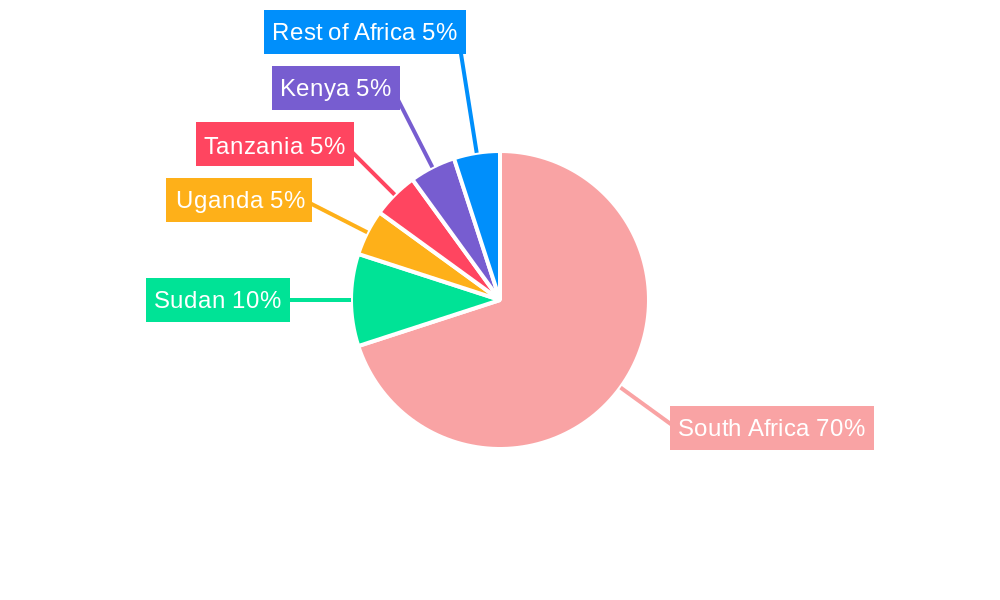
The market is segmented by crop type, encompassing cereals, fruits, vegetables, and oilseeds, with each segment contributing differently to overall growth. Major players like Pioneer Foods, Bayer Crop Science, Syngenta, Monsanto, and Tiger Brands are shaping the competitive landscape through innovation, strategic partnerships, and market expansion initiatives. Regionally, South Africa dominates the market within the provided African data, though significant growth potential exists in other African nations like Sudan, Uganda, Tanzania, and Kenya, presenting opportunities for market expansion. Looking forward, the sustained focus on technology adoption, infrastructure improvement, and sustainable agricultural practices will be crucial for realizing the full growth potential of the South African agricultural industry over the next decade.
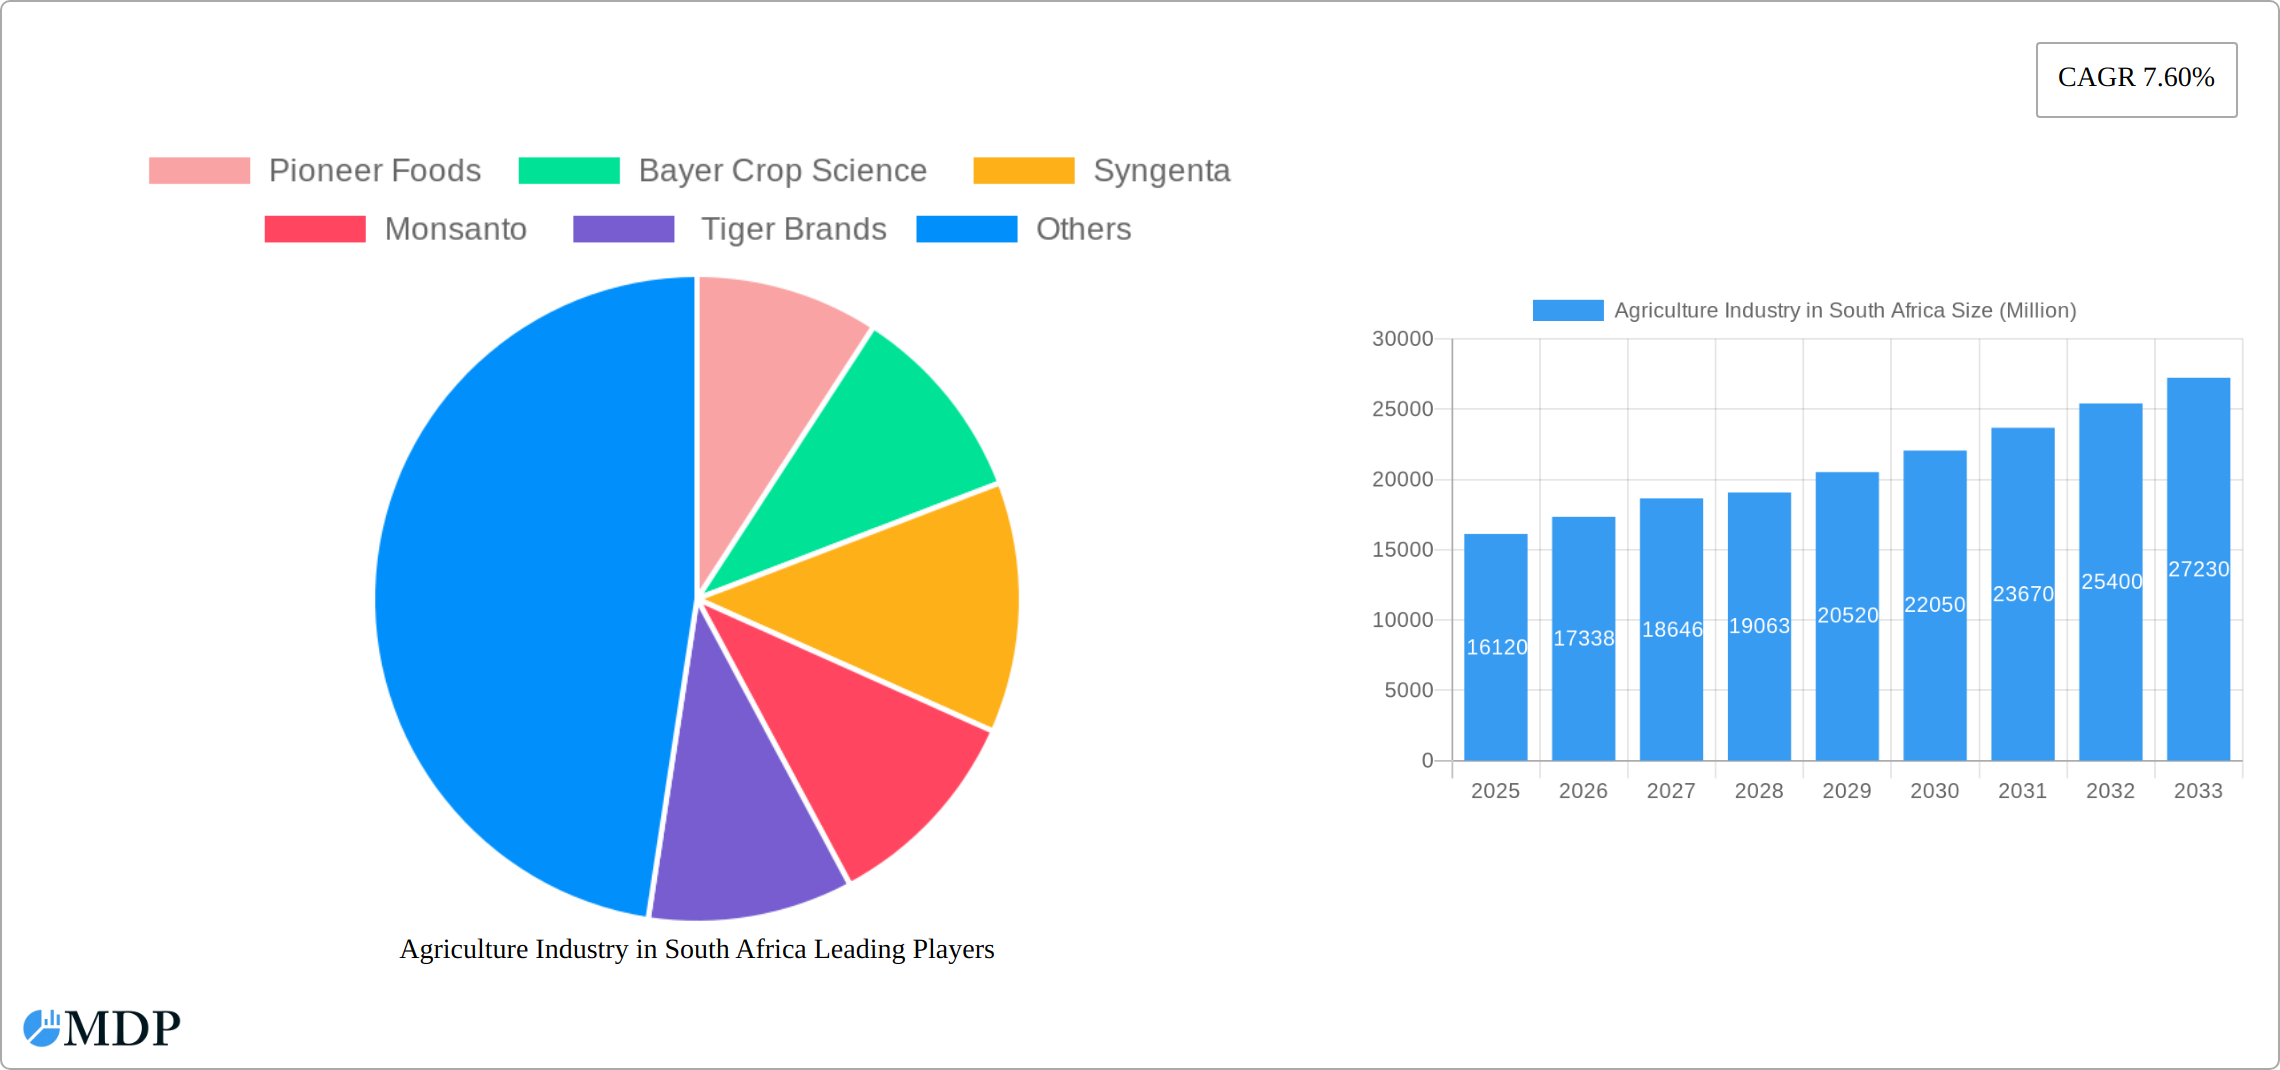
Agriculture Industry in South Africa Company Market Share
South Africa Agriculture Industry Report: 2019-2033
This comprehensive report provides an in-depth analysis of South Africa's agriculture industry, encompassing market dynamics, leading players, key trends, and future growth prospects. Covering the period 2019-2033, with a base year of 2025 and a forecast period of 2025-2033, this report is an essential resource for industry stakeholders, investors, and policymakers seeking actionable insights into this vital sector. The report leverages data from the historical period (2019-2024) to project future market trends. The total market value is predicted to reach xx Million by 2033.
Agriculture Industry in South Africa Market Dynamics & Concentration
The South African agriculture industry is characterized by a moderate level of concentration, with a few large players like Pioneer Foods and Tiger Brands holding significant market share in specific segments. However, the market also features a considerable number of smaller, specialized farms. Market share data for 2025 suggests that Pioneer Foods holds approximately 15% of the processed foods market, while Tiger Brands holds around 12%. Innovation is driven by the need for improved yields, drought resistance, and sustainable farming practices. Stringent regulatory frameworks, including those related to food safety and environmental protection, significantly influence industry operations. Product substitutes, particularly in the processed foods sector, exert competitive pressure. End-user trends, including a growing demand for organic and sustainably produced food, are reshaping the industry landscape. M&A activity in the past five years has averaged 5 deals annually, primarily focused on consolidation within the processed foods sector.
- Market Concentration: Moderately concentrated, with several large players and numerous smaller farms.
- Innovation Drivers: Improved yields, drought resistance, sustainable practices.
- Regulatory Framework: Stringent regulations regarding food safety and environmental standards.
- Product Substitutes: Increasing availability of substitute products impacting certain segments.
- End-User Trends: Growing demand for organic and sustainable food products.
- M&A Activity (2019-2024): Average of 5 deals per year, driven by consolidation.
Agriculture Industry in South Africa Industry Trends & Analysis
South Africa's agriculture industry is undergoing a period of significant transformation, shaped by a complex interplay of factors. While projected market growth remains positive, with a CAGR of 3.5% anticipated between 2025 and 2033, driven by increased domestic demand and export opportunities, the sector faces considerable hurdles. Government initiatives aimed at fostering agricultural development play a crucial role, but their effectiveness is contingent upon addressing systemic challenges. Technological advancements, such as precision farming and agricultural biotechnology, are boosting productivity and efficiency, yet their widespread adoption is hampered by factors like cost and access. The increasing consumer demand for sustainable and ethically sourced food products presents both opportunities and challenges for producers. This necessitates a shift towards environmentally friendly practices and transparent supply chains. Furthermore, intense competition, both domestically and internationally, continues to shape the market landscape.
Leading Markets & Segments in Agriculture Industry in South Africa
Within the South African agricultural landscape, cereals represent the largest segment, contributing approximately 40% of total agricultural revenue in 2025. This dominance is driven by factors such as favorable climatic conditions in certain regions, established infrastructure, and government support programs focused on grain production. The fruit and vegetable segments also hold significant market share, driven by both domestic consumption and export opportunities. Oilseeds are a growing sector, particularly with the increasing demand for biofuels and vegetable oils.
- Cereals:
- Key Drivers: Favorable climate, established infrastructure, government support.
- Fruits:
- Key Drivers: Export potential, growing domestic demand for fresh produce.
- Vegetables:
- Key Drivers: Increased urbanization leading to higher demand, government support for horticulture.
- Oilseeds:
- Key Drivers: Growing demand for biofuels and vegetable oils, government incentives.
Agriculture Industry in South Africa Product Developments
Recent product innovations have focused on developing drought-resistant crop varieties, enhancing pest and disease control, and improving nutrient utilization. These innovations leverage advancements in biotechnology and precision agriculture. Companies are also focusing on developing value-added products, such as processed foods and organic produce, to cater to evolving consumer preferences. The market fit for these products is strong, driven by both domestic demand and export opportunities.
Key Drivers of Agriculture Industry in South Africa Growth
Several factors contribute to the growth of South Africa's agriculture industry. Technological advancements in precision farming, irrigation techniques, and biotechnology are improving yields and efficiency. Government policies promoting agricultural investment and infrastructure development are creating a favorable environment for growth. Furthermore, increasing domestic demand and export opportunities for high-value agricultural products are driving expansion.
Challenges in the Agriculture Industry in South Africa Market
The South African agricultural sector grapples with a multitude of persistent challenges. Water scarcity, exacerbated by recurring droughts and inefficient water management, remains a critical threat to agricultural production, particularly in arid and semi-arid regions. Inadequate infrastructure and logistics contribute to supply chain inefficiencies, hindering timely and cost-effective delivery of produce to market. Land reform policies, while aiming to redress historical injustices, continue to present complexities for efficient land use and agricultural production. The volatility of global commodity prices and intense competition from established international players expose the industry to significant economic instability. Furthermore, climate change impacts, including extreme weather events, pose an increasing threat to crop yields and livestock production. These challenges collectively exert downward pressure on annual growth, potentially reducing it by 1-2%.
Emerging Opportunities in Agriculture Industry in South Africa
Despite the challenges, the South African agricultural sector presents compelling opportunities for long-term growth and innovation. Technological breakthroughs in areas such as gene editing, vertical farming, and precision irrigation offer the potential to significantly enhance productivity and resource efficiency, while reducing reliance on water and land. Strategic partnerships between local farmers, research institutions, and international companies can foster knowledge transfer, technology adoption, and access to wider markets. Focusing on the production and export of high-value agricultural products, such as specialty crops and processed foods, can drive economic growth and create new employment opportunities. Investment in sustainable agricultural practices, including agroforestry and integrated pest management, can improve environmental sustainability and resilience.
Leading Players in the Agriculture Industry in South Africa Sector
- Pioneer Foods
- Bayer Crop Science
- Syngenta
- Tiger Brands
- Other significant players include numerous smaller-scale farmers and cooperatives.
Key Milestones in Agriculture Industry in South Africa Industry
- 2020-Present: Ongoing government initiatives focused on improving agricultural infrastructure, water management, and farmer support programs continue to shape the industry landscape.
- Ongoing: Private sector investment in research and development for climate-resilient crops and sustainable agricultural practices is crucial for future growth.
- Ongoing: The evolving landscape of trade agreements and international market access significantly impacts the export potential of South African agricultural products.
- Ongoing: Focus on improving food security and addressing issues of food access and affordability remains paramount.
Strategic Outlook for Agriculture Industry in South Africa Market
The South African agriculture industry holds substantial potential for future growth. Continued investment in technological innovation, sustainable practices, and improved infrastructure will be crucial for unlocking this potential. Strategic partnerships, both domestically and internationally, will play a key role in enhancing competitiveness and expanding market access. Focusing on value-added products and catering to evolving consumer preferences will drive long-term profitability.
Agriculture Industry in South Africa Segmentation
-
1. Crop Type
- 1.1. Cereals
- 1.2. Fruits
- 1.3. Vegetables
- 1.4. Oilseeds
-
2. Crop Type
- 2.1. Cereals
- 2.2. Fruits
- 2.3. Vegetables
- 2.4. Oilseeds
Agriculture Industry in South Africa Segmentation By Geography
-
1. North America
- 1.1. United States
- 1.2. Canada
- 1.3. Mexico
-
2. South America
- 2.1. Brazil
- 2.2. Argentina
- 2.3. Rest of South America
-
3. Europe
- 3.1. United Kingdom
- 3.2. Germany
- 3.3. France
- 3.4. Italy
- 3.5. Spain
- 3.6. Russia
- 3.7. Benelux
- 3.8. Nordics
- 3.9. Rest of Europe
-
4. Middle East & Africa
- 4.1. Turkey
- 4.2. Israel
- 4.3. GCC
- 4.4. North Africa
- 4.5. South Africa
- 4.6. Rest of Middle East & Africa
-
5. Asia Pacific
- 5.1. China
- 5.2. India
- 5.3. Japan
- 5.4. South Korea
- 5.5. ASEAN
- 5.6. Oceania
- 5.7. Rest of Asia Pacific
Agriculture Industry in South Africa Regional Market Share
Geographic Coverage of Agriculture Industry in South Africa
Agriculture Industry in South Africa REPORT HIGHLIGHTS
| Aspects | Details |
|---|---|
| Study Period | 2020-2034 |
| Base Year | 2025 |
| Estimated Year | 2026 |
| Forecast Period | 2026-2034 |
| Historical Period | 2020-2025 |
| Growth Rate | CAGR of 7.60% from 2020-2034 |
| Segmentation |
|
Table of Contents
- 1. Introduction
- 1.1. Research Scope
- 1.2. Market Segmentation
- 1.3. Research Methodology
- 1.4. Definitions and Assumptions
- 2. Executive Summary
- 2.1. Introduction
- 3. Market Dynamics
- 3.1. Introduction
- 3.2. Market Drivers
- 3.2.1. Rising Consumption of Cashew Nuts as a Healthy Snack; Increasing Government initiatives; Growing Cashew Nut Imports in The United States
- 3.3. Market Restrains
- 3.3.1. Hazardous Climatic Condition Hinders Cashew Production; Stringent Regulations Related To Food Quality Standards
- 3.4. Market Trends
- 3.4.1. High Demand for Food Crops with the rising population
- 4. Market Factor Analysis
- 4.1. Porters Five Forces
- 4.2. Supply/Value Chain
- 4.3. PESTEL analysis
- 4.4. Market Entropy
- 4.5. Patent/Trademark Analysis
- 5. Global Agriculture Industry in South Africa Analysis, Insights and Forecast, 2020-2032
- 5.1. Market Analysis, Insights and Forecast - by Crop Type
- 5.1.1. Cereals
- 5.1.2. Fruits
- 5.1.3. Vegetables
- 5.1.4. Oilseeds
- 5.2. Market Analysis, Insights and Forecast - by Crop Type
- 5.2.1. Cereals
- 5.2.2. Fruits
- 5.2.3. Vegetables
- 5.2.4. Oilseeds
- 5.3. Market Analysis, Insights and Forecast - by Region
- 5.3.1. North America
- 5.3.2. South America
- 5.3.3. Europe
- 5.3.4. Middle East & Africa
- 5.3.5. Asia Pacific
- 5.1. Market Analysis, Insights and Forecast - by Crop Type
- 6. North America Agriculture Industry in South Africa Analysis, Insights and Forecast, 2020-2032
- 6.1. Market Analysis, Insights and Forecast - by Crop Type
- 6.1.1. Cereals
- 6.1.2. Fruits
- 6.1.3. Vegetables
- 6.1.4. Oilseeds
- 6.2. Market Analysis, Insights and Forecast - by Crop Type
- 6.2.1. Cereals
- 6.2.2. Fruits
- 6.2.3. Vegetables
- 6.2.4. Oilseeds
- 6.1. Market Analysis, Insights and Forecast - by Crop Type
- 7. South America Agriculture Industry in South Africa Analysis, Insights and Forecast, 2020-2032
- 7.1. Market Analysis, Insights and Forecast - by Crop Type
- 7.1.1. Cereals
- 7.1.2. Fruits
- 7.1.3. Vegetables
- 7.1.4. Oilseeds
- 7.2. Market Analysis, Insights and Forecast - by Crop Type
- 7.2.1. Cereals
- 7.2.2. Fruits
- 7.2.3. Vegetables
- 7.2.4. Oilseeds
- 7.1. Market Analysis, Insights and Forecast - by Crop Type
- 8. Europe Agriculture Industry in South Africa Analysis, Insights and Forecast, 2020-2032
- 8.1. Market Analysis, Insights and Forecast - by Crop Type
- 8.1.1. Cereals
- 8.1.2. Fruits
- 8.1.3. Vegetables
- 8.1.4. Oilseeds
- 8.2. Market Analysis, Insights and Forecast - by Crop Type
- 8.2.1. Cereals
- 8.2.2. Fruits
- 8.2.3. Vegetables
- 8.2.4. Oilseeds
- 8.1. Market Analysis, Insights and Forecast - by Crop Type
- 9. Middle East & Africa Agriculture Industry in South Africa Analysis, Insights and Forecast, 2020-2032
- 9.1. Market Analysis, Insights and Forecast - by Crop Type
- 9.1.1. Cereals
- 9.1.2. Fruits
- 9.1.3. Vegetables
- 9.1.4. Oilseeds
- 9.2. Market Analysis, Insights and Forecast - by Crop Type
- 9.2.1. Cereals
- 9.2.2. Fruits
- 9.2.3. Vegetables
- 9.2.4. Oilseeds
- 9.1. Market Analysis, Insights and Forecast - by Crop Type
- 10. Asia Pacific Agriculture Industry in South Africa Analysis, Insights and Forecast, 2020-2032
- 10.1. Market Analysis, Insights and Forecast - by Crop Type
- 10.1.1. Cereals
- 10.1.2. Fruits
- 10.1.3. Vegetables
- 10.1.4. Oilseeds
- 10.2. Market Analysis, Insights and Forecast - by Crop Type
- 10.2.1. Cereals
- 10.2.2. Fruits
- 10.2.3. Vegetables
- 10.2.4. Oilseeds
- 10.1. Market Analysis, Insights and Forecast - by Crop Type
- 11. Competitive Analysis
- 11.1. Global Market Share Analysis 2025
- 11.2. Company Profiles
- 11.2.1 Pioneer Foods
- 11.2.1.1. Overview
- 11.2.1.2. Products
- 11.2.1.3. SWOT Analysis
- 11.2.1.4. Recent Developments
- 11.2.1.5. Financials (Based on Availability)
- 11.2.2 Bayer Crop Science
- 11.2.2.1. Overview
- 11.2.2.2. Products
- 11.2.2.3. SWOT Analysis
- 11.2.2.4. Recent Developments
- 11.2.2.5. Financials (Based on Availability)
- 11.2.3 Syngenta
- 11.2.3.1. Overview
- 11.2.3.2. Products
- 11.2.3.3. SWOT Analysis
- 11.2.3.4. Recent Developments
- 11.2.3.5. Financials (Based on Availability)
- 11.2.4 Monsanto
- 11.2.4.1. Overview
- 11.2.4.2. Products
- 11.2.4.3. SWOT Analysis
- 11.2.4.4. Recent Developments
- 11.2.4.5. Financials (Based on Availability)
- 11.2.5 Tiger Brands
- 11.2.5.1. Overview
- 11.2.5.2. Products
- 11.2.5.3. SWOT Analysis
- 11.2.5.4. Recent Developments
- 11.2.5.5. Financials (Based on Availability)
- 11.2.1 Pioneer Foods
List of Figures
- Figure 1: Global Agriculture Industry in South Africa Revenue Breakdown (Million, %) by Region 2025 & 2033
- Figure 2: North America Agriculture Industry in South Africa Revenue (Million), by Crop Type 2025 & 2033
- Figure 3: North America Agriculture Industry in South Africa Revenue Share (%), by Crop Type 2025 & 2033
- Figure 4: North America Agriculture Industry in South Africa Revenue (Million), by Crop Type 2025 & 2033
- Figure 5: North America Agriculture Industry in South Africa Revenue Share (%), by Crop Type 2025 & 2033
- Figure 6: North America Agriculture Industry in South Africa Revenue (Million), by Country 2025 & 2033
- Figure 7: North America Agriculture Industry in South Africa Revenue Share (%), by Country 2025 & 2033
- Figure 8: South America Agriculture Industry in South Africa Revenue (Million), by Crop Type 2025 & 2033
- Figure 9: South America Agriculture Industry in South Africa Revenue Share (%), by Crop Type 2025 & 2033
- Figure 10: South America Agriculture Industry in South Africa Revenue (Million), by Crop Type 2025 & 2033
- Figure 11: South America Agriculture Industry in South Africa Revenue Share (%), by Crop Type 2025 & 2033
- Figure 12: South America Agriculture Industry in South Africa Revenue (Million), by Country 2025 & 2033
- Figure 13: South America Agriculture Industry in South Africa Revenue Share (%), by Country 2025 & 2033
- Figure 14: Europe Agriculture Industry in South Africa Revenue (Million), by Crop Type 2025 & 2033
- Figure 15: Europe Agriculture Industry in South Africa Revenue Share (%), by Crop Type 2025 & 2033
- Figure 16: Europe Agriculture Industry in South Africa Revenue (Million), by Crop Type 2025 & 2033
- Figure 17: Europe Agriculture Industry in South Africa Revenue Share (%), by Crop Type 2025 & 2033
- Figure 18: Europe Agriculture Industry in South Africa Revenue (Million), by Country 2025 & 2033
- Figure 19: Europe Agriculture Industry in South Africa Revenue Share (%), by Country 2025 & 2033
- Figure 20: Middle East & Africa Agriculture Industry in South Africa Revenue (Million), by Crop Type 2025 & 2033
- Figure 21: Middle East & Africa Agriculture Industry in South Africa Revenue Share (%), by Crop Type 2025 & 2033
- Figure 22: Middle East & Africa Agriculture Industry in South Africa Revenue (Million), by Crop Type 2025 & 2033
- Figure 23: Middle East & Africa Agriculture Industry in South Africa Revenue Share (%), by Crop Type 2025 & 2033
- Figure 24: Middle East & Africa Agriculture Industry in South Africa Revenue (Million), by Country 2025 & 2033
- Figure 25: Middle East & Africa Agriculture Industry in South Africa Revenue Share (%), by Country 2025 & 2033
- Figure 26: Asia Pacific Agriculture Industry in South Africa Revenue (Million), by Crop Type 2025 & 2033
- Figure 27: Asia Pacific Agriculture Industry in South Africa Revenue Share (%), by Crop Type 2025 & 2033
- Figure 28: Asia Pacific Agriculture Industry in South Africa Revenue (Million), by Crop Type 2025 & 2033
- Figure 29: Asia Pacific Agriculture Industry in South Africa Revenue Share (%), by Crop Type 2025 & 2033
- Figure 30: Asia Pacific Agriculture Industry in South Africa Revenue (Million), by Country 2025 & 2033
- Figure 31: Asia Pacific Agriculture Industry in South Africa Revenue Share (%), by Country 2025 & 2033
List of Tables
- Table 1: Global Agriculture Industry in South Africa Revenue Million Forecast, by Crop Type 2020 & 2033
- Table 2: Global Agriculture Industry in South Africa Revenue Million Forecast, by Crop Type 2020 & 2033
- Table 3: Global Agriculture Industry in South Africa Revenue Million Forecast, by Region 2020 & 2033
- Table 4: Global Agriculture Industry in South Africa Revenue Million Forecast, by Crop Type 2020 & 2033
- Table 5: Global Agriculture Industry in South Africa Revenue Million Forecast, by Crop Type 2020 & 2033
- Table 6: Global Agriculture Industry in South Africa Revenue Million Forecast, by Country 2020 & 2033
- Table 7: United States Agriculture Industry in South Africa Revenue (Million) Forecast, by Application 2020 & 2033
- Table 8: Canada Agriculture Industry in South Africa Revenue (Million) Forecast, by Application 2020 & 2033
- Table 9: Mexico Agriculture Industry in South Africa Revenue (Million) Forecast, by Application 2020 & 2033
- Table 10: Global Agriculture Industry in South Africa Revenue Million Forecast, by Crop Type 2020 & 2033
- Table 11: Global Agriculture Industry in South Africa Revenue Million Forecast, by Crop Type 2020 & 2033
- Table 12: Global Agriculture Industry in South Africa Revenue Million Forecast, by Country 2020 & 2033
- Table 13: Brazil Agriculture Industry in South Africa Revenue (Million) Forecast, by Application 2020 & 2033
- Table 14: Argentina Agriculture Industry in South Africa Revenue (Million) Forecast, by Application 2020 & 2033
- Table 15: Rest of South America Agriculture Industry in South Africa Revenue (Million) Forecast, by Application 2020 & 2033
- Table 16: Global Agriculture Industry in South Africa Revenue Million Forecast, by Crop Type 2020 & 2033
- Table 17: Global Agriculture Industry in South Africa Revenue Million Forecast, by Crop Type 2020 & 2033
- Table 18: Global Agriculture Industry in South Africa Revenue Million Forecast, by Country 2020 & 2033
- Table 19: United Kingdom Agriculture Industry in South Africa Revenue (Million) Forecast, by Application 2020 & 2033
- Table 20: Germany Agriculture Industry in South Africa Revenue (Million) Forecast, by Application 2020 & 2033
- Table 21: France Agriculture Industry in South Africa Revenue (Million) Forecast, by Application 2020 & 2033
- Table 22: Italy Agriculture Industry in South Africa Revenue (Million) Forecast, by Application 2020 & 2033
- Table 23: Spain Agriculture Industry in South Africa Revenue (Million) Forecast, by Application 2020 & 2033
- Table 24: Russia Agriculture Industry in South Africa Revenue (Million) Forecast, by Application 2020 & 2033
- Table 25: Benelux Agriculture Industry in South Africa Revenue (Million) Forecast, by Application 2020 & 2033
- Table 26: Nordics Agriculture Industry in South Africa Revenue (Million) Forecast, by Application 2020 & 2033
- Table 27: Rest of Europe Agriculture Industry in South Africa Revenue (Million) Forecast, by Application 2020 & 2033
- Table 28: Global Agriculture Industry in South Africa Revenue Million Forecast, by Crop Type 2020 & 2033
- Table 29: Global Agriculture Industry in South Africa Revenue Million Forecast, by Crop Type 2020 & 2033
- Table 30: Global Agriculture Industry in South Africa Revenue Million Forecast, by Country 2020 & 2033
- Table 31: Turkey Agriculture Industry in South Africa Revenue (Million) Forecast, by Application 2020 & 2033
- Table 32: Israel Agriculture Industry in South Africa Revenue (Million) Forecast, by Application 2020 & 2033
- Table 33: GCC Agriculture Industry in South Africa Revenue (Million) Forecast, by Application 2020 & 2033
- Table 34: North Africa Agriculture Industry in South Africa Revenue (Million) Forecast, by Application 2020 & 2033
- Table 35: South Africa Agriculture Industry in South Africa Revenue (Million) Forecast, by Application 2020 & 2033
- Table 36: Rest of Middle East & Africa Agriculture Industry in South Africa Revenue (Million) Forecast, by Application 2020 & 2033
- Table 37: Global Agriculture Industry in South Africa Revenue Million Forecast, by Crop Type 2020 & 2033
- Table 38: Global Agriculture Industry in South Africa Revenue Million Forecast, by Crop Type 2020 & 2033
- Table 39: Global Agriculture Industry in South Africa Revenue Million Forecast, by Country 2020 & 2033
- Table 40: China Agriculture Industry in South Africa Revenue (Million) Forecast, by Application 2020 & 2033
- Table 41: India Agriculture Industry in South Africa Revenue (Million) Forecast, by Application 2020 & 2033
- Table 42: Japan Agriculture Industry in South Africa Revenue (Million) Forecast, by Application 2020 & 2033
- Table 43: South Korea Agriculture Industry in South Africa Revenue (Million) Forecast, by Application 2020 & 2033
- Table 44: ASEAN Agriculture Industry in South Africa Revenue (Million) Forecast, by Application 2020 & 2033
- Table 45: Oceania Agriculture Industry in South Africa Revenue (Million) Forecast, by Application 2020 & 2033
- Table 46: Rest of Asia Pacific Agriculture Industry in South Africa Revenue (Million) Forecast, by Application 2020 & 2033
Frequently Asked Questions
1. What is the projected Compound Annual Growth Rate (CAGR) of the Agriculture Industry in South Africa?
The projected CAGR is approximately 7.60%.
2. Which companies are prominent players in the Agriculture Industry in South Africa?
Key companies in the market include Pioneer Foods , Bayer Crop Science , Syngenta , Monsanto , Tiger Brands.
3. What are the main segments of the Agriculture Industry in South Africa?
The market segments include Crop Type, Crop Type.
4. Can you provide details about the market size?
The market size is estimated to be USD 16.12 Million as of 2022.
5. What are some drivers contributing to market growth?
Rising Consumption of Cashew Nuts as a Healthy Snack; Increasing Government initiatives; Growing Cashew Nut Imports in The United States.
6. What are the notable trends driving market growth?
High Demand for Food Crops with the rising population.
7. Are there any restraints impacting market growth?
Hazardous Climatic Condition Hinders Cashew Production; Stringent Regulations Related To Food Quality Standards.
8. Can you provide examples of recent developments in the market?
N/A
9. What pricing options are available for accessing the report?
Pricing options include single-user, multi-user, and enterprise licenses priced at USD 3800, USD 4500, and USD 5800 respectively.
10. Is the market size provided in terms of value or volume?
The market size is provided in terms of value, measured in Million.
11. Are there any specific market keywords associated with the report?
Yes, the market keyword associated with the report is "Agriculture Industry in South Africa," which aids in identifying and referencing the specific market segment covered.
12. How do I determine which pricing option suits my needs best?
The pricing options vary based on user requirements and access needs. Individual users may opt for single-user licenses, while businesses requiring broader access may choose multi-user or enterprise licenses for cost-effective access to the report.
13. Are there any additional resources or data provided in the Agriculture Industry in South Africa report?
While the report offers comprehensive insights, it's advisable to review the specific contents or supplementary materials provided to ascertain if additional resources or data are available.
14. How can I stay updated on further developments or reports in the Agriculture Industry in South Africa?
To stay informed about further developments, trends, and reports in the Agriculture Industry in South Africa, consider subscribing to industry newsletters, following relevant companies and organizations, or regularly checking reputable industry news sources and publications.
Methodology
Step 1 - Identification of Relevant Samples Size from Population Database


Step 2 - Approaches for Defining Global Market Size (Value, Volume* & Price*)

Note*: In applicable scenarios
Step 3 - Data Sources
Primary Research
- Web Analytics
- Survey Reports
- Research Institute
- Latest Research Reports
- Opinion Leaders
Secondary Research
- Annual Reports
- White Paper
- Latest Press Release
- Industry Association
- Paid Database
- Investor Presentations

Step 4 - Data Triangulation
Involves using different sources of information in order to increase the validity of a study
These sources are likely to be stakeholders in a program - participants, other researchers, program staff, other community members, and so on.
Then we put all data in single framework & apply various statistical tools to find out the dynamic on the market.
During the analysis stage, feedback from the stakeholder groups would be compared to determine areas of agreement as well as areas of divergence