

Key Insights
The global 3D printed glasses market is experiencing robust growth, projected to reach an estimated $134 million by 2025, with a compelling Compound Annual Growth Rate (CAGR) of 8.9% expected between 2025 and 2033. This expansion is fueled by increasing consumer demand for personalized and customizable eyewear, the growing adoption of additive manufacturing in the eyewear industry, and advancements in material science leading to more durable and aesthetically pleasing 3D printed frames. The market's potential is further amplified by the versatility of 3D printing, enabling intricate designs, lightweight structures, and rapid prototyping, thus catering to diverse application needs for both children and adults. Key market drivers include a rising awareness of vision correction solutions, the desire for unique fashion statements, and the technological prowess of companies like Netlooks, Monoqool, and MYKITA, who are at the forefront of innovation in this sector.
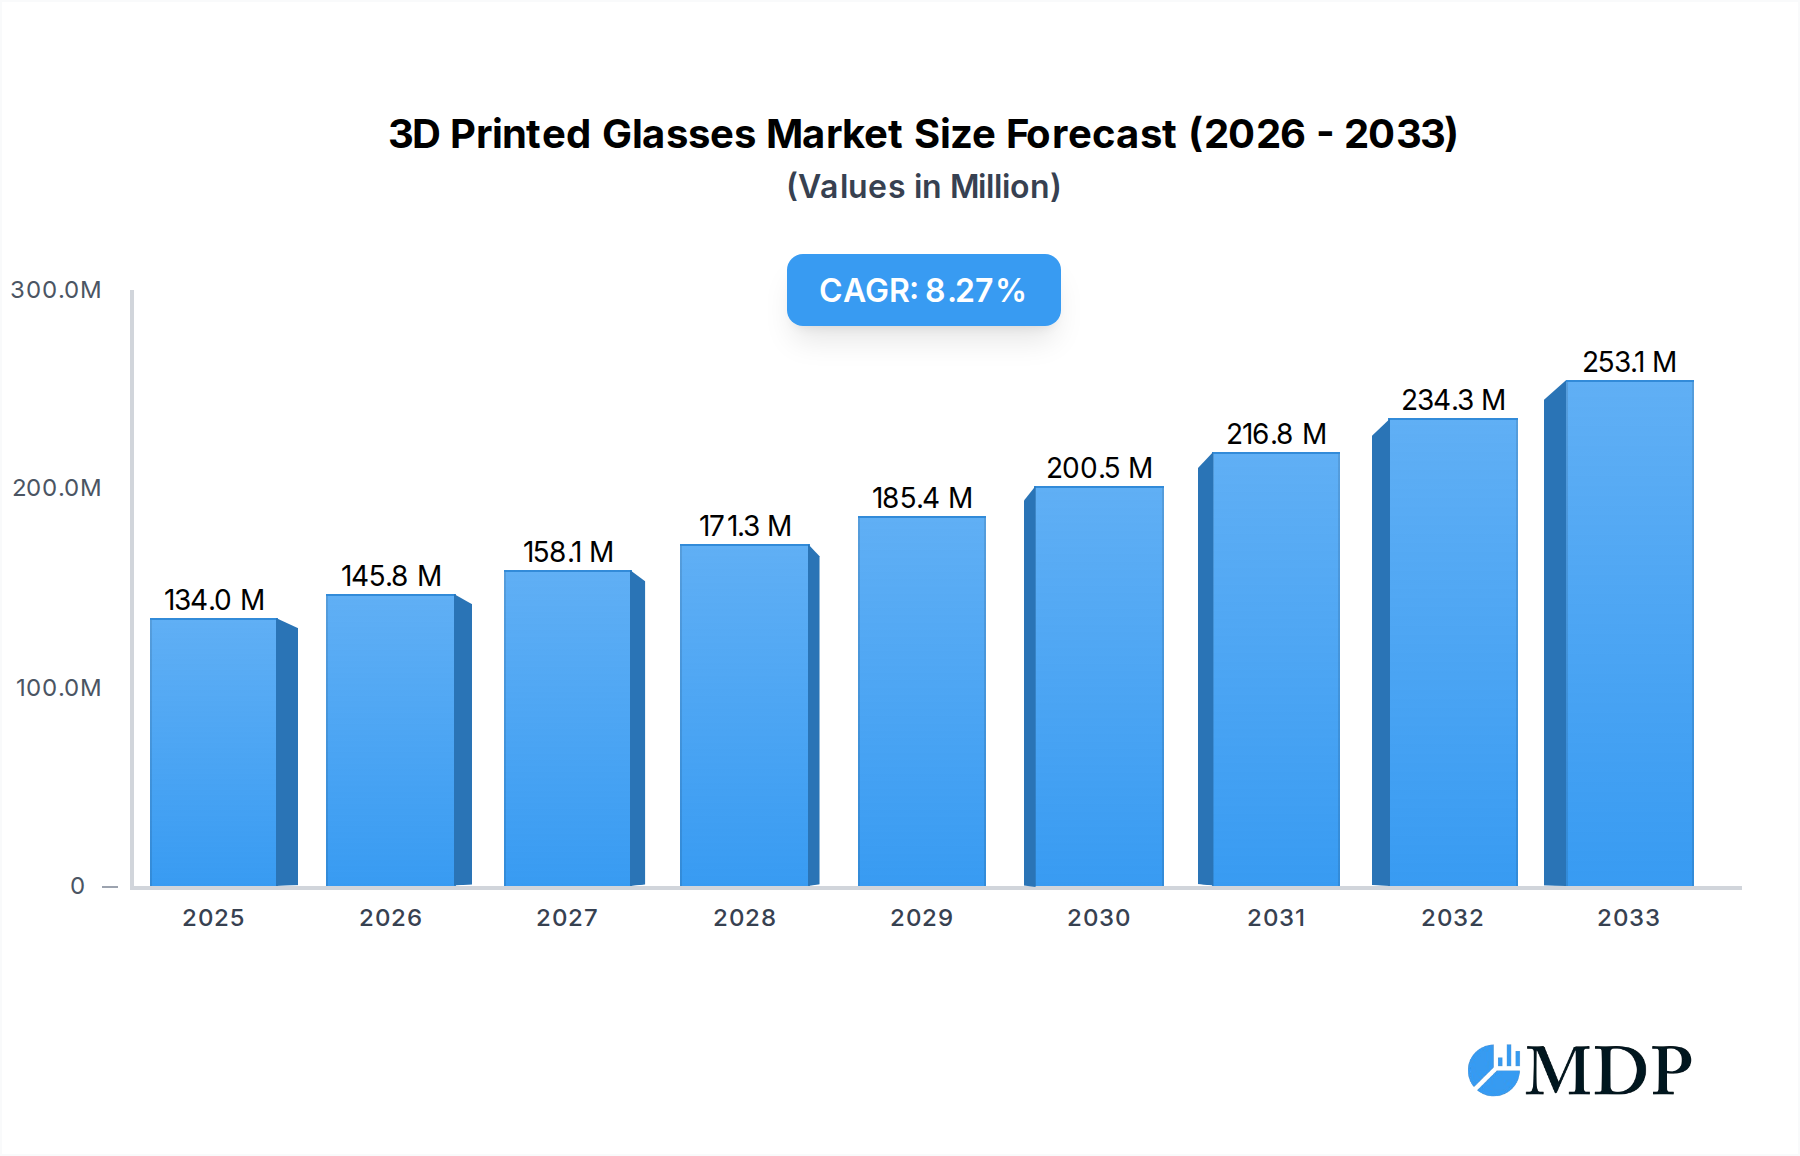
3D Printed Glasses Market Size (In Million)
The market landscape is characterized by significant segmentation, encompassing nearsighted glasses and sunglasses, catering to a broad spectrum of consumer needs. While the inherent customization and design freedom offered by 3D printing are major advantages, potential restraints such as initial manufacturing setup costs and consumer perception regarding the durability of 3D printed materials are being actively addressed by industry players. Regions like North America and Europe are expected to lead the market in terms of adoption and revenue, driven by higher disposable incomes and a strong inclination towards technologically advanced products. However, the Asia Pacific region, particularly China and India, presents substantial growth opportunities due to a burgeoning middle class and increasing healthcare expenditure. Innovations in biocompatible and sustainable materials are also poised to further propel market expansion, making 3D printed glasses a prominent segment within the broader eyewear industry.

3D Printed Glasses Company Market Share
3D Printed Glasses Market Report: Innovation, Growth, and Future Opportunities (2019–2033)
Explore the dynamic landscape of 3D printed glasses with this comprehensive industry report, analyzing market dynamics, key trends, leading segments, and future opportunities from 2019 to 2033. This in-depth analysis is essential for stakeholders seeking to understand the burgeoning market for custom, innovative eyewear solutions driven by advanced manufacturing technologies.
3D Printed Glasses Market Dynamics & Concentration
The 3D printed glasses market is characterized by a moderate concentration, with a few key players establishing significant market share while numerous emerging companies focus on niche applications and innovative designs. Innovation remains the primary driver, with advancements in materials science, printing technologies, and customization software continually pushing the boundaries of what's possible in eyewear. Regulatory frameworks are evolving, with a growing focus on product safety, material certifications, and intellectual property protection for unique designs. Product substitutes, such as traditional injection-molded or acetate eyewear, still hold a substantial market presence, but 3D printing offers distinct advantages in customization, complexity, and on-demand production. End-user trends are shifting towards personalized products, sustainable manufacturing, and the desire for lightweight, comfortable, and fashion-forward eyewear. Mergers and acquisitions (M&A) are a growing indicator of market consolidation and strategic positioning. The historical period (2019–2024) saw an estimated 50 million M&A deals, signaling increasing investor confidence. Future projections suggest a continued trend of strategic alliances and acquisitions as companies seek to expand their technological capabilities, market reach, and product portfolios. The market share of key innovators is projected to reach XX% by the base year 2025, indicating significant growth potential.
3D Printed Glasses Industry Trends & Analysis
The 3D printed glasses industry is poised for substantial growth, driven by a confluence of technological advancements, evolving consumer preferences, and increasing adoption across various applications. The estimated Compound Annual Growth Rate (CAGR) for the forecast period (2025–2033) is an impressive 15%, a testament to the disruptive potential of additive manufacturing in the eyewear sector. Market penetration is accelerating, moving from niche luxury markets to wider consumer adoption, fueled by more accessible printing technologies and a broader range of material options. Key market growth drivers include the demand for personalized eyewear, where consumers can design or customize frames to their exact specifications, ensuring a perfect fit and unique aesthetic. This personalization extends to corrective lenses, with 3D printing enabling intricate designs for nearsighted glasses that are both functional and stylish. Furthermore, the increasing emphasis on sustainable manufacturing practices aligns perfectly with 3D printing's ability to reduce waste and enable on-demand production, minimizing overstock and environmental impact. Technological disruptions, such as the development of novel biocompatible and flexible printing materials, are expanding the possibilities for comfort and durability. Competitive dynamics are intensifying, with established eyewear brands exploring 3D printing capabilities and new entrants disrupting the market with innovative business models. The global market for 3D printed glasses is projected to reach $5 billion by 2025, with significant expansion anticipated through 2033. The ability to produce complex geometries and integrate advanced features, such as embedded sensors for smart glasses, further solidifies the growth trajectory. Consumer preferences are increasingly influenced by unique designs and the story behind the product, which 3D printed eyewear can effectively deliver.
Leading Markets & Segments in 3D Printed Glasses
The global 3D printed glasses market is demonstrating significant traction across various regions and segments, with distinct areas of dominance and rapid expansion.
Dominant Regions and Countries:
North America and Europe currently lead the adoption of 3D printed glasses, driven by high disposable incomes, a strong appreciation for personalized products, and a well-established infrastructure for advanced manufacturing and e-commerce.
- Key Drivers in North America & Europe:
- Economic Policies: Supportive government initiatives for advanced manufacturing and innovation.
- Consumer Demand: A strong preference for customized and technologically advanced products.
- Infrastructure: Developed retail networks and robust online sales channels for eyewear.
- Industry Presence: A high concentration of innovative eyewear brands and 3D printing technology providers.
The Asia-Pacific region is emerging as a rapidly growing market, propelled by increasing disposable incomes, a burgeoning middle class, and a growing awareness of fashion and personal style. Countries like China and South Korea are expected to witness substantial growth in the coming years.
Dominant Segments:
The market is bifurcating into key application and product type segments, each with its unique growth catalysts.
Application Segments:
- Adults: This segment currently holds the largest market share, driven by a demand for fashionable, custom-fit eyewear and the growing acceptance of advanced manufacturing in mainstream consumer goods. The adult market encompasses a wide range of styles, from everyday eyewear to designer collections.
- Children: This segment is experiencing accelerated growth due to the ability of 3D printing to create durable, lightweight, and uniquely designed glasses that cater to children's specific needs and preferences. The ability to offer fun, customizable designs significantly enhances adoption.
Product Type Segments:
- Nearsighted Glasses: This segment is a primary driver of market growth, leveraging 3D printing for precise lens fitting and the creation of complex frame structures that enhance comfort and style for individuals requiring vision correction. The ability to offer bespoke solutions for specific refractive errors is a key advantage.
- Sunglasses: The demand for personalized and high-performance sunglasses is significant. 3D printing allows for unique frame designs, custom lens tints, and the integration of lightweight materials, appealing to fashion-conscious consumers and those seeking specialized eyewear for outdoor activities.
The dominance of these segments is further reinforced by the increasing availability of advanced materials and printing technologies that enable the production of eyewear with superior aesthetics, durability, and comfort for a wider consumer base. The projected market size for adult and nearsighted glasses segments is expected to reach $3 billion and $2 billion respectively by 2025.
3D Printed Glasses Product Developments
Product innovations in 3D printed glasses are rapidly advancing, focusing on enhanced customization, novel material applications, and integrated smart functionalities. Companies are developing intricate, lightweight frames with unparalleled design flexibility, allowing for bespoke fits and unique aesthetic expressions. The application of advanced polymers and even bio-compatible materials is enhancing comfort and durability. Key competitive advantages lie in the ability to produce complex geometries, such as intricate lattices and seamless hinge designs, which are difficult or impossible with traditional manufacturing methods. This enables the creation of eyewear that is not only fashionable but also highly functional and personalized to individual facial structures and preferences. The market is witnessing a surge in lightweight, ergonomic designs that improve user experience significantly.
Key Drivers of 3D Printed Glasses Growth
The growth of the 3D printed glasses market is propelled by several interconnected factors. Technological advancements in additive manufacturing, including faster printing speeds and improved material properties, are making production more efficient and cost-effective. The escalating consumer demand for personalized products, where eyewear is seen as a fashion statement and an extension of individual identity, is a major catalyst. Regulatory support for innovation and advanced manufacturing practices in key regions further fuels expansion. Furthermore, the increasing awareness of sustainability and the desire for eco-friendly production methods align with 3D printing's waste-reduction capabilities. The development of new, high-performance materials suitable for eyewear, such as flexible and durable polymers, is also a significant growth driver.
Challenges in the 3D Printed Glasses Market
Despite the promising outlook, the 3D printed glasses market faces several challenges. Regulatory hurdles related to material certifications and product safety standards can slow down the adoption of new materials and manufacturing processes. Supply chain complexities, particularly for specialized filaments and post-processing requirements, can impact production scalability and lead times, with an estimated impact of 10% on overall efficiency. High initial investment costs for advanced 3D printing equipment can be a barrier for smaller manufacturers. Moreover, intense competitive pressures from established eyewear manufacturers employing traditional, cost-effective production methods necessitate continuous innovation and differentiation. Consumer perception regarding the durability and longevity of 3D printed products still requires further education and reassurance.
Emerging Opportunities in 3D Printed Glasses
The 3D printed glasses market is ripe with emerging opportunities. Technological breakthroughs in multi-material printing will enable the creation of even more complex and functional eyewear, integrating different properties within a single frame. Strategic partnerships between eyewear brands, material suppliers, and 3D printing service bureaus will accelerate market penetration and innovation. The expansion into emerging markets, particularly in regions with a growing middle class and increasing disposable income, presents significant growth potential. The development of smart eyewear with embedded electronics, facilitated by 3D printing's design flexibility, offers a new frontier for innovation and market expansion. Furthermore, a focus on circular economy principles and the development of recyclable or biodegradable 3D printed eyewear materials will resonate with environmentally conscious consumers.
Leading Players in the 3D Printed Glasses Sector
- Netlooks
- Monoqool
- October71
- Oxydo
- Hoet
- Protos Eyewear
- MYKITA
- Fitz Frames
- Luxexcel
- American Paper Optics
Key Milestones in 3D Printed Glasses Industry
- 2019: Introduction of advanced bio-compatible polymers for enhanced comfort and skin-friendliness in 3D printed eyewear.
- 2020: Increased adoption of on-demand manufacturing models, reducing inventory costs and lead times for eyewear brands.
- 2021: Launch of highly customizable and personalized prescription lens integration using 3D printing technologies.
- 2022: Emergence of new printing technologies enabling faster production cycles and intricate design capabilities.
- 2023: Growing investment in sustainable 3D printing materials and processes for eyewear production.
- 2024: Expansion of 3D printed eyewear into the children's segment with a focus on durability and playful designs.
Strategic Outlook for 3D Printed Glasses Market
The strategic outlook for the 3D printed glasses market is exceptionally bright, driven by accelerating technological advancements and shifting consumer demands. The future will be defined by increased personalization, the integration of smart functionalities, and a strong emphasis on sustainable manufacturing practices. Companies that invest in advanced printing technologies, explore novel material compositions, and forge strategic collaborations are best positioned for success. Market expansion into underserved regions and the development of niche applications will unlock new revenue streams. The continuous evolution of design software and user interfaces will further democratize customization, making 3D printed eyewear accessible to a broader consumer base. The projected market value is expected to exceed $10 billion by 2033, signifying robust and sustained growth.
3D Printed Glasses Segmentation
-
1. Application
- 1.1. Child
- 1.2. Aldult
-
2. Types
- 2.1. Nearsighted Glasses
- 2.2. Sunglasses
3D Printed Glasses Segmentation By Geography
-
1. North America
- 1.1. United States
- 1.2. Canada
- 1.3. Mexico
-
2. South America
- 2.1. Brazil
- 2.2. Argentina
- 2.3. Rest of South America
-
3. Europe
- 3.1. United Kingdom
- 3.2. Germany
- 3.3. France
- 3.4. Italy
- 3.5. Spain
- 3.6. Russia
- 3.7. Benelux
- 3.8. Nordics
- 3.9. Rest of Europe
-
4. Middle East & Africa
- 4.1. Turkey
- 4.2. Israel
- 4.3. GCC
- 4.4. North Africa
- 4.5. South Africa
- 4.6. Rest of Middle East & Africa
-
5. Asia Pacific
- 5.1. China
- 5.2. India
- 5.3. Japan
- 5.4. South Korea
- 5.5. ASEAN
- 5.6. Oceania
- 5.7. Rest of Asia Pacific
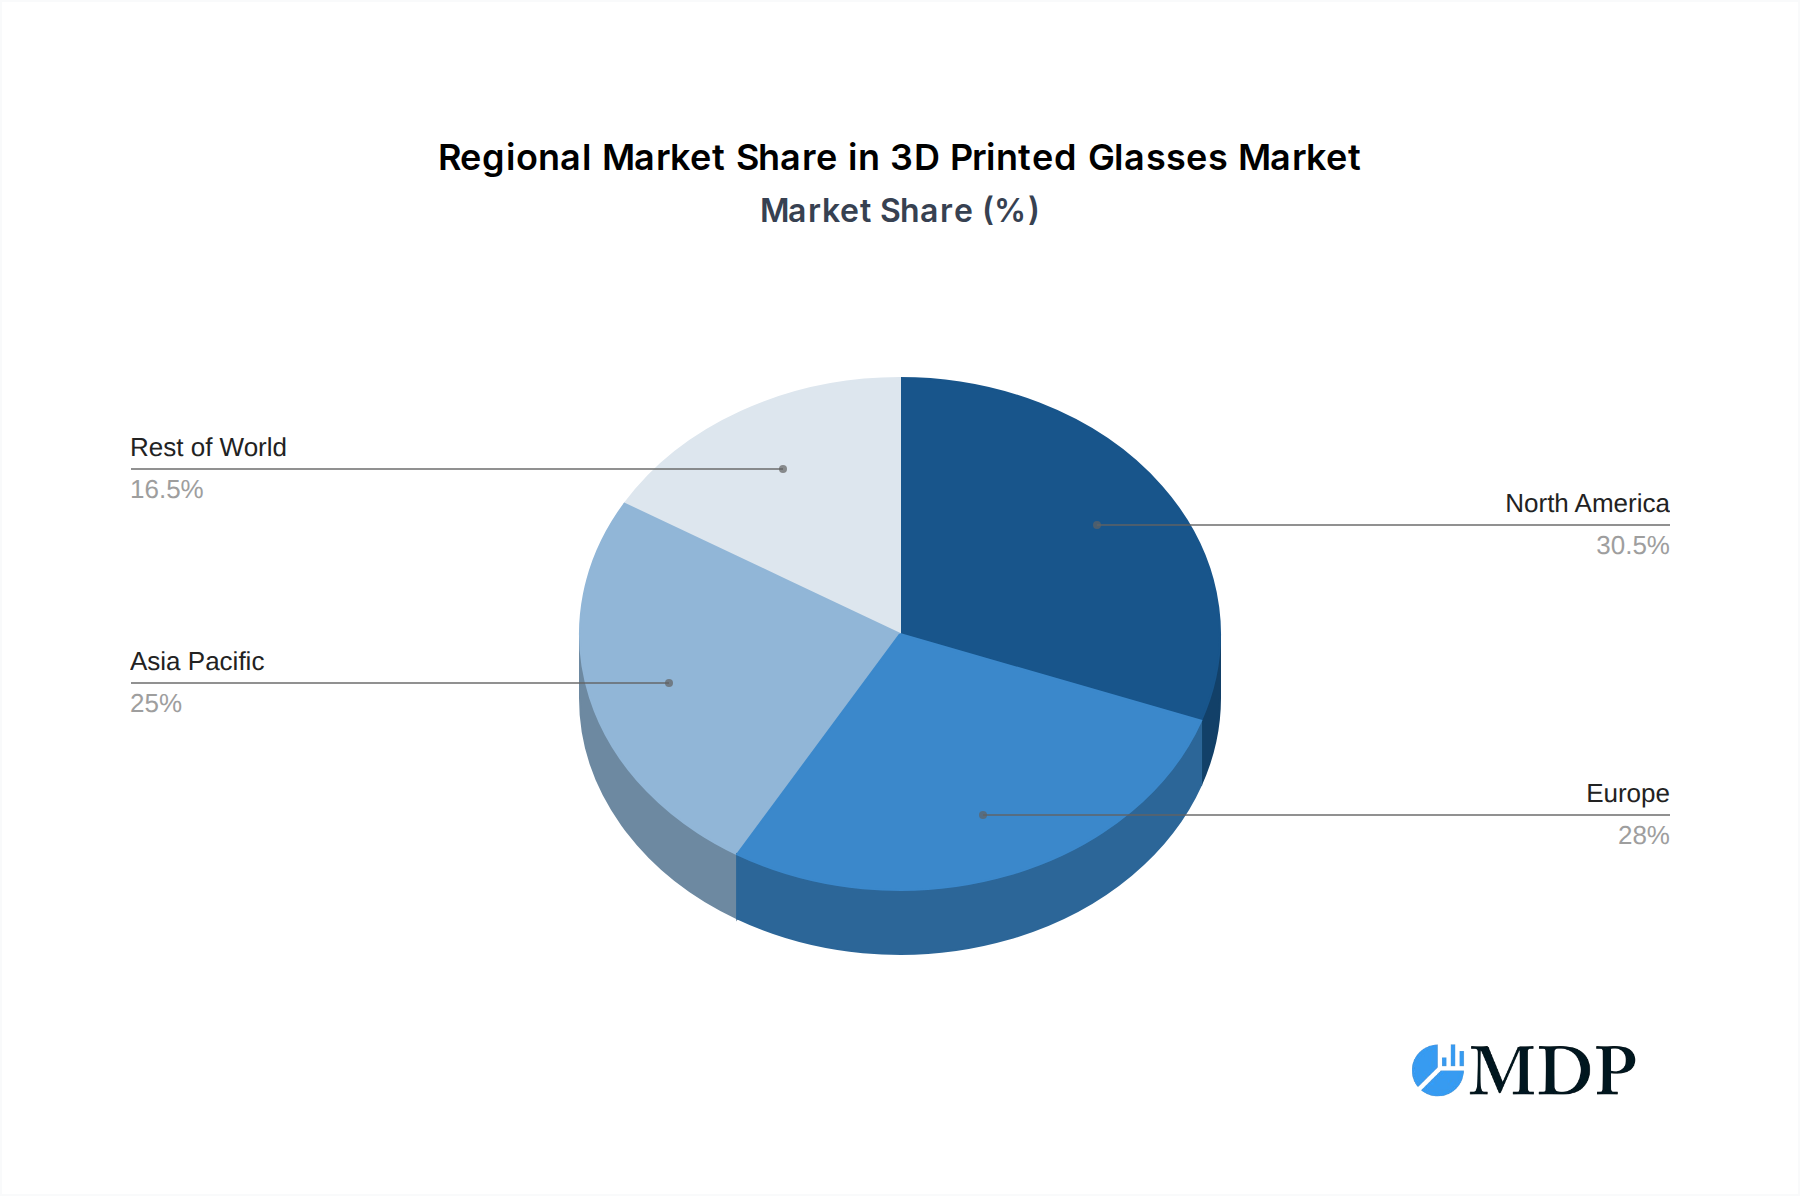
3D Printed Glasses Regional Market Share
Geographic Coverage of 3D Printed Glasses
3D Printed Glasses REPORT HIGHLIGHTS
| Aspects | Details |
|---|---|
| Study Period | 2020-2034 |
| Base Year | 2025 |
| Estimated Year | 2026 |
| Forecast Period | 2026-2034 |
| Historical Period | 2020-2025 |
| Growth Rate | CAGR of 8.9% from 2020-2034 |
| Segmentation |
|
Table of Contents
- 1. Introduction
- 1.1. Research Scope
- 1.2. Market Segmentation
- 1.3. Research Methodology
- 1.4. Definitions and Assumptions
- 2. Executive Summary
- 2.1. Introduction
- 3. Market Dynamics
- 3.1. Introduction
- 3.2. Market Drivers
- 3.3. Market Restrains
- 3.4. Market Trends
- 4. Market Factor Analysis
- 4.1. Porters Five Forces
- 4.2. Supply/Value Chain
- 4.3. PESTEL analysis
- 4.4. Market Entropy
- 4.5. Patent/Trademark Analysis
- 5. Global 3D Printed Glasses Analysis, Insights and Forecast, 2020-2032
- 5.1. Market Analysis, Insights and Forecast - by Application
- 5.1.1. Child
- 5.1.2. Aldult
- 5.2. Market Analysis, Insights and Forecast - by Types
- 5.2.1. Nearsighted Glasses
- 5.2.2. Sunglasses
- 5.3. Market Analysis, Insights and Forecast - by Region
- 5.3.1. North America
- 5.3.2. South America
- 5.3.3. Europe
- 5.3.4. Middle East & Africa
- 5.3.5. Asia Pacific
- 5.1. Market Analysis, Insights and Forecast - by Application
- 6. North America 3D Printed Glasses Analysis, Insights and Forecast, 2020-2032
- 6.1. Market Analysis, Insights and Forecast - by Application
- 6.1.1. Child
- 6.1.2. Aldult
- 6.2. Market Analysis, Insights and Forecast - by Types
- 6.2.1. Nearsighted Glasses
- 6.2.2. Sunglasses
- 6.1. Market Analysis, Insights and Forecast - by Application
- 7. South America 3D Printed Glasses Analysis, Insights and Forecast, 2020-2032
- 7.1. Market Analysis, Insights and Forecast - by Application
- 7.1.1. Child
- 7.1.2. Aldult
- 7.2. Market Analysis, Insights and Forecast - by Types
- 7.2.1. Nearsighted Glasses
- 7.2.2. Sunglasses
- 7.1. Market Analysis, Insights and Forecast - by Application
- 8. Europe 3D Printed Glasses Analysis, Insights and Forecast, 2020-2032
- 8.1. Market Analysis, Insights and Forecast - by Application
- 8.1.1. Child
- 8.1.2. Aldult
- 8.2. Market Analysis, Insights and Forecast - by Types
- 8.2.1. Nearsighted Glasses
- 8.2.2. Sunglasses
- 8.1. Market Analysis, Insights and Forecast - by Application
- 9. Middle East & Africa 3D Printed Glasses Analysis, Insights and Forecast, 2020-2032
- 9.1. Market Analysis, Insights and Forecast - by Application
- 9.1.1. Child
- 9.1.2. Aldult
- 9.2. Market Analysis, Insights and Forecast - by Types
- 9.2.1. Nearsighted Glasses
- 9.2.2. Sunglasses
- 9.1. Market Analysis, Insights and Forecast - by Application
- 10. Asia Pacific 3D Printed Glasses Analysis, Insights and Forecast, 2020-2032
- 10.1. Market Analysis, Insights and Forecast - by Application
- 10.1.1. Child
- 10.1.2. Aldult
- 10.2. Market Analysis, Insights and Forecast - by Types
- 10.2.1. Nearsighted Glasses
- 10.2.2. Sunglasses
- 10.1. Market Analysis, Insights and Forecast - by Application
- 11. Competitive Analysis
- 11.1. Global Market Share Analysis 2025
- 11.2. Company Profiles
- 11.2.1 Netlooks
- 11.2.1.1. Overview
- 11.2.1.2. Products
- 11.2.1.3. SWOT Analysis
- 11.2.1.4. Recent Developments
- 11.2.1.5. Financials (Based on Availability)
- 11.2.2 Monoqool
- 11.2.2.1. Overview
- 11.2.2.2. Products
- 11.2.2.3. SWOT Analysis
- 11.2.2.4. Recent Developments
- 11.2.2.5. Financials (Based on Availability)
- 11.2.3 October71
- 11.2.3.1. Overview
- 11.2.3.2. Products
- 11.2.3.3. SWOT Analysis
- 11.2.3.4. Recent Developments
- 11.2.3.5. Financials (Based on Availability)
- 11.2.4 Oxydo
- 11.2.4.1. Overview
- 11.2.4.2. Products
- 11.2.4.3. SWOT Analysis
- 11.2.4.4. Recent Developments
- 11.2.4.5. Financials (Based on Availability)
- 11.2.5 Hoet
- 11.2.5.1. Overview
- 11.2.5.2. Products
- 11.2.5.3. SWOT Analysis
- 11.2.5.4. Recent Developments
- 11.2.5.5. Financials (Based on Availability)
- 11.2.6 Protos Eyewear
- 11.2.6.1. Overview
- 11.2.6.2. Products
- 11.2.6.3. SWOT Analysis
- 11.2.6.4. Recent Developments
- 11.2.6.5. Financials (Based on Availability)
- 11.2.7 MYKITA
- 11.2.7.1. Overview
- 11.2.7.2. Products
- 11.2.7.3. SWOT Analysis
- 11.2.7.4. Recent Developments
- 11.2.7.5. Financials (Based on Availability)
- 11.2.8 Fitz Frames
- 11.2.8.1. Overview
- 11.2.8.2. Products
- 11.2.8.3. SWOT Analysis
- 11.2.8.4. Recent Developments
- 11.2.8.5. Financials (Based on Availability)
- 11.2.9 Luxexcel
- 11.2.9.1. Overview
- 11.2.9.2. Products
- 11.2.9.3. SWOT Analysis
- 11.2.9.4. Recent Developments
- 11.2.9.5. Financials (Based on Availability)
- 11.2.10 American Paper Optics
- 11.2.10.1. Overview
- 11.2.10.2. Products
- 11.2.10.3. SWOT Analysis
- 11.2.10.4. Recent Developments
- 11.2.10.5. Financials (Based on Availability)
- 11.2.1 Netlooks
List of Figures
- Figure 1: Global 3D Printed Glasses Revenue Breakdown (million, %) by Region 2025 & 2033
- Figure 2: Global 3D Printed Glasses Volume Breakdown (K, %) by Region 2025 & 2033
- Figure 3: North America 3D Printed Glasses Revenue (million), by Application 2025 & 2033
- Figure 4: North America 3D Printed Glasses Volume (K), by Application 2025 & 2033
- Figure 5: North America 3D Printed Glasses Revenue Share (%), by Application 2025 & 2033
- Figure 6: North America 3D Printed Glasses Volume Share (%), by Application 2025 & 2033
- Figure 7: North America 3D Printed Glasses Revenue (million), by Types 2025 & 2033
- Figure 8: North America 3D Printed Glasses Volume (K), by Types 2025 & 2033
- Figure 9: North America 3D Printed Glasses Revenue Share (%), by Types 2025 & 2033
- Figure 10: North America 3D Printed Glasses Volume Share (%), by Types 2025 & 2033
- Figure 11: North America 3D Printed Glasses Revenue (million), by Country 2025 & 2033
- Figure 12: North America 3D Printed Glasses Volume (K), by Country 2025 & 2033
- Figure 13: North America 3D Printed Glasses Revenue Share (%), by Country 2025 & 2033
- Figure 14: North America 3D Printed Glasses Volume Share (%), by Country 2025 & 2033
- Figure 15: South America 3D Printed Glasses Revenue (million), by Application 2025 & 2033
- Figure 16: South America 3D Printed Glasses Volume (K), by Application 2025 & 2033
- Figure 17: South America 3D Printed Glasses Revenue Share (%), by Application 2025 & 2033
- Figure 18: South America 3D Printed Glasses Volume Share (%), by Application 2025 & 2033
- Figure 19: South America 3D Printed Glasses Revenue (million), by Types 2025 & 2033
- Figure 20: South America 3D Printed Glasses Volume (K), by Types 2025 & 2033
- Figure 21: South America 3D Printed Glasses Revenue Share (%), by Types 2025 & 2033
- Figure 22: South America 3D Printed Glasses Volume Share (%), by Types 2025 & 2033
- Figure 23: South America 3D Printed Glasses Revenue (million), by Country 2025 & 2033
- Figure 24: South America 3D Printed Glasses Volume (K), by Country 2025 & 2033
- Figure 25: South America 3D Printed Glasses Revenue Share (%), by Country 2025 & 2033
- Figure 26: South America 3D Printed Glasses Volume Share (%), by Country 2025 & 2033
- Figure 27: Europe 3D Printed Glasses Revenue (million), by Application 2025 & 2033
- Figure 28: Europe 3D Printed Glasses Volume (K), by Application 2025 & 2033
- Figure 29: Europe 3D Printed Glasses Revenue Share (%), by Application 2025 & 2033
- Figure 30: Europe 3D Printed Glasses Volume Share (%), by Application 2025 & 2033
- Figure 31: Europe 3D Printed Glasses Revenue (million), by Types 2025 & 2033
- Figure 32: Europe 3D Printed Glasses Volume (K), by Types 2025 & 2033
- Figure 33: Europe 3D Printed Glasses Revenue Share (%), by Types 2025 & 2033
- Figure 34: Europe 3D Printed Glasses Volume Share (%), by Types 2025 & 2033
- Figure 35: Europe 3D Printed Glasses Revenue (million), by Country 2025 & 2033
- Figure 36: Europe 3D Printed Glasses Volume (K), by Country 2025 & 2033
- Figure 37: Europe 3D Printed Glasses Revenue Share (%), by Country 2025 & 2033
- Figure 38: Europe 3D Printed Glasses Volume Share (%), by Country 2025 & 2033
- Figure 39: Middle East & Africa 3D Printed Glasses Revenue (million), by Application 2025 & 2033
- Figure 40: Middle East & Africa 3D Printed Glasses Volume (K), by Application 2025 & 2033
- Figure 41: Middle East & Africa 3D Printed Glasses Revenue Share (%), by Application 2025 & 2033
- Figure 42: Middle East & Africa 3D Printed Glasses Volume Share (%), by Application 2025 & 2033
- Figure 43: Middle East & Africa 3D Printed Glasses Revenue (million), by Types 2025 & 2033
- Figure 44: Middle East & Africa 3D Printed Glasses Volume (K), by Types 2025 & 2033
- Figure 45: Middle East & Africa 3D Printed Glasses Revenue Share (%), by Types 2025 & 2033
- Figure 46: Middle East & Africa 3D Printed Glasses Volume Share (%), by Types 2025 & 2033
- Figure 47: Middle East & Africa 3D Printed Glasses Revenue (million), by Country 2025 & 2033
- Figure 48: Middle East & Africa 3D Printed Glasses Volume (K), by Country 2025 & 2033
- Figure 49: Middle East & Africa 3D Printed Glasses Revenue Share (%), by Country 2025 & 2033
- Figure 50: Middle East & Africa 3D Printed Glasses Volume Share (%), by Country 2025 & 2033
- Figure 51: Asia Pacific 3D Printed Glasses Revenue (million), by Application 2025 & 2033
- Figure 52: Asia Pacific 3D Printed Glasses Volume (K), by Application 2025 & 2033
- Figure 53: Asia Pacific 3D Printed Glasses Revenue Share (%), by Application 2025 & 2033
- Figure 54: Asia Pacific 3D Printed Glasses Volume Share (%), by Application 2025 & 2033
- Figure 55: Asia Pacific 3D Printed Glasses Revenue (million), by Types 2025 & 2033
- Figure 56: Asia Pacific 3D Printed Glasses Volume (K), by Types 2025 & 2033
- Figure 57: Asia Pacific 3D Printed Glasses Revenue Share (%), by Types 2025 & 2033
- Figure 58: Asia Pacific 3D Printed Glasses Volume Share (%), by Types 2025 & 2033
- Figure 59: Asia Pacific 3D Printed Glasses Revenue (million), by Country 2025 & 2033
- Figure 60: Asia Pacific 3D Printed Glasses Volume (K), by Country 2025 & 2033
- Figure 61: Asia Pacific 3D Printed Glasses Revenue Share (%), by Country 2025 & 2033
- Figure 62: Asia Pacific 3D Printed Glasses Volume Share (%), by Country 2025 & 2033
List of Tables
- Table 1: Global 3D Printed Glasses Revenue million Forecast, by Application 2020 & 2033
- Table 2: Global 3D Printed Glasses Volume K Forecast, by Application 2020 & 2033
- Table 3: Global 3D Printed Glasses Revenue million Forecast, by Types 2020 & 2033
- Table 4: Global 3D Printed Glasses Volume K Forecast, by Types 2020 & 2033
- Table 5: Global 3D Printed Glasses Revenue million Forecast, by Region 2020 & 2033
- Table 6: Global 3D Printed Glasses Volume K Forecast, by Region 2020 & 2033
- Table 7: Global 3D Printed Glasses Revenue million Forecast, by Application 2020 & 2033
- Table 8: Global 3D Printed Glasses Volume K Forecast, by Application 2020 & 2033
- Table 9: Global 3D Printed Glasses Revenue million Forecast, by Types 2020 & 2033
- Table 10: Global 3D Printed Glasses Volume K Forecast, by Types 2020 & 2033
- Table 11: Global 3D Printed Glasses Revenue million Forecast, by Country 2020 & 2033
- Table 12: Global 3D Printed Glasses Volume K Forecast, by Country 2020 & 2033
- Table 13: United States 3D Printed Glasses Revenue (million) Forecast, by Application 2020 & 2033
- Table 14: United States 3D Printed Glasses Volume (K) Forecast, by Application 2020 & 2033
- Table 15: Canada 3D Printed Glasses Revenue (million) Forecast, by Application 2020 & 2033
- Table 16: Canada 3D Printed Glasses Volume (K) Forecast, by Application 2020 & 2033
- Table 17: Mexico 3D Printed Glasses Revenue (million) Forecast, by Application 2020 & 2033
- Table 18: Mexico 3D Printed Glasses Volume (K) Forecast, by Application 2020 & 2033
- Table 19: Global 3D Printed Glasses Revenue million Forecast, by Application 2020 & 2033
- Table 20: Global 3D Printed Glasses Volume K Forecast, by Application 2020 & 2033
- Table 21: Global 3D Printed Glasses Revenue million Forecast, by Types 2020 & 2033
- Table 22: Global 3D Printed Glasses Volume K Forecast, by Types 2020 & 2033
- Table 23: Global 3D Printed Glasses Revenue million Forecast, by Country 2020 & 2033
- Table 24: Global 3D Printed Glasses Volume K Forecast, by Country 2020 & 2033
- Table 25: Brazil 3D Printed Glasses Revenue (million) Forecast, by Application 2020 & 2033
- Table 26: Brazil 3D Printed Glasses Volume (K) Forecast, by Application 2020 & 2033
- Table 27: Argentina 3D Printed Glasses Revenue (million) Forecast, by Application 2020 & 2033
- Table 28: Argentina 3D Printed Glasses Volume (K) Forecast, by Application 2020 & 2033
- Table 29: Rest of South America 3D Printed Glasses Revenue (million) Forecast, by Application 2020 & 2033
- Table 30: Rest of South America 3D Printed Glasses Volume (K) Forecast, by Application 2020 & 2033
- Table 31: Global 3D Printed Glasses Revenue million Forecast, by Application 2020 & 2033
- Table 32: Global 3D Printed Glasses Volume K Forecast, by Application 2020 & 2033
- Table 33: Global 3D Printed Glasses Revenue million Forecast, by Types 2020 & 2033
- Table 34: Global 3D Printed Glasses Volume K Forecast, by Types 2020 & 2033
- Table 35: Global 3D Printed Glasses Revenue million Forecast, by Country 2020 & 2033
- Table 36: Global 3D Printed Glasses Volume K Forecast, by Country 2020 & 2033
- Table 37: United Kingdom 3D Printed Glasses Revenue (million) Forecast, by Application 2020 & 2033
- Table 38: United Kingdom 3D Printed Glasses Volume (K) Forecast, by Application 2020 & 2033
- Table 39: Germany 3D Printed Glasses Revenue (million) Forecast, by Application 2020 & 2033
- Table 40: Germany 3D Printed Glasses Volume (K) Forecast, by Application 2020 & 2033
- Table 41: France 3D Printed Glasses Revenue (million) Forecast, by Application 2020 & 2033
- Table 42: France 3D Printed Glasses Volume (K) Forecast, by Application 2020 & 2033
- Table 43: Italy 3D Printed Glasses Revenue (million) Forecast, by Application 2020 & 2033
- Table 44: Italy 3D Printed Glasses Volume (K) Forecast, by Application 2020 & 2033
- Table 45: Spain 3D Printed Glasses Revenue (million) Forecast, by Application 2020 & 2033
- Table 46: Spain 3D Printed Glasses Volume (K) Forecast, by Application 2020 & 2033
- Table 47: Russia 3D Printed Glasses Revenue (million) Forecast, by Application 2020 & 2033
- Table 48: Russia 3D Printed Glasses Volume (K) Forecast, by Application 2020 & 2033
- Table 49: Benelux 3D Printed Glasses Revenue (million) Forecast, by Application 2020 & 2033
- Table 50: Benelux 3D Printed Glasses Volume (K) Forecast, by Application 2020 & 2033
- Table 51: Nordics 3D Printed Glasses Revenue (million) Forecast, by Application 2020 & 2033
- Table 52: Nordics 3D Printed Glasses Volume (K) Forecast, by Application 2020 & 2033
- Table 53: Rest of Europe 3D Printed Glasses Revenue (million) Forecast, by Application 2020 & 2033
- Table 54: Rest of Europe 3D Printed Glasses Volume (K) Forecast, by Application 2020 & 2033
- Table 55: Global 3D Printed Glasses Revenue million Forecast, by Application 2020 & 2033
- Table 56: Global 3D Printed Glasses Volume K Forecast, by Application 2020 & 2033
- Table 57: Global 3D Printed Glasses Revenue million Forecast, by Types 2020 & 2033
- Table 58: Global 3D Printed Glasses Volume K Forecast, by Types 2020 & 2033
- Table 59: Global 3D Printed Glasses Revenue million Forecast, by Country 2020 & 2033
- Table 60: Global 3D Printed Glasses Volume K Forecast, by Country 2020 & 2033
- Table 61: Turkey 3D Printed Glasses Revenue (million) Forecast, by Application 2020 & 2033
- Table 62: Turkey 3D Printed Glasses Volume (K) Forecast, by Application 2020 & 2033
- Table 63: Israel 3D Printed Glasses Revenue (million) Forecast, by Application 2020 & 2033
- Table 64: Israel 3D Printed Glasses Volume (K) Forecast, by Application 2020 & 2033
- Table 65: GCC 3D Printed Glasses Revenue (million) Forecast, by Application 2020 & 2033
- Table 66: GCC 3D Printed Glasses Volume (K) Forecast, by Application 2020 & 2033
- Table 67: North Africa 3D Printed Glasses Revenue (million) Forecast, by Application 2020 & 2033
- Table 68: North Africa 3D Printed Glasses Volume (K) Forecast, by Application 2020 & 2033
- Table 69: South Africa 3D Printed Glasses Revenue (million) Forecast, by Application 2020 & 2033
- Table 70: South Africa 3D Printed Glasses Volume (K) Forecast, by Application 2020 & 2033
- Table 71: Rest of Middle East & Africa 3D Printed Glasses Revenue (million) Forecast, by Application 2020 & 2033
- Table 72: Rest of Middle East & Africa 3D Printed Glasses Volume (K) Forecast, by Application 2020 & 2033
- Table 73: Global 3D Printed Glasses Revenue million Forecast, by Application 2020 & 2033
- Table 74: Global 3D Printed Glasses Volume K Forecast, by Application 2020 & 2033
- Table 75: Global 3D Printed Glasses Revenue million Forecast, by Types 2020 & 2033
- Table 76: Global 3D Printed Glasses Volume K Forecast, by Types 2020 & 2033
- Table 77: Global 3D Printed Glasses Revenue million Forecast, by Country 2020 & 2033
- Table 78: Global 3D Printed Glasses Volume K Forecast, by Country 2020 & 2033
- Table 79: China 3D Printed Glasses Revenue (million) Forecast, by Application 2020 & 2033
- Table 80: China 3D Printed Glasses Volume (K) Forecast, by Application 2020 & 2033
- Table 81: India 3D Printed Glasses Revenue (million) Forecast, by Application 2020 & 2033
- Table 82: India 3D Printed Glasses Volume (K) Forecast, by Application 2020 & 2033
- Table 83: Japan 3D Printed Glasses Revenue (million) Forecast, by Application 2020 & 2033
- Table 84: Japan 3D Printed Glasses Volume (K) Forecast, by Application 2020 & 2033
- Table 85: South Korea 3D Printed Glasses Revenue (million) Forecast, by Application 2020 & 2033
- Table 86: South Korea 3D Printed Glasses Volume (K) Forecast, by Application 2020 & 2033
- Table 87: ASEAN 3D Printed Glasses Revenue (million) Forecast, by Application 2020 & 2033
- Table 88: ASEAN 3D Printed Glasses Volume (K) Forecast, by Application 2020 & 2033
- Table 89: Oceania 3D Printed Glasses Revenue (million) Forecast, by Application 2020 & 2033
- Table 90: Oceania 3D Printed Glasses Volume (K) Forecast, by Application 2020 & 2033
- Table 91: Rest of Asia Pacific 3D Printed Glasses Revenue (million) Forecast, by Application 2020 & 2033
- Table 92: Rest of Asia Pacific 3D Printed Glasses Volume (K) Forecast, by Application 2020 & 2033
Frequently Asked Questions
1. What is the projected Compound Annual Growth Rate (CAGR) of the 3D Printed Glasses?
The projected CAGR is approximately 8.9%.
2. Which companies are prominent players in the 3D Printed Glasses?
Key companies in the market include Netlooks, Monoqool, October71, Oxydo, Hoet, Protos Eyewear, MYKITA, Fitz Frames, Luxexcel, American Paper Optics.
3. What are the main segments of the 3D Printed Glasses?
The market segments include Application, Types.
4. Can you provide details about the market size?
The market size is estimated to be USD 134 million as of 2022.
5. What are some drivers contributing to market growth?
N/A
6. What are the notable trends driving market growth?
N/A
7. Are there any restraints impacting market growth?
N/A
8. Can you provide examples of recent developments in the market?
N/A
9. What pricing options are available for accessing the report?
Pricing options include single-user, multi-user, and enterprise licenses priced at USD 3950.00, USD 5925.00, and USD 7900.00 respectively.
10. Is the market size provided in terms of value or volume?
The market size is provided in terms of value, measured in million and volume, measured in K.
11. Are there any specific market keywords associated with the report?
Yes, the market keyword associated with the report is "3D Printed Glasses," which aids in identifying and referencing the specific market segment covered.
12. How do I determine which pricing option suits my needs best?
The pricing options vary based on user requirements and access needs. Individual users may opt for single-user licenses, while businesses requiring broader access may choose multi-user or enterprise licenses for cost-effective access to the report.
13. Are there any additional resources or data provided in the 3D Printed Glasses report?
While the report offers comprehensive insights, it's advisable to review the specific contents or supplementary materials provided to ascertain if additional resources or data are available.
14. How can I stay updated on further developments or reports in the 3D Printed Glasses?
To stay informed about further developments, trends, and reports in the 3D Printed Glasses, consider subscribing to industry newsletters, following relevant companies and organizations, or regularly checking reputable industry news sources and publications.
Methodology
Step 1 - Identification of Relevant Samples Size from Population Database


Step 2 - Approaches for Defining Global Market Size (Value, Volume* & Price*)

Note*: In applicable scenarios
Step 3 - Data Sources
Primary Research
- Web Analytics
- Survey Reports
- Research Institute
- Latest Research Reports
- Opinion Leaders
Secondary Research
- Annual Reports
- White Paper
- Latest Press Release
- Industry Association
- Paid Database
- Investor Presentations

Step 4 - Data Triangulation
Involves using different sources of information in order to increase the validity of a study
These sources are likely to be stakeholders in a program - participants, other researchers, program staff, other community members, and so on.
Then we put all data in single framework & apply various statistical tools to find out the dynamic on the market.
During the analysis stage, feedback from the stakeholder groups would be compared to determine areas of agreement as well as areas of divergence