

Key Insights
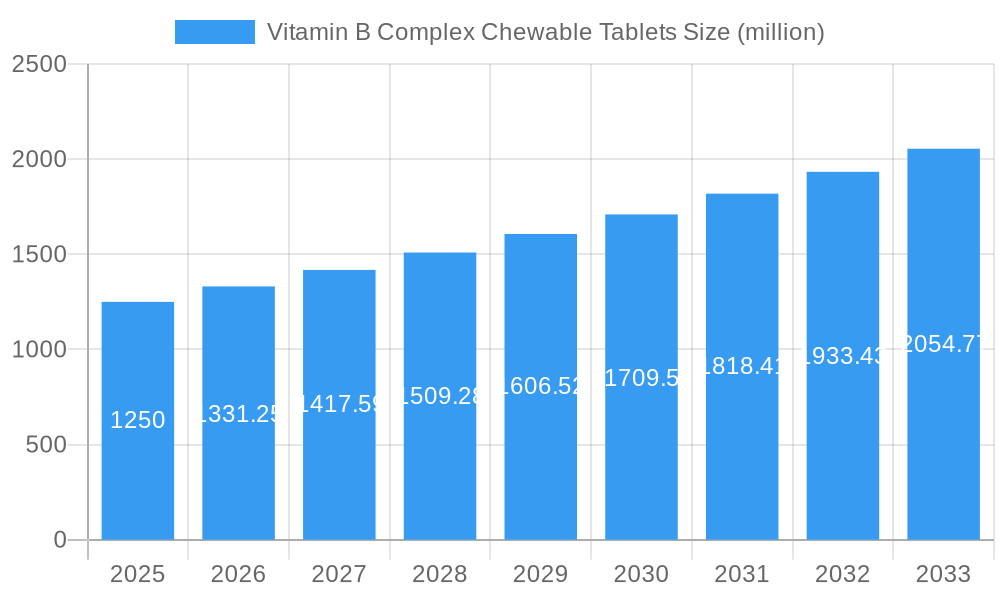
The global Vitamin B Complex Chewable Tablets market is projected for robust growth, with an estimated market size of USD 1,250 million in 2025, poised to expand at a Compound Annual Growth Rate (CAGR) of 6.5% through 2033. This dynamic market is primarily driven by an escalating consumer awareness regarding the crucial role of B vitamins in energy metabolism, nerve function, and overall well-being. The convenience and palatability of chewable tablets, particularly appealing to children and individuals with swallowing difficulties, are significant growth accelerators. Furthermore, the increasing prevalence of dietary deficiencies, coupled with a growing demand for convenient health supplements, is fueling market expansion. Key applications span both adult and pediatric segments, with 60-piece and 90-piece packaging formats dominating consumer preference due to their perceived value and extended usage.
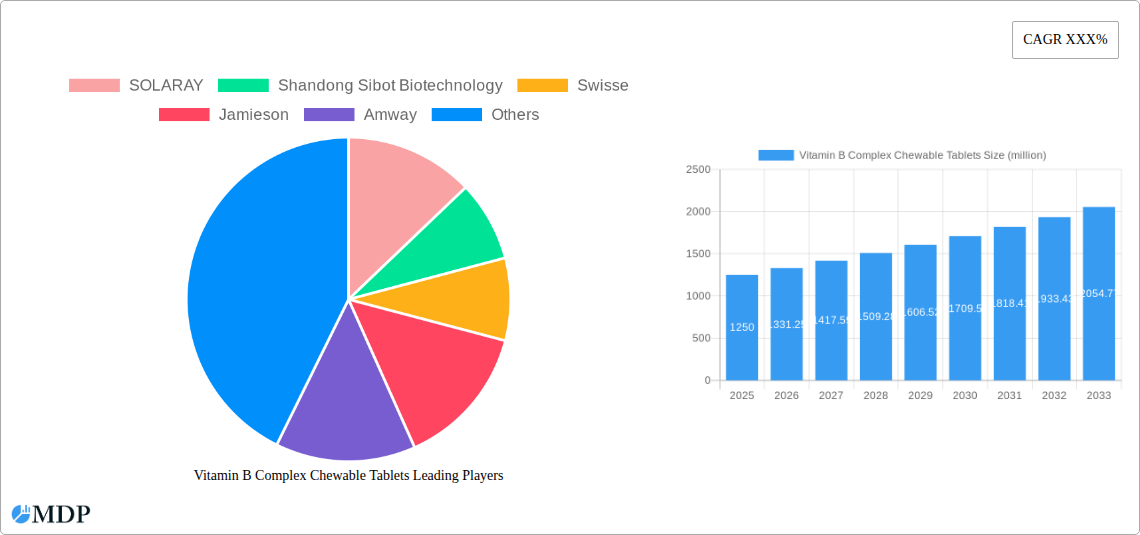
Vitamin B Complex Chewable Tablets Market Size (In Billion)
The market landscape is characterized by intense competition among established players such as SOLARAY, Swisse, Jamieson, Amway, and GNC Live Well, alongside emerging biotechnology firms like Shandong Sibot Biotechnology and Guangdong Kehuan Biotechnology. These companies are actively engaged in product innovation, focusing on enhanced formulations, natural ingredients, and attractive packaging to capture market share. Geographical trends indicate a strong presence in North America and Europe, driven by high disposable incomes and a well-established health and wellness culture. The Asia Pacific region, particularly China and India, presents a substantial growth opportunity due to a burgeoning middle class, increasing health consciousness, and a rising demand for dietary supplements. Restraints include stringent regulatory frameworks for dietary supplements in certain regions and the potential for product commoditization, necessitating continuous innovation and robust marketing strategies from industry participants.
Vitamin B Complex Chewable Tablets Company Market Share
Vitamin B Complex Chewable Tablets Market Dynamics & Concentration
The global Vitamin B Complex Chewable Tablets market exhibits a moderate concentration, with key players like SOLARAY, Shandong Sibot Biotechnology, Swisse, Jamieson, Amway, ORIHIRO, Conba Pharm, GNC Live Well, Guangdong Kehuan Biotechnology, Kal Vitamins, and Thompson’s collectively holding a significant market share, estimated to be around 85% in the base year of 2025. Innovation drivers are primarily fueled by the growing consumer demand for convenient and palatable dietary supplements, particularly for children and adults seeking to manage stress, boost energy levels, and support cognitive function. The regulatory framework, while largely supportive of dietary supplements, varies across regions, with stringent quality control measures in North America and Europe influencing product development and market entry. Product substitutes, such as liquid B complex formulations and standalone B vitamin supplements, pose a competitive challenge, but the ease of consumption and child-friendliness of chewables maintain their distinct appeal. End-user trends reveal a significant shift towards proactive health management and preventative wellness, driving demand for readily absorbable and enjoyable supplements. Mergers and acquisitions (M&A) activity, while not exceptionally high, has seen strategic consolidation, with an estimated 5 M&A deals recorded during the historical period (2019-2024), primarily aimed at expanding product portfolios and geographical reach.
Vitamin B Complex Chewable Tablets Industry Trends & Analysis
The Vitamin B Complex Chewable Tablets industry is poised for robust growth, projected to experience a Compound Annual Growth Rate (CAGR) of approximately 7.8% during the forecast period of 2025–2033. This expansion is primarily propelled by an escalating awareness of the multifaceted health benefits associated with B vitamins, including their crucial roles in energy metabolism, nerve function, and red blood cell formation. The growing prevalence of modern lifestyle-induced stressors, coupled with an aging global population, is significantly amplifying the demand for B complex supplements as individuals seek to combat fatigue, improve mood, and maintain cognitive health. Technological disruptions are influencing product formulation and manufacturing processes, with advancements in flavor masking and encapsulation technologies enhancing the palatability and efficacy of chewable tablets, especially for pediatric segments. Consumer preferences are increasingly leaning towards natural and clean-label products, prompting manufacturers to focus on sourcing high-quality ingredients and offering vegetarian or vegan options. Competitive dynamics are characterized by both established global brands and agile regional players vying for market share through product differentiation, strategic pricing, and targeted marketing campaigns. Market penetration is steadily increasing, particularly in developed economies with high disposable incomes and a strong emphasis on preventive healthcare. The ease of consumption offered by chewable tablets, eliminating the need for water and providing a pleasant taste, further solidifies their position as a preferred supplement format for a broad consumer base, including children and individuals with swallowing difficulties. The market penetration is estimated to reach 45% by 2033.
Leading Markets & Segments in Vitamin B Complex Chewable Tablets
North America currently stands as the dominant region for Vitamin B Complex Chewable Tablets, driven by its mature healthcare infrastructure, high consumer spending power, and a well-established culture of dietary supplement consumption. Within this region, the United States accounts for a substantial portion of the market share, estimated at over 50%. Key drivers for this dominance include robust government initiatives promoting health and wellness, extensive research and development in the nutraceutical sector, and a high prevalence of health-conscious consumers actively seeking preventative health solutions.
The Adults segment is the largest and most influential within the Application category, representing an estimated 70% of the total market in 2025. This is attributed to the increasing awareness among adults regarding the role of B vitamins in managing stress, improving energy levels, supporting mood regulation, and maintaining overall vitality in the face of demanding lifestyles.
Within the Type segment, 60 Pieces and 90 Pieces packaging formats are the most popular, catering to different consumer needs for convenience and value. The 60 Pieces format is particularly favored for trial and initial purchase, while the 90 Pieces option appeals to regular users seeking cost-effectiveness and continuity. Together, these two formats are projected to constitute over 80% of the market by 2025.
Emerging markets in Asia-Pacific, particularly China and India, are showing significant growth potential due to a rapidly expanding middle class, increasing disposable incomes, and a growing awareness of the benefits of dietary supplements. Government policies promoting health and wellness, coupled with investments in the pharmaceutical and nutraceutical industries, are further fueling this growth.
Vitamin B Complex Chewable Tablets Product Developments
Product innovation in Vitamin B Complex Chewable Tablets is primarily focused on enhancing palatability, improving bioavailability, and offering specialized formulations. Manufacturers are investing in advanced flavor technologies to create more appealing taste profiles, especially for pediatric formulations, and incorporating natural sweeteners and fruit extracts. Extended-release technologies and synergistic ingredient combinations are being explored to optimize B vitamin absorption and efficacy. Furthermore, there's a growing trend towards developing chewable tablets with added complementary nutrients like Vitamin C or minerals, catering to specific health needs such as immune support or bone health, thereby creating unique selling propositions and expanding their market appeal.
Key Drivers of Vitamin B Complex Chewable Tablets Growth
The growth of the Vitamin B Complex Chewable Tablets market is propelled by several key factors. The rising consumer consciousness regarding the importance of nutritional supplements for overall health and well-being is a primary driver. Increased demand from the pediatric segment, seeking enjoyable and easy-to-administer supplements, significantly contributes to market expansion. Furthermore, the growing awareness of B vitamins' role in managing stress and enhancing energy levels in adults, coupled with their contribution to cognitive function and metabolic processes, fuels consistent demand. Advancements in formulation technologies that improve taste and texture of chewable tablets also play a crucial role in market growth.
Challenges in the Vitamin B Complex Chewable Tablets Market
Despite the positive outlook, the Vitamin B Complex Chewable Tablets market faces certain challenges. Regulatory hurdles related to health claims and product standardization across different countries can impede market expansion. Intense competition from other supplement formats, such as capsules and liquids, and the availability of fortified foods present a significant challenge. Fluctuations in raw material prices and supply chain disruptions can also impact production costs and product availability. Additionally, consumer skepticism regarding the efficacy of certain supplements and the potential for over-regulation in some markets can pose significant restraints.
Emerging Opportunities in Vitamin B Complex Chewable Tablets
Emerging opportunities for the Vitamin B Complex Chewable Tablets market lie in tapping into the burgeoning demand for specialized formulations targeting specific demographics and health concerns. The development of vegan and organic certified B complex chewables presents a significant avenue for capturing the growing segment of health-conscious consumers. Strategic partnerships with pediatricians and nutritionists can further enhance market penetration by building trust and educating consumers about the benefits of these supplements. Expanding into underdeveloped geographical regions with growing awareness of preventive healthcare also offers substantial growth potential.
Leading Players in the Vitamin B Complex Chewable Tablets Sector
- SOLARAY
- Shandong Sibot Biotechnology
- Swisse
- Jamieson
- Amway
- ORIHIRO
- Conba Pharm
- GNC Live Well
- Guangdong Kehuan Biotechnology
- Kal Vitamins
- Thompson’s
Key Milestones in Vitamin B Complex Chewable Tablets Industry
- 2019: Increased focus on child-friendly formulations with improved taste profiles.
- 2020: Growing demand for stress-relief supplements propelled B complex sales.
- 2021: Launch of new product lines emphasizing natural ingredients and vegan options.
- 2022: Expansion of distribution channels into online marketplaces and specialty health stores.
- 2023: Increased research into synergistic B vitamin combinations for enhanced efficacy.
- 2024: Growing market penetration in emerging economies.
Strategic Outlook for Vitamin B Complex Chewable Tablets Market
The strategic outlook for the Vitamin B Complex Chewable Tablets market is optimistic, driven by sustained demand for convenient and palatable health supplements. Key growth accelerators include continued product innovation focused on flavor, texture, and specialized formulations, alongside aggressive market penetration strategies in emerging economies. Strategic partnerships with healthcare professionals and a robust digital marketing approach will be crucial for consumer education and brand building. The market is expected to witness further consolidation and the emergence of niche players catering to specific consumer needs, ensuring continued dynamism and profitability in the coming years.
Vitamin B Complex Chewable Tablets Segmentation
-
1. Application
- 1.1. Adults
- 1.2. Children
-
2. Type
- 2.1. 60 Pieces
- 2.2. 90 Pieces
- 2.3. Other
Vitamin B Complex Chewable Tablets Segmentation By Geography
-
1. North America
- 1.1. United States
- 1.2. Canada
- 1.3. Mexico
-
2. South America
- 2.1. Brazil
- 2.2. Argentina
- 2.3. Rest of South America
-
3. Europe
- 3.1. United Kingdom
- 3.2. Germany
- 3.3. France
- 3.4. Italy
- 3.5. Spain
- 3.6. Russia
- 3.7. Benelux
- 3.8. Nordics
- 3.9. Rest of Europe
-
4. Middle East & Africa
- 4.1. Turkey
- 4.2. Israel
- 4.3. GCC
- 4.4. North Africa
- 4.5. South Africa
- 4.6. Rest of Middle East & Africa
-
5. Asia Pacific
- 5.1. China
- 5.2. India
- 5.3. Japan
- 5.4. South Korea
- 5.5. ASEAN
- 5.6. Oceania
- 5.7. Rest of Asia Pacific
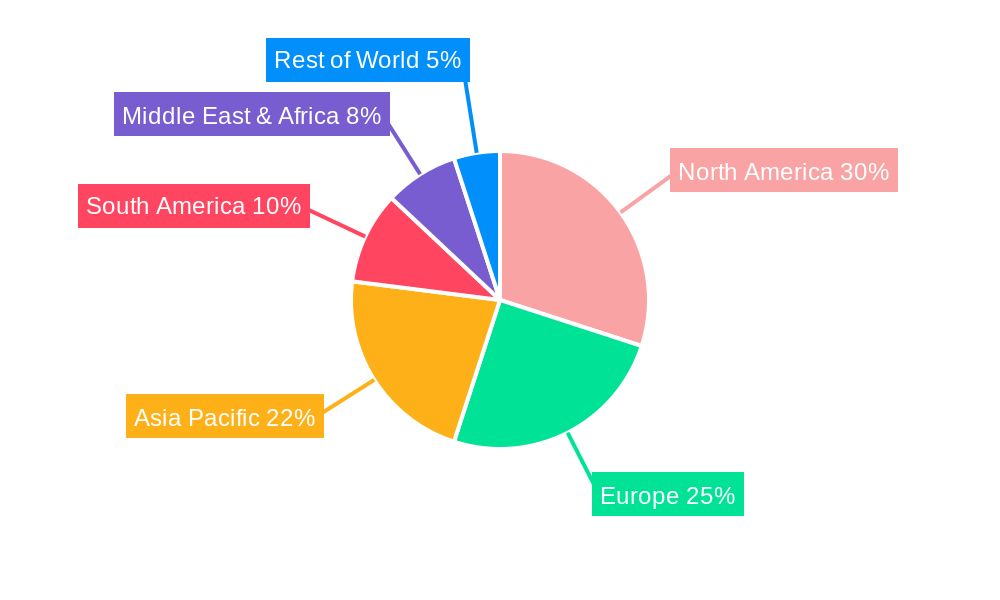
Vitamin B Complex Chewable Tablets Regional Market Share
Geographic Coverage of Vitamin B Complex Chewable Tablets
Vitamin B Complex Chewable Tablets REPORT HIGHLIGHTS
| Aspects | Details |
|---|---|
| Study Period | 2020-2034 |
| Base Year | 2025 |
| Estimated Year | 2026 |
| Forecast Period | 2026-2034 |
| Historical Period | 2020-2025 |
| Growth Rate | CAGR of 7.6% from 2020-2034 |
| Segmentation |
|
Table of Contents
- 1. Introduction
- 1.1. Research Scope
- 1.2. Market Segmentation
- 1.3. Research Objective
- 1.4. Definitions and Assumptions
- 2. Executive Summary
- 2.1. Market Snapshot
- 3. Market Dynamics
- 3.1. Market Drivers
- 3.2. Market Restrains
- 3.3. Market Trends
- 3.4. Market Opportunities
- 4. Market Factor Analysis
- 4.1. Porters Five Forces
- 4.1.1. Bargaining Power of Suppliers
- 4.1.2. Bargaining Power of Buyers
- 4.1.3. Threat of New Entrants
- 4.1.4. Threat of Substitutes
- 4.1.5. Competitive Rivalry
- 4.2. PESTEL analysis
- 4.3. BCG Analysis
- 4.3.1. Stars (High Growth, High Market Share)
- 4.3.2. Cash Cows (Low Growth, High Market Share)
- 4.3.3. Question Mark (High Growth, Low Market Share)
- 4.3.4. Dogs (Low Growth, Low Market Share)
- 4.4. Ansoff Matrix Analysis
- 4.5. Supply Chain Analysis
- 4.6. Regulatory Landscape
- 4.7. Current Market Potential and Opportunity Assessment (TAM–SAM–SOM Framework)
- 4.8. MDP Analyst Note
- 4.1. Porters Five Forces
- 5. Market Analysis, Insights and Forecast 2021-2033
- 5.1. Market Analysis, Insights and Forecast - by Application
- 5.1.1. Adults
- 5.1.2. Children
- 5.2. Market Analysis, Insights and Forecast - by Type
- 5.2.1. 60 Pieces
- 5.2.2. 90 Pieces
- 5.2.3. Other
- 5.3. Market Analysis, Insights and Forecast - by Region
- 5.3.1. North America
- 5.3.2. South America
- 5.3.3. Europe
- 5.3.4. Middle East & Africa
- 5.3.5. Asia Pacific
- 5.1. Market Analysis, Insights and Forecast - by Application
- 6. Global Vitamin B Complex Chewable Tablets Analysis, Insights and Forecast, 2021-2033
- 6.1. Market Analysis, Insights and Forecast - by Application
- 6.1.1. Adults
- 6.1.2. Children
- 6.2. Market Analysis, Insights and Forecast - by Type
- 6.2.1. 60 Pieces
- 6.2.2. 90 Pieces
- 6.2.3. Other
- 6.1. Market Analysis, Insights and Forecast - by Application
- 7. North America Vitamin B Complex Chewable Tablets Analysis, Insights and Forecast, 2020-2032
- 7.1. Market Analysis, Insights and Forecast - by Application
- 7.1.1. Adults
- 7.1.2. Children
- 7.2. Market Analysis, Insights and Forecast - by Type
- 7.2.1. 60 Pieces
- 7.2.2. 90 Pieces
- 7.2.3. Other
- 7.1. Market Analysis, Insights and Forecast - by Application
- 8. South America Vitamin B Complex Chewable Tablets Analysis, Insights and Forecast, 2020-2032
- 8.1. Market Analysis, Insights and Forecast - by Application
- 8.1.1. Adults
- 8.1.2. Children
- 8.2. Market Analysis, Insights and Forecast - by Type
- 8.2.1. 60 Pieces
- 8.2.2. 90 Pieces
- 8.2.3. Other
- 8.1. Market Analysis, Insights and Forecast - by Application
- 9. Europe Vitamin B Complex Chewable Tablets Analysis, Insights and Forecast, 2020-2032
- 9.1. Market Analysis, Insights and Forecast - by Application
- 9.1.1. Adults
- 9.1.2. Children
- 9.2. Market Analysis, Insights and Forecast - by Type
- 9.2.1. 60 Pieces
- 9.2.2. 90 Pieces
- 9.2.3. Other
- 9.1. Market Analysis, Insights and Forecast - by Application
- 10. Middle East & Africa Vitamin B Complex Chewable Tablets Analysis, Insights and Forecast, 2020-2032
- 10.1. Market Analysis, Insights and Forecast - by Application
- 10.1.1. Adults
- 10.1.2. Children
- 10.2. Market Analysis, Insights and Forecast - by Type
- 10.2.1. 60 Pieces
- 10.2.2. 90 Pieces
- 10.2.3. Other
- 10.1. Market Analysis, Insights and Forecast - by Application
- 11. Asia Pacific Vitamin B Complex Chewable Tablets Analysis, Insights and Forecast, 2020-2032
- 11.1. Market Analysis, Insights and Forecast - by Application
- 11.1.1. Adults
- 11.1.2. Children
- 11.2. Market Analysis, Insights and Forecast - by Type
- 11.2.1. 60 Pieces
- 11.2.2. 90 Pieces
- 11.2.3. Other
- 11.1. Market Analysis, Insights and Forecast - by Application
- 12. Competitive Analysis
- 12.1. Company Profiles
- 12.1.1 SOLARAY
- 12.1.1.1. Company Overview
- 12.1.1.2. Products
- 12.1.1.3. Company Financials
- 12.1.1.4. SWOT Analysis
- 12.1.2 Shandong Sibot Biotechnology
- 12.1.2.1. Company Overview
- 12.1.2.2. Products
- 12.1.2.3. Company Financials
- 12.1.2.4. SWOT Analysis
- 12.1.3 Swisse
- 12.1.3.1. Company Overview
- 12.1.3.2. Products
- 12.1.3.3. Company Financials
- 12.1.3.4. SWOT Analysis
- 12.1.4 Jamieson
- 12.1.4.1. Company Overview
- 12.1.4.2. Products
- 12.1.4.3. Company Financials
- 12.1.4.4. SWOT Analysis
- 12.1.5 Amway
- 12.1.5.1. Company Overview
- 12.1.5.2. Products
- 12.1.5.3. Company Financials
- 12.1.5.4. SWOT Analysis
- 12.1.6 ORIHIRO
- 12.1.6.1. Company Overview
- 12.1.6.2. Products
- 12.1.6.3. Company Financials
- 12.1.6.4. SWOT Analysis
- 12.1.7 Conba Pharm
- 12.1.7.1. Company Overview
- 12.1.7.2. Products
- 12.1.7.3. Company Financials
- 12.1.7.4. SWOT Analysis
- 12.1.8 GNC Live Well
- 12.1.8.1. Company Overview
- 12.1.8.2. Products
- 12.1.8.3. Company Financials
- 12.1.8.4. SWOT Analysis
- 12.1.9 Guangdong Kehuan Biotechnology
- 12.1.9.1. Company Overview
- 12.1.9.2. Products
- 12.1.9.3. Company Financials
- 12.1.9.4. SWOT Analysis
- 12.1.10 Kal Vitamins
- 12.1.10.1. Company Overview
- 12.1.10.2. Products
- 12.1.10.3. Company Financials
- 12.1.10.4. SWOT Analysis
- 12.1.11 Thompson’s
- 12.1.11.1. Company Overview
- 12.1.11.2. Products
- 12.1.11.3. Company Financials
- 12.1.11.4. SWOT Analysis
- 12.1.1 SOLARAY
- 12.2. Market Entropy
- 12.2.1 Company's Key Areas Served
- 12.2.2 Recent Developments
- 12.3. Company Market Share Analysis 2025
- 12.3.1 Top 5 Companies Market Share Analysis
- 12.3.2 Top 3 Companies Market Share Analysis
- 12.4. List of Potential Customers
- 13. Research Methodology
List of Figures
- Figure 1: Global Vitamin B Complex Chewable Tablets Revenue Breakdown (billion, %) by Region 2025 & 2033
- Figure 2: North America Vitamin B Complex Chewable Tablets Revenue (billion), by Application 2025 & 2033
- Figure 3: North America Vitamin B Complex Chewable Tablets Revenue Share (%), by Application 2025 & 2033
- Figure 4: North America Vitamin B Complex Chewable Tablets Revenue (billion), by Type 2025 & 2033
- Figure 5: North America Vitamin B Complex Chewable Tablets Revenue Share (%), by Type 2025 & 2033
- Figure 6: North America Vitamin B Complex Chewable Tablets Revenue (billion), by Country 2025 & 2033
- Figure 7: North America Vitamin B Complex Chewable Tablets Revenue Share (%), by Country 2025 & 2033
- Figure 8: South America Vitamin B Complex Chewable Tablets Revenue (billion), by Application 2025 & 2033
- Figure 9: South America Vitamin B Complex Chewable Tablets Revenue Share (%), by Application 2025 & 2033
- Figure 10: South America Vitamin B Complex Chewable Tablets Revenue (billion), by Type 2025 & 2033
- Figure 11: South America Vitamin B Complex Chewable Tablets Revenue Share (%), by Type 2025 & 2033
- Figure 12: South America Vitamin B Complex Chewable Tablets Revenue (billion), by Country 2025 & 2033
- Figure 13: South America Vitamin B Complex Chewable Tablets Revenue Share (%), by Country 2025 & 2033
- Figure 14: Europe Vitamin B Complex Chewable Tablets Revenue (billion), by Application 2025 & 2033
- Figure 15: Europe Vitamin B Complex Chewable Tablets Revenue Share (%), by Application 2025 & 2033
- Figure 16: Europe Vitamin B Complex Chewable Tablets Revenue (billion), by Type 2025 & 2033
- Figure 17: Europe Vitamin B Complex Chewable Tablets Revenue Share (%), by Type 2025 & 2033
- Figure 18: Europe Vitamin B Complex Chewable Tablets Revenue (billion), by Country 2025 & 2033
- Figure 19: Europe Vitamin B Complex Chewable Tablets Revenue Share (%), by Country 2025 & 2033
- Figure 20: Middle East & Africa Vitamin B Complex Chewable Tablets Revenue (billion), by Application 2025 & 2033
- Figure 21: Middle East & Africa Vitamin B Complex Chewable Tablets Revenue Share (%), by Application 2025 & 2033
- Figure 22: Middle East & Africa Vitamin B Complex Chewable Tablets Revenue (billion), by Type 2025 & 2033
- Figure 23: Middle East & Africa Vitamin B Complex Chewable Tablets Revenue Share (%), by Type 2025 & 2033
- Figure 24: Middle East & Africa Vitamin B Complex Chewable Tablets Revenue (billion), by Country 2025 & 2033
- Figure 25: Middle East & Africa Vitamin B Complex Chewable Tablets Revenue Share (%), by Country 2025 & 2033
- Figure 26: Asia Pacific Vitamin B Complex Chewable Tablets Revenue (billion), by Application 2025 & 2033
- Figure 27: Asia Pacific Vitamin B Complex Chewable Tablets Revenue Share (%), by Application 2025 & 2033
- Figure 28: Asia Pacific Vitamin B Complex Chewable Tablets Revenue (billion), by Type 2025 & 2033
- Figure 29: Asia Pacific Vitamin B Complex Chewable Tablets Revenue Share (%), by Type 2025 & 2033
- Figure 30: Asia Pacific Vitamin B Complex Chewable Tablets Revenue (billion), by Country 2025 & 2033
- Figure 31: Asia Pacific Vitamin B Complex Chewable Tablets Revenue Share (%), by Country 2025 & 2033
List of Tables
- Table 1: Global Vitamin B Complex Chewable Tablets Revenue billion Forecast, by Application 2020 & 2033
- Table 2: Global Vitamin B Complex Chewable Tablets Revenue billion Forecast, by Type 2020 & 2033
- Table 3: Global Vitamin B Complex Chewable Tablets Revenue billion Forecast, by Region 2020 & 2033
- Table 4: Global Vitamin B Complex Chewable Tablets Revenue billion Forecast, by Application 2020 & 2033
- Table 5: Global Vitamin B Complex Chewable Tablets Revenue billion Forecast, by Type 2020 & 2033
- Table 6: Global Vitamin B Complex Chewable Tablets Revenue billion Forecast, by Country 2020 & 2033
- Table 7: United States Vitamin B Complex Chewable Tablets Revenue (billion) Forecast, by Application 2020 & 2033
- Table 8: Canada Vitamin B Complex Chewable Tablets Revenue (billion) Forecast, by Application 2020 & 2033
- Table 9: Mexico Vitamin B Complex Chewable Tablets Revenue (billion) Forecast, by Application 2020 & 2033
- Table 10: Global Vitamin B Complex Chewable Tablets Revenue billion Forecast, by Application 2020 & 2033
- Table 11: Global Vitamin B Complex Chewable Tablets Revenue billion Forecast, by Type 2020 & 2033
- Table 12: Global Vitamin B Complex Chewable Tablets Revenue billion Forecast, by Country 2020 & 2033
- Table 13: Brazil Vitamin B Complex Chewable Tablets Revenue (billion) Forecast, by Application 2020 & 2033
- Table 14: Argentina Vitamin B Complex Chewable Tablets Revenue (billion) Forecast, by Application 2020 & 2033
- Table 15: Rest of South America Vitamin B Complex Chewable Tablets Revenue (billion) Forecast, by Application 2020 & 2033
- Table 16: Global Vitamin B Complex Chewable Tablets Revenue billion Forecast, by Application 2020 & 2033
- Table 17: Global Vitamin B Complex Chewable Tablets Revenue billion Forecast, by Type 2020 & 2033
- Table 18: Global Vitamin B Complex Chewable Tablets Revenue billion Forecast, by Country 2020 & 2033
- Table 19: United Kingdom Vitamin B Complex Chewable Tablets Revenue (billion) Forecast, by Application 2020 & 2033
- Table 20: Germany Vitamin B Complex Chewable Tablets Revenue (billion) Forecast, by Application 2020 & 2033
- Table 21: France Vitamin B Complex Chewable Tablets Revenue (billion) Forecast, by Application 2020 & 2033
- Table 22: Italy Vitamin B Complex Chewable Tablets Revenue (billion) Forecast, by Application 2020 & 2033
- Table 23: Spain Vitamin B Complex Chewable Tablets Revenue (billion) Forecast, by Application 2020 & 2033
- Table 24: Russia Vitamin B Complex Chewable Tablets Revenue (billion) Forecast, by Application 2020 & 2033
- Table 25: Benelux Vitamin B Complex Chewable Tablets Revenue (billion) Forecast, by Application 2020 & 2033
- Table 26: Nordics Vitamin B Complex Chewable Tablets Revenue (billion) Forecast, by Application 2020 & 2033
- Table 27: Rest of Europe Vitamin B Complex Chewable Tablets Revenue (billion) Forecast, by Application 2020 & 2033
- Table 28: Global Vitamin B Complex Chewable Tablets Revenue billion Forecast, by Application 2020 & 2033
- Table 29: Global Vitamin B Complex Chewable Tablets Revenue billion Forecast, by Type 2020 & 2033
- Table 30: Global Vitamin B Complex Chewable Tablets Revenue billion Forecast, by Country 2020 & 2033
- Table 31: Turkey Vitamin B Complex Chewable Tablets Revenue (billion) Forecast, by Application 2020 & 2033
- Table 32: Israel Vitamin B Complex Chewable Tablets Revenue (billion) Forecast, by Application 2020 & 2033
- Table 33: GCC Vitamin B Complex Chewable Tablets Revenue (billion) Forecast, by Application 2020 & 2033
- Table 34: North Africa Vitamin B Complex Chewable Tablets Revenue (billion) Forecast, by Application 2020 & 2033
- Table 35: South Africa Vitamin B Complex Chewable Tablets Revenue (billion) Forecast, by Application 2020 & 2033
- Table 36: Rest of Middle East & Africa Vitamin B Complex Chewable Tablets Revenue (billion) Forecast, by Application 2020 & 2033
- Table 37: Global Vitamin B Complex Chewable Tablets Revenue billion Forecast, by Application 2020 & 2033
- Table 38: Global Vitamin B Complex Chewable Tablets Revenue billion Forecast, by Type 2020 & 2033
- Table 39: Global Vitamin B Complex Chewable Tablets Revenue billion Forecast, by Country 2020 & 2033
- Table 40: China Vitamin B Complex Chewable Tablets Revenue (billion) Forecast, by Application 2020 & 2033
- Table 41: India Vitamin B Complex Chewable Tablets Revenue (billion) Forecast, by Application 2020 & 2033
- Table 42: Japan Vitamin B Complex Chewable Tablets Revenue (billion) Forecast, by Application 2020 & 2033
- Table 43: South Korea Vitamin B Complex Chewable Tablets Revenue (billion) Forecast, by Application 2020 & 2033
- Table 44: ASEAN Vitamin B Complex Chewable Tablets Revenue (billion) Forecast, by Application 2020 & 2033
- Table 45: Oceania Vitamin B Complex Chewable Tablets Revenue (billion) Forecast, by Application 2020 & 2033
- Table 46: Rest of Asia Pacific Vitamin B Complex Chewable Tablets Revenue (billion) Forecast, by Application 2020 & 2033
Frequently Asked Questions
1. What is the projected Compound Annual Growth Rate (CAGR) of the Vitamin B Complex Chewable Tablets?
The projected CAGR is approximately 7.6%.
2. Which companies are prominent players in the Vitamin B Complex Chewable Tablets?
Key companies in the market include SOLARAY, Shandong Sibot Biotechnology, Swisse, Jamieson, Amway, ORIHIRO, Conba Pharm, GNC Live Well, Guangdong Kehuan Biotechnology, Kal Vitamins, Thompson’s.
3. What are the main segments of the Vitamin B Complex Chewable Tablets?
The market segments include Application, Type.
4. Can you provide details about the market size?
The market size is estimated to be USD 14.8 billion as of 2022.
5. What are some drivers contributing to market growth?
N/A
6. What are the notable trends driving market growth?
N/A
7. Are there any restraints impacting market growth?
N/A
8. Can you provide examples of recent developments in the market?
N/A
9. What pricing options are available for accessing the report?
Pricing options include single-user, multi-user, and enterprise licenses priced at USD 2900.00, USD 4350.00, and USD 5800.00 respectively.
10. Is the market size provided in terms of value or volume?
The market size is provided in terms of value, measured in billion.
11. Are there any specific market keywords associated with the report?
Yes, the market keyword associated with the report is "Vitamin B Complex Chewable Tablets," which aids in identifying and referencing the specific market segment covered.
12. How do I determine which pricing option suits my needs best?
The pricing options vary based on user requirements and access needs. Individual users may opt for single-user licenses, while businesses requiring broader access may choose multi-user or enterprise licenses for cost-effective access to the report.
13. Are there any additional resources or data provided in the Vitamin B Complex Chewable Tablets report?
While the report offers comprehensive insights, it's advisable to review the specific contents or supplementary materials provided to ascertain if additional resources or data are available.
14. How can I stay updated on further developments or reports in the Vitamin B Complex Chewable Tablets?
To stay informed about further developments, trends, and reports in the Vitamin B Complex Chewable Tablets, consider subscribing to industry newsletters, following relevant companies and organizations, or regularly checking reputable industry news sources and publications.
Methodology
Step 1 - Identification of Relevant Samples Size from Population Database


Step 2 - Approaches for Defining Global Market Size (Value, Volume* & Price*)

Note*: In applicable scenarios
Step 3 - Data Sources
Primary Research
- Web Analytics
- Survey Reports
- Research Institute
- Latest Research Reports
- Opinion Leaders
Secondary Research
- Annual Reports
- White Paper
- Latest Press Release
- Industry Association
- Paid Database
- Investor Presentations

Step 4 - Data Triangulation
Involves using different sources of information in order to increase the validity of a study
These sources are likely to be stakeholders in a program - participants, other researchers, program staff, other community members, and so on.
Then we put all data in single framework & apply various statistical tools to find out the dynamic on the market.
During the analysis stage, feedback from the stakeholder groups would be compared to determine areas of agreement as well as areas of divergence