

Key Insights
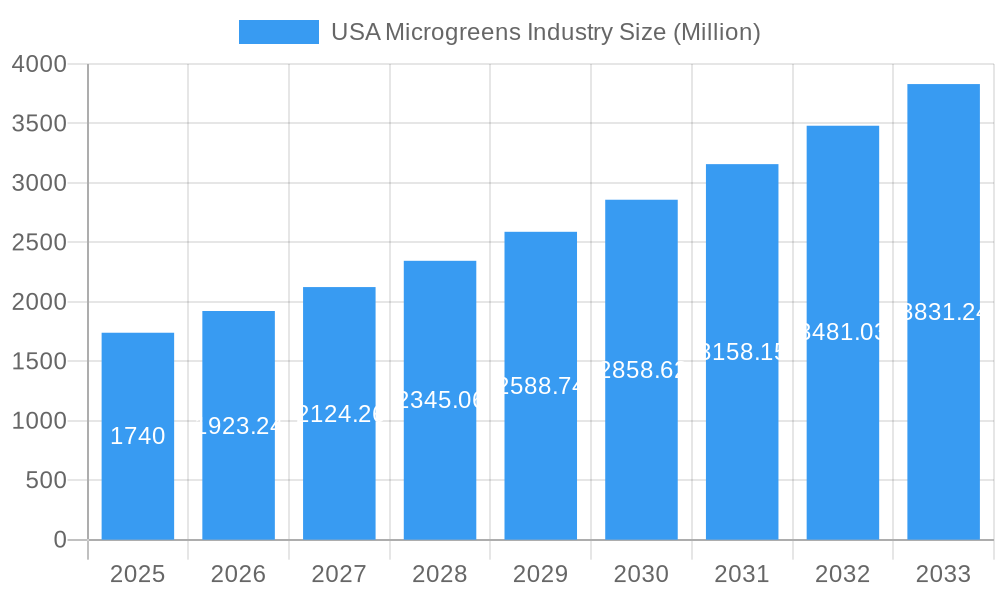
The US microgreens industry, valued at $1.74 billion in 2025, is experiencing robust growth, projected to expand at a Compound Annual Growth Rate (CAGR) of 10.60% from 2025 to 2033. This expansion is driven by several key factors. The increasing consumer demand for healthy and nutritious food options fuels the popularity of microgreens, rich in vitamins and antioxidants. The rise of health-conscious consumers, coupled with the growing awareness of the nutritional benefits of microgreens, is a significant driver. Furthermore, the increasing adoption of innovative farming techniques like indoor and vertical farming is enhancing production efficiency and year-round availability, further bolstering market growth. The diverse culinary applications of microgreens, used as garnishes, in salads, and as components in various dishes across diverse channels including supermarkets, restaurants, and even directly to consumers through farmers markets, contribute to the market's dynamism. While challenges such as potential supply chain disruptions and fluctuating input costs exist, the overall outlook for the US microgreens industry remains positive, particularly in regions like the Northeast and West Coast, where consumer demand is high and where adoption of innovative farming practices are prevalent.
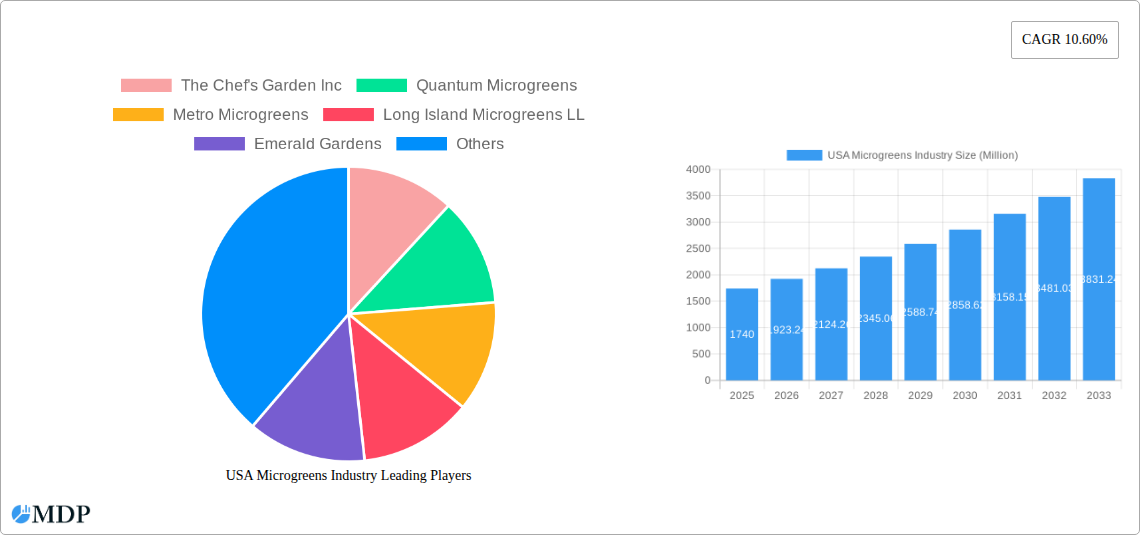
USA Microgreens Industry Market Size (In Billion)
The segmentation within the market reveals significant opportunities. Broccoli, lettuce, and chicory lead the type segment, reflecting strong consumer preference. Sales channels are diverse, with hypermarkets and supermarkets representing a significant portion of the market, alongside a rapidly growing food service sector (restaurants). The geographical distribution within the US is largely dictated by consumer demographics and agricultural infrastructure, with the Northeast and West exhibiting higher consumption rates and innovative farming techniques, like vertical farming, gaining popularity in urban centers to accommodate the increased demand. The competitive landscape is comprised of both established players like AeroFarms and smaller, regional producers, reflecting both the scalability and localized nature of microgreen production. The continued innovation in production technologies, coupled with strategic marketing initiatives highlighting the health benefits, will further drive market growth and attract new participants in the coming years.
USA Microgreens Industry Company Market Share
USA Microgreens Industry Market Report: 2019-2033
This comprehensive report provides an in-depth analysis of the booming USA microgreens industry, offering invaluable insights for stakeholders, investors, and industry professionals. Covering the period 2019-2033, with a base year of 2025, this report unveils the market dynamics, key players, and future growth potential of this rapidly expanding sector. Expect detailed segmentation across sales channels, farming techniques, and microgreen types, all backed by robust data and insightful analysis. Unlock the secrets to success in the USA microgreens market – download your copy today!
USA Microgreens Industry Market Dynamics & Concentration
The USA microgreens market, valued at $xx Million in 2024, exhibits a dynamic landscape shaped by several key factors. Market concentration is moderate, with several key players commanding significant shares, while numerous smaller farms and startups contribute to the overall volume. Innovation is a primary driver, with advancements in vertical farming and aeroponics boosting production efficiency and yield. Regulatory frameworks, though generally favorable, are constantly evolving, impacting production standards and labeling requirements. Product substitutes, such as traditional leafy greens, pose a competitive challenge, but the unique nutritional profile and perceived health benefits of microgreens provide a compelling differentiation. End-user trends, including a growing preference for fresh, healthy, and locally sourced food, significantly fuel market growth. M&A activity within the sector remains relatively low, with approximately xx deals recorded between 2019-2024, indicating a space ripe for consolidation.
- Market Share: Major players hold approximately xx% of the market share collectively.
- M&A Activity: xx deals recorded between 2019-2024.
- Innovation Drivers: Vertical farming, aeroponics, and improved seed varieties.
- Regulatory Landscape: Evolving standards for food safety and labeling.
USA Microgreens Industry Industry Trends & Analysis
The USA microgreens industry is experiencing robust growth, with a projected Compound Annual Growth Rate (CAGR) of xx% from 2025 to 2033. This expansion is propelled by several factors: increasing consumer awareness of microgreens' nutritional benefits, rising disposable incomes, and the expanding popularity of health-conscious lifestyles. Technological disruptions, particularly in the areas of vertical farming and automation, are enhancing production efficiency and lowering costs. Consumer preferences are shifting towards organic and sustainably grown microgreens, driving demand for eco-friendly farming practices. Competitive dynamics are marked by both established players and new entrants vying for market share, leading to innovation and pricing pressures. Market penetration remains relatively low, indicating significant untapped potential for future growth.
Leading Markets & Segments in USA Microgreens Industry
The USA microgreens market is geographically diverse, with significant presence across various regions. However, California, with its favorable climate and established agricultural infrastructure, currently holds a leading position. Within market segmentation:
Sales Channels:
- Hypermarkets/Supermarkets: This segment dominates, driven by high consumer accessibility and established distribution networks.
- Restaurants: Growing demand from the food service industry, particularly in high-end establishments, contributes significantly.
- Other Channels: Farmers' markets, direct-to-consumer sales, and online retailers are emerging as supplementary channels.
Farming Techniques:
- Indoor Farming & Vertical Farming: These methods offer climate control, high yields, and reduced reliance on land, driving market growth.
- Commercial Greenhouses: Traditional greenhouse operations contribute substantially, especially in regions with suitable climates.
- Other Farming Techniques: Smaller-scale operations using various techniques contribute to the diverse landscape.
Microgreen Types:
- Broccoli, Lettuce, and Chicory: These varieties command significant market share due to high consumer demand and ease of cultivation.
- Basil, Fennel, Carrots, Radish, Amaranth, Arugula, Beets, Mustard, Kale, Cress, and Chard: These diverse types cater to a broad range of consumer preferences and culinary applications.
USA Microgreens Industry Product Developments
Recent product innovations focus on extending shelf life, enhancing nutritional value, and diversifying microgreen varieties. Technological advancements, including advanced lighting systems and nutrient delivery techniques, are improving yields and quality. Competitive advantages are achieved through superior taste, unique flavor profiles, and sustainable production practices, reflecting the growing consumer demand for high-quality, ethically sourced microgreens.
Key Drivers of USA Microgreens Industry Growth
Technological advancements in vertical farming and aeroponics are substantially increasing production efficiency and year-round availability. The growing consumer awareness of the health benefits of microgreens fuels increased demand. Favorable government policies and incentives promoting sustainable agriculture also contribute significantly.
Challenges in the USA Microgreens Industry Market
High initial investment costs for advanced farming technologies and fluctuations in energy prices can create operational challenges. Maintaining a consistent supply chain and ensuring product freshness can be demanding. Intense competition from established players and new entrants adds to the challenges.
Emerging Opportunities in USA Microgreens Industry
The growing demand for organic and sustainably produced microgreens presents significant opportunities. Strategic partnerships with food retailers and restaurants can expand market reach. Expansion into new geographic markets and development of innovative product offerings will drive future growth.
Leading Players in the USA Microgreens Industry Sector
- The Chef's Garden Inc
- Quantum Microgreens
- Metro Microgreens
- Long Island Microgreens LL
- Emerald Gardens
- Fresh Origins
- Florida Microgreens
- Farmbox Greens LLC
- Arizona Microgreens LLC
- AeroFarms LLC
Key Milestones in USA Microgreens Industry Industry
- September 2022: AeroFarms establishes the world's largest aeroponic smart farm in Danville, VA, capable of producing over 3 million lbs of leafy greens annually.
- July 2022: AeroFarms expands production at its Pittsylvania County vertical farm to meet increasing consumer demand.
- February 2022: Infarm opens a new 40,000 sq. ft vertical farming center in Texas, boosting regional market presence.
Strategic Outlook for USA Microgreens Industry Market
The USA microgreens market presents considerable long-term growth potential. Strategic investments in innovative technologies, coupled with a focus on sustainable and ethical production practices, will be crucial for success. Expansion into new market segments and strategic partnerships will further fuel market growth in the coming years, reaching an estimated value of $xx Million by 2033.
USA Microgreens Industry Segmentation
- 1. Production Analysis
- 2. Consumption Analysis
- 3. Import Market Analysis (Value & Volume)
- 4. Export Market Analysis (Value & Volume)
- 5. Price Trend Analysis
USA Microgreens Industry Segmentation By Geography
-
1. North America
- 1.1. United States
- 1.2. Canada
- 1.3. Mexico
-
2. South America
- 2.1. Brazil
- 2.2. Argentina
- 2.3. Rest of South America
-
3. Europe
- 3.1. United Kingdom
- 3.2. Germany
- 3.3. France
- 3.4. Italy
- 3.5. Spain
- 3.6. Russia
- 3.7. Benelux
- 3.8. Nordics
- 3.9. Rest of Europe
-
4. Middle East & Africa
- 4.1. Turkey
- 4.2. Israel
- 4.3. GCC
- 4.4. North Africa
- 4.5. South Africa
- 4.6. Rest of Middle East & Africa
-
5. Asia Pacific
- 5.1. China
- 5.2. India
- 5.3. Japan
- 5.4. South Korea
- 5.5. ASEAN
- 5.6. Oceania
- 5.7. Rest of Asia Pacific
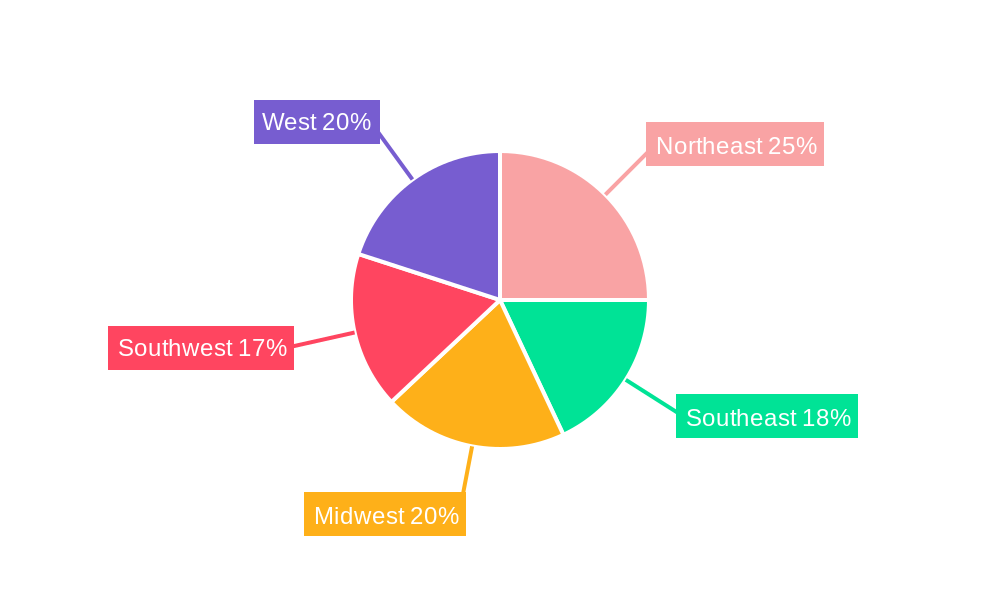
USA Microgreens Industry Regional Market Share
Geographic Coverage of USA Microgreens Industry
USA Microgreens Industry REPORT HIGHLIGHTS
| Aspects | Details |
|---|---|
| Study Period | 2020-2034 |
| Base Year | 2025 |
| Estimated Year | 2026 |
| Forecast Period | 2026-2034 |
| Historical Period | 2020-2025 |
| Growth Rate | CAGR of 10.60% from 2020-2034 |
| Segmentation |
|
Table of Contents
- 1. Introduction
- 1.1. Research Scope
- 1.2. Market Segmentation
- 1.3. Research Objective
- 1.4. Definitions and Assumptions
- 2. Executive Summary
- 2.1. Market Snapshot
- 3. Market Dynamics
- 3.1. Market Drivers
- 3.2. Market Restrains
- 3.3. Market Trends
- 3.4. Market Opportunities
- 4. Market Factor Analysis
- 4.1. Porters Five Forces
- 4.1.1. Bargaining Power of Suppliers
- 4.1.2. Bargaining Power of Buyers
- 4.1.3. Threat of New Entrants
- 4.1.4. Threat of Substitutes
- 4.1.5. Competitive Rivalry
- 4.2. PESTEL analysis
- 4.3. BCG Analysis
- 4.3.1. Stars (High Growth, High Market Share)
- 4.3.2. Cash Cows (Low Growth, High Market Share)
- 4.3.3. Question Mark (High Growth, Low Market Share)
- 4.3.4. Dogs (Low Growth, Low Market Share)
- 4.4. Ansoff Matrix Analysis
- 4.5. Supply Chain Analysis
- 4.6. Regulatory Landscape
- 4.7. Current Market Potential and Opportunity Assessment (TAM–SAM–SOM Framework)
- 4.8. MDP Analyst Note
- 4.1. Porters Five Forces
- 5. Market Analysis, Insights and Forecast 2021-2033
- 5.1. Market Analysis, Insights and Forecast - by Production Analysis
- 5.2. Market Analysis, Insights and Forecast - by Consumption Analysis
- 5.3. Market Analysis, Insights and Forecast - by Import Market Analysis (Value & Volume)
- 5.4. Market Analysis, Insights and Forecast - by Export Market Analysis (Value & Volume)
- 5.5. Market Analysis, Insights and Forecast - by Price Trend Analysis
- 5.6. Market Analysis, Insights and Forecast - by Region
- 5.6.1. North America
- 5.6.2. South America
- 5.6.3. Europe
- 5.6.4. Middle East & Africa
- 5.6.5. Asia Pacific
- 6. Global USA Microgreens Industry Analysis, Insights and Forecast, 2021-2033
- 6.1. Market Analysis, Insights and Forecast - by Production Analysis
- 6.2. Market Analysis, Insights and Forecast - by Consumption Analysis
- 6.3. Market Analysis, Insights and Forecast - by Import Market Analysis (Value & Volume)
- 6.4. Market Analysis, Insights and Forecast - by Export Market Analysis (Value & Volume)
- 6.5. Market Analysis, Insights and Forecast - by Price Trend Analysis
- 7. North America USA Microgreens Industry Analysis, Insights and Forecast, 2020-2032
- 7.1. Market Analysis, Insights and Forecast - by Production Analysis
- 7.2. Market Analysis, Insights and Forecast - by Consumption Analysis
- 7.3. Market Analysis, Insights and Forecast - by Import Market Analysis (Value & Volume)
- 7.4. Market Analysis, Insights and Forecast - by Export Market Analysis (Value & Volume)
- 7.5. Market Analysis, Insights and Forecast - by Price Trend Analysis
- 8. South America USA Microgreens Industry Analysis, Insights and Forecast, 2020-2032
- 8.1. Market Analysis, Insights and Forecast - by Production Analysis
- 8.2. Market Analysis, Insights and Forecast - by Consumption Analysis
- 8.3. Market Analysis, Insights and Forecast - by Import Market Analysis (Value & Volume)
- 8.4. Market Analysis, Insights and Forecast - by Export Market Analysis (Value & Volume)
- 8.5. Market Analysis, Insights and Forecast - by Price Trend Analysis
- 9. Europe USA Microgreens Industry Analysis, Insights and Forecast, 2020-2032
- 9.1. Market Analysis, Insights and Forecast - by Production Analysis
- 9.2. Market Analysis, Insights and Forecast - by Consumption Analysis
- 9.3. Market Analysis, Insights and Forecast - by Import Market Analysis (Value & Volume)
- 9.4. Market Analysis, Insights and Forecast - by Export Market Analysis (Value & Volume)
- 9.5. Market Analysis, Insights and Forecast - by Price Trend Analysis
- 10. Middle East & Africa USA Microgreens Industry Analysis, Insights and Forecast, 2020-2032
- 10.1. Market Analysis, Insights and Forecast - by Production Analysis
- 10.2. Market Analysis, Insights and Forecast - by Consumption Analysis
- 10.3. Market Analysis, Insights and Forecast - by Import Market Analysis (Value & Volume)
- 10.4. Market Analysis, Insights and Forecast - by Export Market Analysis (Value & Volume)
- 10.5. Market Analysis, Insights and Forecast - by Price Trend Analysis
- 11. Asia Pacific USA Microgreens Industry Analysis, Insights and Forecast, 2020-2032
- 11.1. Market Analysis, Insights and Forecast - by Production Analysis
- 11.2. Market Analysis, Insights and Forecast - by Consumption Analysis
- 11.3. Market Analysis, Insights and Forecast - by Import Market Analysis (Value & Volume)
- 11.4. Market Analysis, Insights and Forecast - by Export Market Analysis (Value & Volume)
- 11.5. Market Analysis, Insights and Forecast - by Price Trend Analysis
- 12. Competitive Analysis
- 12.1. Company Profiles
- 12.1.1 The Chef's Garden Inc
- 12.1.1.1. Company Overview
- 12.1.1.2. Products
- 12.1.1.3. Company Financials
- 12.1.1.4. SWOT Analysis
- 12.1.2 Quantum Microgreens
- 12.1.2.1. Company Overview
- 12.1.2.2. Products
- 12.1.2.3. Company Financials
- 12.1.2.4. SWOT Analysis
- 12.1.3 Metro Microgreens
- 12.1.3.1. Company Overview
- 12.1.3.2. Products
- 12.1.3.3. Company Financials
- 12.1.3.4. SWOT Analysis
- 12.1.4 Long Island Microgreens LL
- 12.1.4.1. Company Overview
- 12.1.4.2. Products
- 12.1.4.3. Company Financials
- 12.1.4.4. SWOT Analysis
- 12.1.5 Emerald Gardens
- 12.1.5.1. Company Overview
- 12.1.5.2. Products
- 12.1.5.3. Company Financials
- 12.1.5.4. SWOT Analysis
- 12.1.6 Fresh Origins
- 12.1.6.1. Company Overview
- 12.1.6.2. Products
- 12.1.6.3. Company Financials
- 12.1.6.4. SWOT Analysis
- 12.1.7 Florida Microgreens
- 12.1.7.1. Company Overview
- 12.1.7.2. Products
- 12.1.7.3. Company Financials
- 12.1.7.4. SWOT Analysis
- 12.1.8 Farmbox Greens LLC
- 12.1.8.1. Company Overview
- 12.1.8.2. Products
- 12.1.8.3. Company Financials
- 12.1.8.4. SWOT Analysis
- 12.1.9 Arizona Microgreens LLC
- 12.1.9.1. Company Overview
- 12.1.9.2. Products
- 12.1.9.3. Company Financials
- 12.1.9.4. SWOT Analysis
- 12.1.10 AeroFarms LLC
- 12.1.10.1. Company Overview
- 12.1.10.2. Products
- 12.1.10.3. Company Financials
- 12.1.10.4. SWOT Analysis
- 12.1.1 The Chef's Garden Inc
- 12.2. Market Entropy
- 12.2.1 Company's Key Areas Served
- 12.2.2 Recent Developments
- 12.3. Company Market Share Analysis 2025
- 12.3.1 Top 5 Companies Market Share Analysis
- 12.3.2 Top 3 Companies Market Share Analysis
- 12.4. List of Potential Customers
- 13. Research Methodology
List of Figures
- Figure 1: Global USA Microgreens Industry Revenue Breakdown (Million, %) by Region 2025 & 2033
- Figure 2: North America USA Microgreens Industry Revenue (Million), by Production Analysis 2025 & 2033
- Figure 3: North America USA Microgreens Industry Revenue Share (%), by Production Analysis 2025 & 2033
- Figure 4: North America USA Microgreens Industry Revenue (Million), by Consumption Analysis 2025 & 2033
- Figure 5: North America USA Microgreens Industry Revenue Share (%), by Consumption Analysis 2025 & 2033
- Figure 6: North America USA Microgreens Industry Revenue (Million), by Import Market Analysis (Value & Volume) 2025 & 2033
- Figure 7: North America USA Microgreens Industry Revenue Share (%), by Import Market Analysis (Value & Volume) 2025 & 2033
- Figure 8: North America USA Microgreens Industry Revenue (Million), by Export Market Analysis (Value & Volume) 2025 & 2033
- Figure 9: North America USA Microgreens Industry Revenue Share (%), by Export Market Analysis (Value & Volume) 2025 & 2033
- Figure 10: North America USA Microgreens Industry Revenue (Million), by Price Trend Analysis 2025 & 2033
- Figure 11: North America USA Microgreens Industry Revenue Share (%), by Price Trend Analysis 2025 & 2033
- Figure 12: North America USA Microgreens Industry Revenue (Million), by Country 2025 & 2033
- Figure 13: North America USA Microgreens Industry Revenue Share (%), by Country 2025 & 2033
- Figure 14: South America USA Microgreens Industry Revenue (Million), by Production Analysis 2025 & 2033
- Figure 15: South America USA Microgreens Industry Revenue Share (%), by Production Analysis 2025 & 2033
- Figure 16: South America USA Microgreens Industry Revenue (Million), by Consumption Analysis 2025 & 2033
- Figure 17: South America USA Microgreens Industry Revenue Share (%), by Consumption Analysis 2025 & 2033
- Figure 18: South America USA Microgreens Industry Revenue (Million), by Import Market Analysis (Value & Volume) 2025 & 2033
- Figure 19: South America USA Microgreens Industry Revenue Share (%), by Import Market Analysis (Value & Volume) 2025 & 2033
- Figure 20: South America USA Microgreens Industry Revenue (Million), by Export Market Analysis (Value & Volume) 2025 & 2033
- Figure 21: South America USA Microgreens Industry Revenue Share (%), by Export Market Analysis (Value & Volume) 2025 & 2033
- Figure 22: South America USA Microgreens Industry Revenue (Million), by Price Trend Analysis 2025 & 2033
- Figure 23: South America USA Microgreens Industry Revenue Share (%), by Price Trend Analysis 2025 & 2033
- Figure 24: South America USA Microgreens Industry Revenue (Million), by Country 2025 & 2033
- Figure 25: South America USA Microgreens Industry Revenue Share (%), by Country 2025 & 2033
- Figure 26: Europe USA Microgreens Industry Revenue (Million), by Production Analysis 2025 & 2033
- Figure 27: Europe USA Microgreens Industry Revenue Share (%), by Production Analysis 2025 & 2033
- Figure 28: Europe USA Microgreens Industry Revenue (Million), by Consumption Analysis 2025 & 2033
- Figure 29: Europe USA Microgreens Industry Revenue Share (%), by Consumption Analysis 2025 & 2033
- Figure 30: Europe USA Microgreens Industry Revenue (Million), by Import Market Analysis (Value & Volume) 2025 & 2033
- Figure 31: Europe USA Microgreens Industry Revenue Share (%), by Import Market Analysis (Value & Volume) 2025 & 2033
- Figure 32: Europe USA Microgreens Industry Revenue (Million), by Export Market Analysis (Value & Volume) 2025 & 2033
- Figure 33: Europe USA Microgreens Industry Revenue Share (%), by Export Market Analysis (Value & Volume) 2025 & 2033
- Figure 34: Europe USA Microgreens Industry Revenue (Million), by Price Trend Analysis 2025 & 2033
- Figure 35: Europe USA Microgreens Industry Revenue Share (%), by Price Trend Analysis 2025 & 2033
- Figure 36: Europe USA Microgreens Industry Revenue (Million), by Country 2025 & 2033
- Figure 37: Europe USA Microgreens Industry Revenue Share (%), by Country 2025 & 2033
- Figure 38: Middle East & Africa USA Microgreens Industry Revenue (Million), by Production Analysis 2025 & 2033
- Figure 39: Middle East & Africa USA Microgreens Industry Revenue Share (%), by Production Analysis 2025 & 2033
- Figure 40: Middle East & Africa USA Microgreens Industry Revenue (Million), by Consumption Analysis 2025 & 2033
- Figure 41: Middle East & Africa USA Microgreens Industry Revenue Share (%), by Consumption Analysis 2025 & 2033
- Figure 42: Middle East & Africa USA Microgreens Industry Revenue (Million), by Import Market Analysis (Value & Volume) 2025 & 2033
- Figure 43: Middle East & Africa USA Microgreens Industry Revenue Share (%), by Import Market Analysis (Value & Volume) 2025 & 2033
- Figure 44: Middle East & Africa USA Microgreens Industry Revenue (Million), by Export Market Analysis (Value & Volume) 2025 & 2033
- Figure 45: Middle East & Africa USA Microgreens Industry Revenue Share (%), by Export Market Analysis (Value & Volume) 2025 & 2033
- Figure 46: Middle East & Africa USA Microgreens Industry Revenue (Million), by Price Trend Analysis 2025 & 2033
- Figure 47: Middle East & Africa USA Microgreens Industry Revenue Share (%), by Price Trend Analysis 2025 & 2033
- Figure 48: Middle East & Africa USA Microgreens Industry Revenue (Million), by Country 2025 & 2033
- Figure 49: Middle East & Africa USA Microgreens Industry Revenue Share (%), by Country 2025 & 2033
- Figure 50: Asia Pacific USA Microgreens Industry Revenue (Million), by Production Analysis 2025 & 2033
- Figure 51: Asia Pacific USA Microgreens Industry Revenue Share (%), by Production Analysis 2025 & 2033
- Figure 52: Asia Pacific USA Microgreens Industry Revenue (Million), by Consumption Analysis 2025 & 2033
- Figure 53: Asia Pacific USA Microgreens Industry Revenue Share (%), by Consumption Analysis 2025 & 2033
- Figure 54: Asia Pacific USA Microgreens Industry Revenue (Million), by Import Market Analysis (Value & Volume) 2025 & 2033
- Figure 55: Asia Pacific USA Microgreens Industry Revenue Share (%), by Import Market Analysis (Value & Volume) 2025 & 2033
- Figure 56: Asia Pacific USA Microgreens Industry Revenue (Million), by Export Market Analysis (Value & Volume) 2025 & 2033
- Figure 57: Asia Pacific USA Microgreens Industry Revenue Share (%), by Export Market Analysis (Value & Volume) 2025 & 2033
- Figure 58: Asia Pacific USA Microgreens Industry Revenue (Million), by Price Trend Analysis 2025 & 2033
- Figure 59: Asia Pacific USA Microgreens Industry Revenue Share (%), by Price Trend Analysis 2025 & 2033
- Figure 60: Asia Pacific USA Microgreens Industry Revenue (Million), by Country 2025 & 2033
- Figure 61: Asia Pacific USA Microgreens Industry Revenue Share (%), by Country 2025 & 2033
List of Tables
- Table 1: Global USA Microgreens Industry Revenue Million Forecast, by Production Analysis 2020 & 2033
- Table 2: Global USA Microgreens Industry Revenue Million Forecast, by Consumption Analysis 2020 & 2033
- Table 3: Global USA Microgreens Industry Revenue Million Forecast, by Import Market Analysis (Value & Volume) 2020 & 2033
- Table 4: Global USA Microgreens Industry Revenue Million Forecast, by Export Market Analysis (Value & Volume) 2020 & 2033
- Table 5: Global USA Microgreens Industry Revenue Million Forecast, by Price Trend Analysis 2020 & 2033
- Table 6: Global USA Microgreens Industry Revenue Million Forecast, by Region 2020 & 2033
- Table 7: Global USA Microgreens Industry Revenue Million Forecast, by Production Analysis 2020 & 2033
- Table 8: Global USA Microgreens Industry Revenue Million Forecast, by Consumption Analysis 2020 & 2033
- Table 9: Global USA Microgreens Industry Revenue Million Forecast, by Import Market Analysis (Value & Volume) 2020 & 2033
- Table 10: Global USA Microgreens Industry Revenue Million Forecast, by Export Market Analysis (Value & Volume) 2020 & 2033
- Table 11: Global USA Microgreens Industry Revenue Million Forecast, by Price Trend Analysis 2020 & 2033
- Table 12: Global USA Microgreens Industry Revenue Million Forecast, by Country 2020 & 2033
- Table 13: United States USA Microgreens Industry Revenue (Million) Forecast, by Application 2020 & 2033
- Table 14: Canada USA Microgreens Industry Revenue (Million) Forecast, by Application 2020 & 2033
- Table 15: Mexico USA Microgreens Industry Revenue (Million) Forecast, by Application 2020 & 2033
- Table 16: Global USA Microgreens Industry Revenue Million Forecast, by Production Analysis 2020 & 2033
- Table 17: Global USA Microgreens Industry Revenue Million Forecast, by Consumption Analysis 2020 & 2033
- Table 18: Global USA Microgreens Industry Revenue Million Forecast, by Import Market Analysis (Value & Volume) 2020 & 2033
- Table 19: Global USA Microgreens Industry Revenue Million Forecast, by Export Market Analysis (Value & Volume) 2020 & 2033
- Table 20: Global USA Microgreens Industry Revenue Million Forecast, by Price Trend Analysis 2020 & 2033
- Table 21: Global USA Microgreens Industry Revenue Million Forecast, by Country 2020 & 2033
- Table 22: Brazil USA Microgreens Industry Revenue (Million) Forecast, by Application 2020 & 2033
- Table 23: Argentina USA Microgreens Industry Revenue (Million) Forecast, by Application 2020 & 2033
- Table 24: Rest of South America USA Microgreens Industry Revenue (Million) Forecast, by Application 2020 & 2033
- Table 25: Global USA Microgreens Industry Revenue Million Forecast, by Production Analysis 2020 & 2033
- Table 26: Global USA Microgreens Industry Revenue Million Forecast, by Consumption Analysis 2020 & 2033
- Table 27: Global USA Microgreens Industry Revenue Million Forecast, by Import Market Analysis (Value & Volume) 2020 & 2033
- Table 28: Global USA Microgreens Industry Revenue Million Forecast, by Export Market Analysis (Value & Volume) 2020 & 2033
- Table 29: Global USA Microgreens Industry Revenue Million Forecast, by Price Trend Analysis 2020 & 2033
- Table 30: Global USA Microgreens Industry Revenue Million Forecast, by Country 2020 & 2033
- Table 31: United Kingdom USA Microgreens Industry Revenue (Million) Forecast, by Application 2020 & 2033
- Table 32: Germany USA Microgreens Industry Revenue (Million) Forecast, by Application 2020 & 2033
- Table 33: France USA Microgreens Industry Revenue (Million) Forecast, by Application 2020 & 2033
- Table 34: Italy USA Microgreens Industry Revenue (Million) Forecast, by Application 2020 & 2033
- Table 35: Spain USA Microgreens Industry Revenue (Million) Forecast, by Application 2020 & 2033
- Table 36: Russia USA Microgreens Industry Revenue (Million) Forecast, by Application 2020 & 2033
- Table 37: Benelux USA Microgreens Industry Revenue (Million) Forecast, by Application 2020 & 2033
- Table 38: Nordics USA Microgreens Industry Revenue (Million) Forecast, by Application 2020 & 2033
- Table 39: Rest of Europe USA Microgreens Industry Revenue (Million) Forecast, by Application 2020 & 2033
- Table 40: Global USA Microgreens Industry Revenue Million Forecast, by Production Analysis 2020 & 2033
- Table 41: Global USA Microgreens Industry Revenue Million Forecast, by Consumption Analysis 2020 & 2033
- Table 42: Global USA Microgreens Industry Revenue Million Forecast, by Import Market Analysis (Value & Volume) 2020 & 2033
- Table 43: Global USA Microgreens Industry Revenue Million Forecast, by Export Market Analysis (Value & Volume) 2020 & 2033
- Table 44: Global USA Microgreens Industry Revenue Million Forecast, by Price Trend Analysis 2020 & 2033
- Table 45: Global USA Microgreens Industry Revenue Million Forecast, by Country 2020 & 2033
- Table 46: Turkey USA Microgreens Industry Revenue (Million) Forecast, by Application 2020 & 2033
- Table 47: Israel USA Microgreens Industry Revenue (Million) Forecast, by Application 2020 & 2033
- Table 48: GCC USA Microgreens Industry Revenue (Million) Forecast, by Application 2020 & 2033
- Table 49: North Africa USA Microgreens Industry Revenue (Million) Forecast, by Application 2020 & 2033
- Table 50: South Africa USA Microgreens Industry Revenue (Million) Forecast, by Application 2020 & 2033
- Table 51: Rest of Middle East & Africa USA Microgreens Industry Revenue (Million) Forecast, by Application 2020 & 2033
- Table 52: Global USA Microgreens Industry Revenue Million Forecast, by Production Analysis 2020 & 2033
- Table 53: Global USA Microgreens Industry Revenue Million Forecast, by Consumption Analysis 2020 & 2033
- Table 54: Global USA Microgreens Industry Revenue Million Forecast, by Import Market Analysis (Value & Volume) 2020 & 2033
- Table 55: Global USA Microgreens Industry Revenue Million Forecast, by Export Market Analysis (Value & Volume) 2020 & 2033
- Table 56: Global USA Microgreens Industry Revenue Million Forecast, by Price Trend Analysis 2020 & 2033
- Table 57: Global USA Microgreens Industry Revenue Million Forecast, by Country 2020 & 2033
- Table 58: China USA Microgreens Industry Revenue (Million) Forecast, by Application 2020 & 2033
- Table 59: India USA Microgreens Industry Revenue (Million) Forecast, by Application 2020 & 2033
- Table 60: Japan USA Microgreens Industry Revenue (Million) Forecast, by Application 2020 & 2033
- Table 61: South Korea USA Microgreens Industry Revenue (Million) Forecast, by Application 2020 & 2033
- Table 62: ASEAN USA Microgreens Industry Revenue (Million) Forecast, by Application 2020 & 2033
- Table 63: Oceania USA Microgreens Industry Revenue (Million) Forecast, by Application 2020 & 2033
- Table 64: Rest of Asia Pacific USA Microgreens Industry Revenue (Million) Forecast, by Application 2020 & 2033
Frequently Asked Questions
1. What is the projected Compound Annual Growth Rate (CAGR) of the USA Microgreens Industry?
The projected CAGR is approximately 10.60%.
2. Which companies are prominent players in the USA Microgreens Industry?
Key companies in the market include The Chef's Garden Inc, Quantum Microgreens, Metro Microgreens, Long Island Microgreens LL, Emerald Gardens, Fresh Origins, Florida Microgreens, Farmbox Greens LLC, Arizona Microgreens LLC, AeroFarms LLC.
3. What are the main segments of the USA Microgreens Industry?
The market segments include Production Analysis, Consumption Analysis, Import Market Analysis (Value & Volume), Export Market Analysis (Value & Volume), Price Trend Analysis.
4. Can you provide details about the market size?
The market size is estimated to be USD 1.74 Million as of 2022.
5. What are some drivers contributing to market growth?
Need for Custom Product Development; Use of CROs for Regulatory Services.
6. What are the notable trends driving market growth?
Increased Investments in Vertical Farming Domain.
7. Are there any restraints impacting market growth?
Data and Cyber Security Concerns; Lack of Experts and Professionals in this Industry.
8. Can you provide examples of recent developments in the market?
September 2022: To meet increased customer demand, AeroFarmsDanville VA established the world's largest Aeroponic Smart Farm with the newest Indoor Vertical Farm capable of growing over 3 million lb of fresh leafy greens annually.
9. What pricing options are available for accessing the report?
Pricing options include single-user, multi-user, and enterprise licenses priced at USD 3800, USD 4500, and USD 5800 respectively.
10. Is the market size provided in terms of value or volume?
The market size is provided in terms of value, measured in Million.
11. Are there any specific market keywords associated with the report?
Yes, the market keyword associated with the report is "USA Microgreens Industry," which aids in identifying and referencing the specific market segment covered.
12. How do I determine which pricing option suits my needs best?
The pricing options vary based on user requirements and access needs. Individual users may opt for single-user licenses, while businesses requiring broader access may choose multi-user or enterprise licenses for cost-effective access to the report.
13. Are there any additional resources or data provided in the USA Microgreens Industry report?
While the report offers comprehensive insights, it's advisable to review the specific contents or supplementary materials provided to ascertain if additional resources or data are available.
14. How can I stay updated on further developments or reports in the USA Microgreens Industry?
To stay informed about further developments, trends, and reports in the USA Microgreens Industry, consider subscribing to industry newsletters, following relevant companies and organizations, or regularly checking reputable industry news sources and publications.
Methodology
Step 1 - Identification of Relevant Samples Size from Population Database


Step 2 - Approaches for Defining Global Market Size (Value, Volume* & Price*)

Note*: In applicable scenarios
Step 3 - Data Sources
Primary Research
- Web Analytics
- Survey Reports
- Research Institute
- Latest Research Reports
- Opinion Leaders
Secondary Research
- Annual Reports
- White Paper
- Latest Press Release
- Industry Association
- Paid Database
- Investor Presentations

Step 4 - Data Triangulation
Involves using different sources of information in order to increase the validity of a study
These sources are likely to be stakeholders in a program - participants, other researchers, program staff, other community members, and so on.
Then we put all data in single framework & apply various statistical tools to find out the dynamic on the market.
During the analysis stage, feedback from the stakeholder groups would be compared to determine areas of agreement as well as areas of divergence