

Key Insights
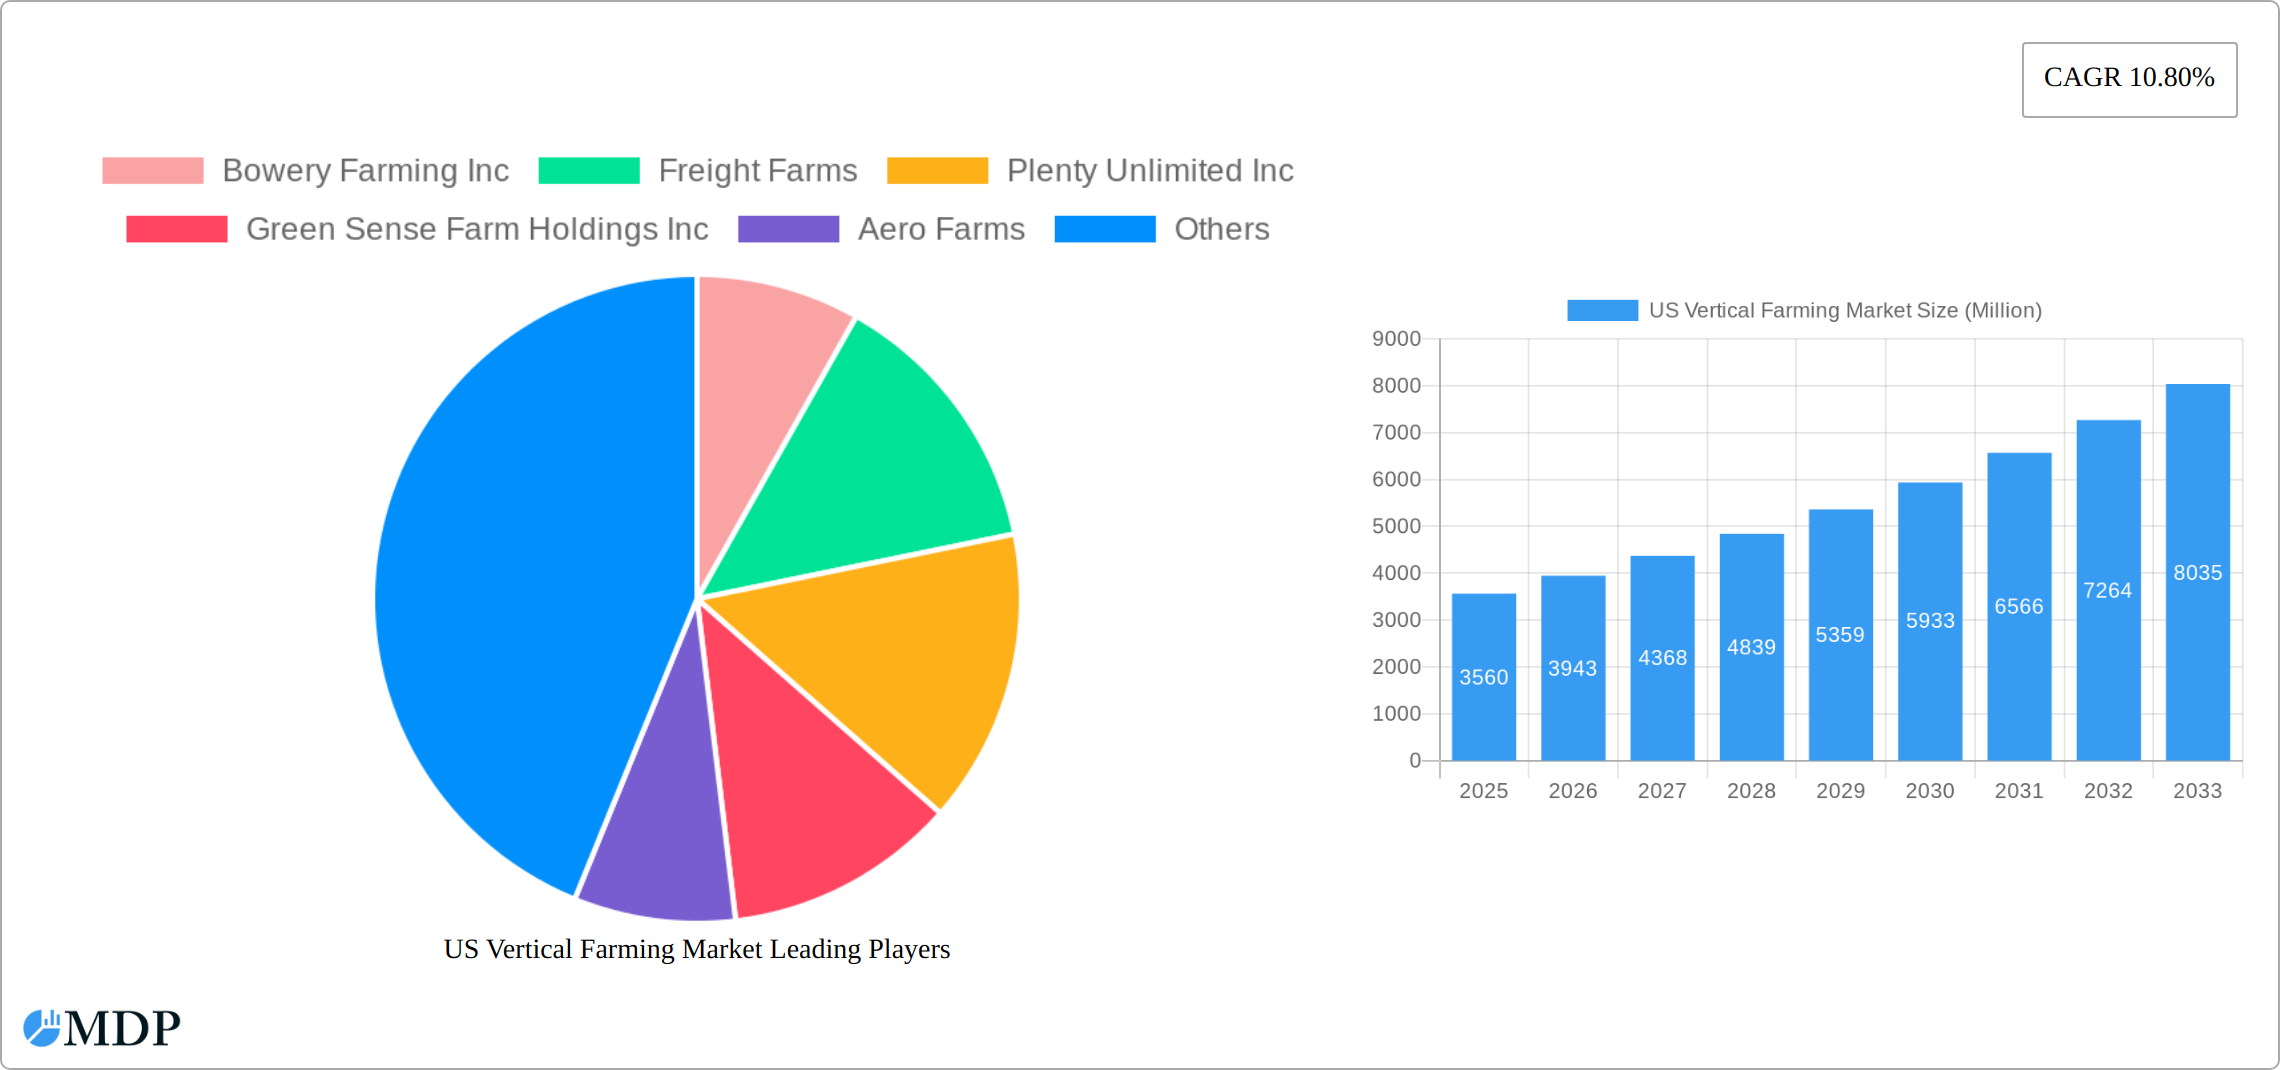
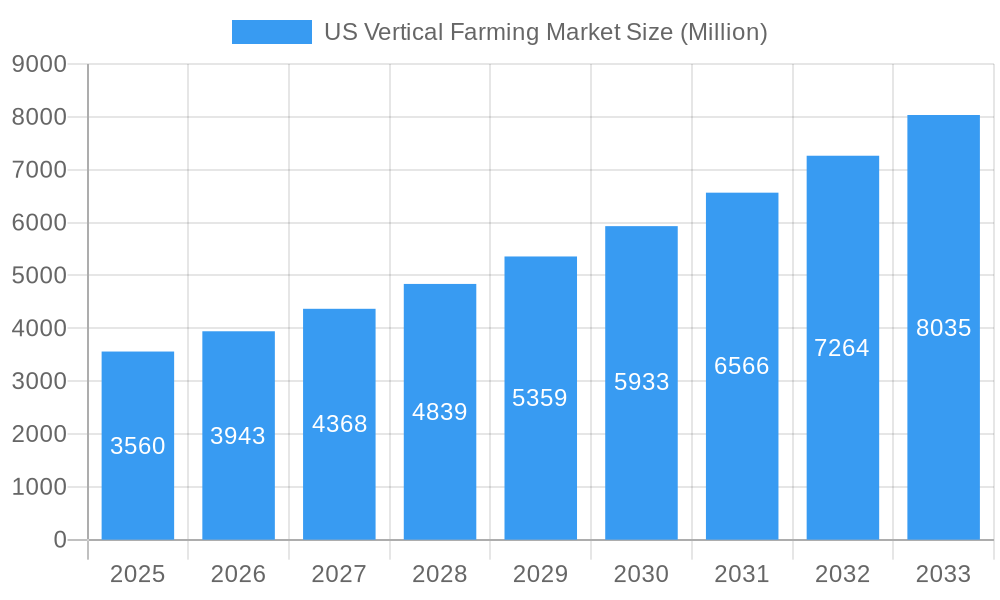
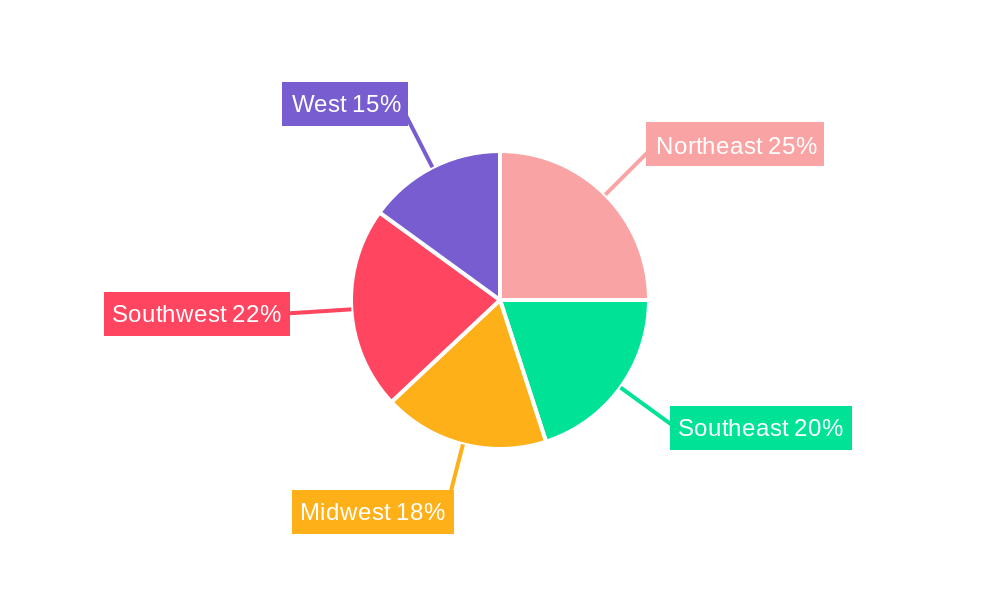
The US vertical farming market, valued at $3.56 billion in 2025, is poised for significant growth, exhibiting a Compound Annual Growth Rate (CAGR) of 10.80% from 2025 to 2033. This expansion is driven by several factors. Increasing urbanization and shrinking arable land are creating a demand for sustainable, locally-sourced food production. Consumer preference for fresh, high-quality produce, coupled with concerns about food miles and environmental impact, fuels the adoption of vertical farming technologies. Technological advancements in areas like aeroponics, hydroponics, and aquaponics, along with innovative farm structures like building-based and shipping container vertical farms, are further contributing to market growth. The diverse range of crops cultivated—fruits and vegetables, herbs and microgreens, and flowers—expands the market's potential. Leading companies like Bowery Farming, Plenty Unlimited, and Aero Farms are driving innovation and market penetration. While challenges exist, such as high initial investment costs and energy consumption, the long-term benefits of vertical farming, including year-round production and reduced reliance on pesticides, are expected to overcome these hurdles. The regional distribution across the US (Northeast, Southeast, Midwest, Southwest, and West) indicates strong potential for growth across diverse climates and consumer markets.
US Vertical Farming Market Market Size (In Billion)
The market segmentation within the US vertical farming sector reveals distinct opportunities. The growth mechanism segment (aeroponics, hydroponics, aquaponics) shows potential for innovation and specialization, while the structure segment (building-based and shipping container farms) reflects diverse approaches to infrastructure and scalability. Crop type diversification offers avenues for market penetration across various consumer preferences and retail channels. Competition among established players and emerging startups is intense, leading to continuous innovation and improvements in efficiency and cost-effectiveness. Government initiatives promoting sustainable agriculture and food security are also expected to further support the growth of the US vertical farming market in the coming years. A projected market size exceeding $10 billion by 2033 is a realistic expectation given the current trajectory.
US Vertical Farming Market Company Market Share
US Vertical Farming Market Report: 2019-2033 - A Comprehensive Analysis
Unlock the potential of the booming US vertical farming market with this in-depth report, providing actionable insights for investors, industry players, and researchers. This comprehensive study analyzes the US vertical farming market from 2019 to 2033, offering a detailed understanding of market dynamics, growth drivers, challenges, and future opportunities. The report covers key segments including aeroponics, hydroponics, and aquaponics, across various structures (building-based and shipping container farms), and crop types (fruits & vegetables, herbs & microgreens, flowers & ornamentals). Market size is projected to reach xx Million by 2033, presenting significant investment potential.
US Vertical Farming Market Market Dynamics & Concentration
The US vertical farming market is characterized by a dynamic and evolving landscape, with increasing market concentration driven by substantial investments and strategic mergers & acquisitions (M&A). While precise market share data for individual companies can fluctuate, prominent players like Bowery Farming, Aero Farms, and Plenty Unlimited command significant portions of the market. The past few years have witnessed a notable surge in M&A activity within the sector, with over xx deals recorded between 2019 and 2024. This trend underscores a strategic push towards consolidation, market expansion, and the integration of innovative technologies.
- Innovation as a Catalyst: Continuous technological advancements in LED lighting, sophisticated automation, and data analytics are pivotal drivers, significantly enhancing operational efficiency and maximizing crop yields.
- Supportive Regulatory Environment: Government initiatives aimed at promoting sustainable agriculture and bolstering food security are fostering a more favorable regulatory framework, encouraging further development and adoption of vertical farming practices.
- Competitive Edge Over Substitutes: While traditional agriculture remains a primary food source, vertical farming offers distinct advantages, including superior yield per square foot, exceptional resource efficiency (water, land), and the capability for year-round, climate-controlled production, mitigating external environmental factors.
- Evolving End-User Preferences: A growing consumer demand for fresh, locally sourced produce, coupled with an increased awareness and preference for sustainable food production methods, are powerful engines fueling the market's expansion and driving consumer adoption.
- Accelerated M&A Activity: Strategic acquisitions by larger corporations are a key factor in the increasing market concentration. These deals not only drive technological innovation through resource pooling but also facilitate expanded market reach and broader distribution networks. The volume of M&A transactions is anticipated to remain robust throughout the forecast period, signaling a maturing and consolidating industry.
US Vertical Farming Market Industry Trends & Analysis
The US vertical farming market is on a trajectory of robust and sustained growth, propelled by a confluence of significant factors. The compound annual growth rate (CAGR) for the period 2025-2033 is projected to reach an impressive xx%, notably surpassing the historical CAGR of xx% observed between 2019 and 2024. Market penetration is steadily expanding, particularly within densely populated urban centers, driven by escalating consumer demand and the inherent advantages of vertical farming technologies concerning efficiency, environmental sustainability, and superior product quality. The integration of cutting-edge technological innovations, including AI-powered automation for optimized operations, precision sensors for real-time environmental monitoring, and advanced climate control systems, is instrumental in elevating crop yields and substantially reducing operational expenditures. The strong consumer preference for locally sourced and sustainably grown produce, combined with a heightened societal awareness of food security challenges, is a critical catalyst for this upward trend. The competitive landscape is defined by a relentless pursuit of innovation, the formation of strategic partnerships, and an ongoing endeavor to refine and optimize production processes for maximum efficacy and profitability.
Leading Markets & Segments in US Vertical Farming Market
The US vertical farming market shows significant regional variations in growth. While data for precise regional dominance is unavailable, California, due to its technological prowess and agricultural heritage, holds a significant position. Within segments, building-based vertical farms are currently dominant due to their larger capacity and scalability compared to shipping container farms. However, shipping container farms represent a rapidly expanding segment, particularly in urban settings where space is constrained.
- Growth Mechanisms: Hydroponics currently holds the largest market share, owing to its established technology and cost-effectiveness. However, aeroponics and aquaponics are witnessing rapid growth, driven by their efficiency and potential for higher yields.
- Crop Types: Fruits and vegetables constitute the largest segment, followed by herbs and microgreens. Flowers and ornamentals represent a smaller but growing niche market.
- Key Drivers: Government support, such as grants and tax incentives, is a significant driver. Technological advancements, access to capital, and robust infrastructure contribute significantly to growth in key regions.
US Vertical Farming Market Product Developments
Recent years have witnessed a paradigm shift in vertical farming technologies, characterized by significant and impactful advancements. Innovations in energy-efficient LED lighting systems, highly automated and precise irrigation networks, and sophisticated climate control mechanisms are collectively contributing to enhanced crop yields and a marked reduction in operational costs. Furthermore, the development of novel techniques for proactive disease management and environmentally friendly pest control strategies is bolstering the sustainability profile of vertical farming and minimizing its ecological footprint. These continuous product improvements are directly translating into higher-quality produce and a strengthened competitive position for vertical farming operations in the market.
Key Drivers of US Vertical Farming Market Growth
Several factors contribute to the growth of the US vertical farming market:
- Technological Advancements: Automation, improved lighting systems, and data analytics boost efficiency and yield.
- Economic Incentives: Government subsidies and tax breaks encourage investment in sustainable agriculture.
- Consumer Demand: Growing demand for fresh, locally-sourced, and sustainably grown produce drives market expansion.
- Environmental Concerns: Reduced water usage and land consumption make vertical farming an appealing solution.
Challenges in the US Vertical Farming Market Market
Several challenges hinder the growth of the US vertical farming market:
- High Initial Investment Costs: Setting up vertical farms requires significant capital expenditure.
- Energy Consumption: Vertical farming can be energy-intensive, impacting operational costs.
- Supply Chain Issues: Sourcing components and skilled labor can be challenging.
- Competition from Traditional Agriculture: Traditional farming methods still hold a significant market share. These challenges result in an estimated xx Million loss annually.
Emerging Opportunities in US Vertical Farming Market
The long-term outlook for the US vertical farming market is positive. Emerging opportunities include the increasing adoption of AI and machine learning for optimized resource management, expansion into new crop types, and strategic partnerships with large retailers.
Leading Players in the US Vertical Farming Market Sector
- Bowery Farming Inc
- Freight Farms
- Plenty Unlimited Inc
- Green Sense Farm Holdings Inc
- Aero Farms
- Altius Farm
- Green Spirit Farms
Key Milestones in US Vertical Farming Market Industry
- August 2023: Plenty Unlimited Inc. announces construction of a USD 300 Million vertical farming campus.
- February 2022: Aero Farms partners with FFAR and the University of Florida for tomato research.
- January 2022: Plenty and Walmart announce a long-term investment partnership.
Strategic Outlook for US Vertical Farming Market Market
The US vertical farming market is poised for substantial and sustained expansion, fueled by a powerful combination of rapid technological advancements, escalating consumer demand for fresh and sustainable food, and increasingly supportive government policies. Strategic partnerships, targeted expansion into untapped geographical regions, and the diversification of crop portfolios represent significant avenues for market players to capitalize on. The industry is on a clear growth trajectory, driven by the imperative for environmental sustainability and the critical need for resilient, high-quality food production systems to meet future demands.
US Vertical Farming Market Segmentation
- 1. Production Analysis
- 2. Consumption Analysis
- 3. Import Market Analysis (Value & Volume)
- 4. Export Market Analysis (Value & Volume)
- 5. Price Trend Analysis
US Vertical Farming Market Segmentation By Geography
-
1. North America
- 1.1. United States
- 1.2. Canada
- 1.3. Mexico
-
2. South America
- 2.1. Brazil
- 2.2. Argentina
- 2.3. Rest of South America
-
3. Europe
- 3.1. United Kingdom
- 3.2. Germany
- 3.3. France
- 3.4. Italy
- 3.5. Spain
- 3.6. Russia
- 3.7. Benelux
- 3.8. Nordics
- 3.9. Rest of Europe
-
4. Middle East & Africa
- 4.1. Turkey
- 4.2. Israel
- 4.3. GCC
- 4.4. North Africa
- 4.5. South Africa
- 4.6. Rest of Middle East & Africa
-
5. Asia Pacific
- 5.1. China
- 5.2. India
- 5.3. Japan
- 5.4. South Korea
- 5.5. ASEAN
- 5.6. Oceania
- 5.7. Rest of Asia Pacific
US Vertical Farming Market Regional Market Share
Geographic Coverage of US Vertical Farming Market
US Vertical Farming Market REPORT HIGHLIGHTS
| Aspects | Details |
|---|---|
| Study Period | 2020-2034 |
| Base Year | 2025 |
| Estimated Year | 2026 |
| Forecast Period | 2026-2034 |
| Historical Period | 2020-2025 |
| Growth Rate | CAGR of 10.80% from 2020-2034 |
| Segmentation |
|
Table of Contents
- 1. Introduction
- 1.1. Research Scope
- 1.2. Market Segmentation
- 1.3. Research Objective
- 1.4. Definitions and Assumptions
- 2. Executive Summary
- 2.1. Market Snapshot
- 3. Market Dynamics
- 3.1. Market Drivers
- 3.2. Market Restrains
- 3.3. Market Trends
- 3.4. Market Opportunities
- 4. Market Factor Analysis
- 4.1. Porters Five Forces
- 4.1.1. Bargaining Power of Suppliers
- 4.1.2. Bargaining Power of Buyers
- 4.1.3. Threat of New Entrants
- 4.1.4. Threat of Substitutes
- 4.1.5. Competitive Rivalry
- 4.2. PESTEL analysis
- 4.3. BCG Analysis
- 4.3.1. Stars (High Growth, High Market Share)
- 4.3.2. Cash Cows (Low Growth, High Market Share)
- 4.3.3. Question Mark (High Growth, Low Market Share)
- 4.3.4. Dogs (Low Growth, Low Market Share)
- 4.4. Ansoff Matrix Analysis
- 4.5. Supply Chain Analysis
- 4.6. Regulatory Landscape
- 4.7. Current Market Potential and Opportunity Assessment (TAM–SAM–SOM Framework)
- 4.8. MDP Analyst Note
- 4.1. Porters Five Forces
- 5. Market Analysis, Insights and Forecast 2021-2033
- 5.1. Market Analysis, Insights and Forecast - by Production Analysis
- 5.2. Market Analysis, Insights and Forecast - by Consumption Analysis
- 5.3. Market Analysis, Insights and Forecast - by Import Market Analysis (Value & Volume)
- 5.4. Market Analysis, Insights and Forecast - by Export Market Analysis (Value & Volume)
- 5.5. Market Analysis, Insights and Forecast - by Price Trend Analysis
- 5.6. Market Analysis, Insights and Forecast - by Region
- 5.6.1. North America
- 5.6.2. South America
- 5.6.3. Europe
- 5.6.4. Middle East & Africa
- 5.6.5. Asia Pacific
- 6. Global US Vertical Farming Market Analysis, Insights and Forecast, 2021-2033
- 6.1. Market Analysis, Insights and Forecast - by Production Analysis
- 6.2. Market Analysis, Insights and Forecast - by Consumption Analysis
- 6.3. Market Analysis, Insights and Forecast - by Import Market Analysis (Value & Volume)
- 6.4. Market Analysis, Insights and Forecast - by Export Market Analysis (Value & Volume)
- 6.5. Market Analysis, Insights and Forecast - by Price Trend Analysis
- 7. North America US Vertical Farming Market Analysis, Insights and Forecast, 2020-2032
- 7.1. Market Analysis, Insights and Forecast - by Production Analysis
- 7.2. Market Analysis, Insights and Forecast - by Consumption Analysis
- 7.3. Market Analysis, Insights and Forecast - by Import Market Analysis (Value & Volume)
- 7.4. Market Analysis, Insights and Forecast - by Export Market Analysis (Value & Volume)
- 7.5. Market Analysis, Insights and Forecast - by Price Trend Analysis
- 8. South America US Vertical Farming Market Analysis, Insights and Forecast, 2020-2032
- 8.1. Market Analysis, Insights and Forecast - by Production Analysis
- 8.2. Market Analysis, Insights and Forecast - by Consumption Analysis
- 8.3. Market Analysis, Insights and Forecast - by Import Market Analysis (Value & Volume)
- 8.4. Market Analysis, Insights and Forecast - by Export Market Analysis (Value & Volume)
- 8.5. Market Analysis, Insights and Forecast - by Price Trend Analysis
- 9. Europe US Vertical Farming Market Analysis, Insights and Forecast, 2020-2032
- 9.1. Market Analysis, Insights and Forecast - by Production Analysis
- 9.2. Market Analysis, Insights and Forecast - by Consumption Analysis
- 9.3. Market Analysis, Insights and Forecast - by Import Market Analysis (Value & Volume)
- 9.4. Market Analysis, Insights and Forecast - by Export Market Analysis (Value & Volume)
- 9.5. Market Analysis, Insights and Forecast - by Price Trend Analysis
- 10. Middle East & Africa US Vertical Farming Market Analysis, Insights and Forecast, 2020-2032
- 10.1. Market Analysis, Insights and Forecast - by Production Analysis
- 10.2. Market Analysis, Insights and Forecast - by Consumption Analysis
- 10.3. Market Analysis, Insights and Forecast - by Import Market Analysis (Value & Volume)
- 10.4. Market Analysis, Insights and Forecast - by Export Market Analysis (Value & Volume)
- 10.5. Market Analysis, Insights and Forecast - by Price Trend Analysis
- 11. Asia Pacific US Vertical Farming Market Analysis, Insights and Forecast, 2020-2032
- 11.1. Market Analysis, Insights and Forecast - by Production Analysis
- 11.2. Market Analysis, Insights and Forecast - by Consumption Analysis
- 11.3. Market Analysis, Insights and Forecast - by Import Market Analysis (Value & Volume)
- 11.4. Market Analysis, Insights and Forecast - by Export Market Analysis (Value & Volume)
- 11.5. Market Analysis, Insights and Forecast - by Price Trend Analysis
- 12. Competitive Analysis
- 12.1. Company Profiles
- 12.1.1 Bowery Farming Inc
- 12.1.1.1. Company Overview
- 12.1.1.2. Products
- 12.1.1.3. Company Financials
- 12.1.1.4. SWOT Analysis
- 12.1.2 Freight Farms
- 12.1.2.1. Company Overview
- 12.1.2.2. Products
- 12.1.2.3. Company Financials
- 12.1.2.4. SWOT Analysis
- 12.1.3 Plenty Unlimited Inc
- 12.1.3.1. Company Overview
- 12.1.3.2. Products
- 12.1.3.3. Company Financials
- 12.1.3.4. SWOT Analysis
- 12.1.4 Green Sense Farm Holdings Inc
- 12.1.4.1. Company Overview
- 12.1.4.2. Products
- 12.1.4.3. Company Financials
- 12.1.4.4. SWOT Analysis
- 12.1.5 Aero Farms
- 12.1.5.1. Company Overview
- 12.1.5.2. Products
- 12.1.5.3. Company Financials
- 12.1.5.4. SWOT Analysis
- 12.1.6 Altius Farm
- 12.1.6.1. Company Overview
- 12.1.6.2. Products
- 12.1.6.3. Company Financials
- 12.1.6.4. SWOT Analysis
- 12.1.7 Green Spirit Farms
- 12.1.7.1. Company Overview
- 12.1.7.2. Products
- 12.1.7.3. Company Financials
- 12.1.7.4. SWOT Analysis
- 12.1.1 Bowery Farming Inc
- 12.2. Market Entropy
- 12.2.1 Company's Key Areas Served
- 12.2.2 Recent Developments
- 12.3. Company Market Share Analysis 2025
- 12.3.1 Top 5 Companies Market Share Analysis
- 12.3.2 Top 3 Companies Market Share Analysis
- 12.4. List of Potential Customers
- 13. Research Methodology
List of Figures
- Figure 1: Global US Vertical Farming Market Revenue Breakdown (Million, %) by Region 2025 & 2033
- Figure 2: North America US Vertical Farming Market Revenue (Million), by Production Analysis 2025 & 2033
- Figure 3: North America US Vertical Farming Market Revenue Share (%), by Production Analysis 2025 & 2033
- Figure 4: North America US Vertical Farming Market Revenue (Million), by Consumption Analysis 2025 & 2033
- Figure 5: North America US Vertical Farming Market Revenue Share (%), by Consumption Analysis 2025 & 2033
- Figure 6: North America US Vertical Farming Market Revenue (Million), by Import Market Analysis (Value & Volume) 2025 & 2033
- Figure 7: North America US Vertical Farming Market Revenue Share (%), by Import Market Analysis (Value & Volume) 2025 & 2033
- Figure 8: North America US Vertical Farming Market Revenue (Million), by Export Market Analysis (Value & Volume) 2025 & 2033
- Figure 9: North America US Vertical Farming Market Revenue Share (%), by Export Market Analysis (Value & Volume) 2025 & 2033
- Figure 10: North America US Vertical Farming Market Revenue (Million), by Price Trend Analysis 2025 & 2033
- Figure 11: North America US Vertical Farming Market Revenue Share (%), by Price Trend Analysis 2025 & 2033
- Figure 12: North America US Vertical Farming Market Revenue (Million), by Country 2025 & 2033
- Figure 13: North America US Vertical Farming Market Revenue Share (%), by Country 2025 & 2033
- Figure 14: South America US Vertical Farming Market Revenue (Million), by Production Analysis 2025 & 2033
- Figure 15: South America US Vertical Farming Market Revenue Share (%), by Production Analysis 2025 & 2033
- Figure 16: South America US Vertical Farming Market Revenue (Million), by Consumption Analysis 2025 & 2033
- Figure 17: South America US Vertical Farming Market Revenue Share (%), by Consumption Analysis 2025 & 2033
- Figure 18: South America US Vertical Farming Market Revenue (Million), by Import Market Analysis (Value & Volume) 2025 & 2033
- Figure 19: South America US Vertical Farming Market Revenue Share (%), by Import Market Analysis (Value & Volume) 2025 & 2033
- Figure 20: South America US Vertical Farming Market Revenue (Million), by Export Market Analysis (Value & Volume) 2025 & 2033
- Figure 21: South America US Vertical Farming Market Revenue Share (%), by Export Market Analysis (Value & Volume) 2025 & 2033
- Figure 22: South America US Vertical Farming Market Revenue (Million), by Price Trend Analysis 2025 & 2033
- Figure 23: South America US Vertical Farming Market Revenue Share (%), by Price Trend Analysis 2025 & 2033
- Figure 24: South America US Vertical Farming Market Revenue (Million), by Country 2025 & 2033
- Figure 25: South America US Vertical Farming Market Revenue Share (%), by Country 2025 & 2033
- Figure 26: Europe US Vertical Farming Market Revenue (Million), by Production Analysis 2025 & 2033
- Figure 27: Europe US Vertical Farming Market Revenue Share (%), by Production Analysis 2025 & 2033
- Figure 28: Europe US Vertical Farming Market Revenue (Million), by Consumption Analysis 2025 & 2033
- Figure 29: Europe US Vertical Farming Market Revenue Share (%), by Consumption Analysis 2025 & 2033
- Figure 30: Europe US Vertical Farming Market Revenue (Million), by Import Market Analysis (Value & Volume) 2025 & 2033
- Figure 31: Europe US Vertical Farming Market Revenue Share (%), by Import Market Analysis (Value & Volume) 2025 & 2033
- Figure 32: Europe US Vertical Farming Market Revenue (Million), by Export Market Analysis (Value & Volume) 2025 & 2033
- Figure 33: Europe US Vertical Farming Market Revenue Share (%), by Export Market Analysis (Value & Volume) 2025 & 2033
- Figure 34: Europe US Vertical Farming Market Revenue (Million), by Price Trend Analysis 2025 & 2033
- Figure 35: Europe US Vertical Farming Market Revenue Share (%), by Price Trend Analysis 2025 & 2033
- Figure 36: Europe US Vertical Farming Market Revenue (Million), by Country 2025 & 2033
- Figure 37: Europe US Vertical Farming Market Revenue Share (%), by Country 2025 & 2033
- Figure 38: Middle East & Africa US Vertical Farming Market Revenue (Million), by Production Analysis 2025 & 2033
- Figure 39: Middle East & Africa US Vertical Farming Market Revenue Share (%), by Production Analysis 2025 & 2033
- Figure 40: Middle East & Africa US Vertical Farming Market Revenue (Million), by Consumption Analysis 2025 & 2033
- Figure 41: Middle East & Africa US Vertical Farming Market Revenue Share (%), by Consumption Analysis 2025 & 2033
- Figure 42: Middle East & Africa US Vertical Farming Market Revenue (Million), by Import Market Analysis (Value & Volume) 2025 & 2033
- Figure 43: Middle East & Africa US Vertical Farming Market Revenue Share (%), by Import Market Analysis (Value & Volume) 2025 & 2033
- Figure 44: Middle East & Africa US Vertical Farming Market Revenue (Million), by Export Market Analysis (Value & Volume) 2025 & 2033
- Figure 45: Middle East & Africa US Vertical Farming Market Revenue Share (%), by Export Market Analysis (Value & Volume) 2025 & 2033
- Figure 46: Middle East & Africa US Vertical Farming Market Revenue (Million), by Price Trend Analysis 2025 & 2033
- Figure 47: Middle East & Africa US Vertical Farming Market Revenue Share (%), by Price Trend Analysis 2025 & 2033
- Figure 48: Middle East & Africa US Vertical Farming Market Revenue (Million), by Country 2025 & 2033
- Figure 49: Middle East & Africa US Vertical Farming Market Revenue Share (%), by Country 2025 & 2033
- Figure 50: Asia Pacific US Vertical Farming Market Revenue (Million), by Production Analysis 2025 & 2033
- Figure 51: Asia Pacific US Vertical Farming Market Revenue Share (%), by Production Analysis 2025 & 2033
- Figure 52: Asia Pacific US Vertical Farming Market Revenue (Million), by Consumption Analysis 2025 & 2033
- Figure 53: Asia Pacific US Vertical Farming Market Revenue Share (%), by Consumption Analysis 2025 & 2033
- Figure 54: Asia Pacific US Vertical Farming Market Revenue (Million), by Import Market Analysis (Value & Volume) 2025 & 2033
- Figure 55: Asia Pacific US Vertical Farming Market Revenue Share (%), by Import Market Analysis (Value & Volume) 2025 & 2033
- Figure 56: Asia Pacific US Vertical Farming Market Revenue (Million), by Export Market Analysis (Value & Volume) 2025 & 2033
- Figure 57: Asia Pacific US Vertical Farming Market Revenue Share (%), by Export Market Analysis (Value & Volume) 2025 & 2033
- Figure 58: Asia Pacific US Vertical Farming Market Revenue (Million), by Price Trend Analysis 2025 & 2033
- Figure 59: Asia Pacific US Vertical Farming Market Revenue Share (%), by Price Trend Analysis 2025 & 2033
- Figure 60: Asia Pacific US Vertical Farming Market Revenue (Million), by Country 2025 & 2033
- Figure 61: Asia Pacific US Vertical Farming Market Revenue Share (%), by Country 2025 & 2033
List of Tables
- Table 1: Global US Vertical Farming Market Revenue Million Forecast, by Production Analysis 2020 & 2033
- Table 2: Global US Vertical Farming Market Revenue Million Forecast, by Consumption Analysis 2020 & 2033
- Table 3: Global US Vertical Farming Market Revenue Million Forecast, by Import Market Analysis (Value & Volume) 2020 & 2033
- Table 4: Global US Vertical Farming Market Revenue Million Forecast, by Export Market Analysis (Value & Volume) 2020 & 2033
- Table 5: Global US Vertical Farming Market Revenue Million Forecast, by Price Trend Analysis 2020 & 2033
- Table 6: Global US Vertical Farming Market Revenue Million Forecast, by Region 2020 & 2033
- Table 7: Global US Vertical Farming Market Revenue Million Forecast, by Production Analysis 2020 & 2033
- Table 8: Global US Vertical Farming Market Revenue Million Forecast, by Consumption Analysis 2020 & 2033
- Table 9: Global US Vertical Farming Market Revenue Million Forecast, by Import Market Analysis (Value & Volume) 2020 & 2033
- Table 10: Global US Vertical Farming Market Revenue Million Forecast, by Export Market Analysis (Value & Volume) 2020 & 2033
- Table 11: Global US Vertical Farming Market Revenue Million Forecast, by Price Trend Analysis 2020 & 2033
- Table 12: Global US Vertical Farming Market Revenue Million Forecast, by Country 2020 & 2033
- Table 13: United States US Vertical Farming Market Revenue (Million) Forecast, by Application 2020 & 2033
- Table 14: Canada US Vertical Farming Market Revenue (Million) Forecast, by Application 2020 & 2033
- Table 15: Mexico US Vertical Farming Market Revenue (Million) Forecast, by Application 2020 & 2033
- Table 16: Global US Vertical Farming Market Revenue Million Forecast, by Production Analysis 2020 & 2033
- Table 17: Global US Vertical Farming Market Revenue Million Forecast, by Consumption Analysis 2020 & 2033
- Table 18: Global US Vertical Farming Market Revenue Million Forecast, by Import Market Analysis (Value & Volume) 2020 & 2033
- Table 19: Global US Vertical Farming Market Revenue Million Forecast, by Export Market Analysis (Value & Volume) 2020 & 2033
- Table 20: Global US Vertical Farming Market Revenue Million Forecast, by Price Trend Analysis 2020 & 2033
- Table 21: Global US Vertical Farming Market Revenue Million Forecast, by Country 2020 & 2033
- Table 22: Brazil US Vertical Farming Market Revenue (Million) Forecast, by Application 2020 & 2033
- Table 23: Argentina US Vertical Farming Market Revenue (Million) Forecast, by Application 2020 & 2033
- Table 24: Rest of South America US Vertical Farming Market Revenue (Million) Forecast, by Application 2020 & 2033
- Table 25: Global US Vertical Farming Market Revenue Million Forecast, by Production Analysis 2020 & 2033
- Table 26: Global US Vertical Farming Market Revenue Million Forecast, by Consumption Analysis 2020 & 2033
- Table 27: Global US Vertical Farming Market Revenue Million Forecast, by Import Market Analysis (Value & Volume) 2020 & 2033
- Table 28: Global US Vertical Farming Market Revenue Million Forecast, by Export Market Analysis (Value & Volume) 2020 & 2033
- Table 29: Global US Vertical Farming Market Revenue Million Forecast, by Price Trend Analysis 2020 & 2033
- Table 30: Global US Vertical Farming Market Revenue Million Forecast, by Country 2020 & 2033
- Table 31: United Kingdom US Vertical Farming Market Revenue (Million) Forecast, by Application 2020 & 2033
- Table 32: Germany US Vertical Farming Market Revenue (Million) Forecast, by Application 2020 & 2033
- Table 33: France US Vertical Farming Market Revenue (Million) Forecast, by Application 2020 & 2033
- Table 34: Italy US Vertical Farming Market Revenue (Million) Forecast, by Application 2020 & 2033
- Table 35: Spain US Vertical Farming Market Revenue (Million) Forecast, by Application 2020 & 2033
- Table 36: Russia US Vertical Farming Market Revenue (Million) Forecast, by Application 2020 & 2033
- Table 37: Benelux US Vertical Farming Market Revenue (Million) Forecast, by Application 2020 & 2033
- Table 38: Nordics US Vertical Farming Market Revenue (Million) Forecast, by Application 2020 & 2033
- Table 39: Rest of Europe US Vertical Farming Market Revenue (Million) Forecast, by Application 2020 & 2033
- Table 40: Global US Vertical Farming Market Revenue Million Forecast, by Production Analysis 2020 & 2033
- Table 41: Global US Vertical Farming Market Revenue Million Forecast, by Consumption Analysis 2020 & 2033
- Table 42: Global US Vertical Farming Market Revenue Million Forecast, by Import Market Analysis (Value & Volume) 2020 & 2033
- Table 43: Global US Vertical Farming Market Revenue Million Forecast, by Export Market Analysis (Value & Volume) 2020 & 2033
- Table 44: Global US Vertical Farming Market Revenue Million Forecast, by Price Trend Analysis 2020 & 2033
- Table 45: Global US Vertical Farming Market Revenue Million Forecast, by Country 2020 & 2033
- Table 46: Turkey US Vertical Farming Market Revenue (Million) Forecast, by Application 2020 & 2033
- Table 47: Israel US Vertical Farming Market Revenue (Million) Forecast, by Application 2020 & 2033
- Table 48: GCC US Vertical Farming Market Revenue (Million) Forecast, by Application 2020 & 2033
- Table 49: North Africa US Vertical Farming Market Revenue (Million) Forecast, by Application 2020 & 2033
- Table 50: South Africa US Vertical Farming Market Revenue (Million) Forecast, by Application 2020 & 2033
- Table 51: Rest of Middle East & Africa US Vertical Farming Market Revenue (Million) Forecast, by Application 2020 & 2033
- Table 52: Global US Vertical Farming Market Revenue Million Forecast, by Production Analysis 2020 & 2033
- Table 53: Global US Vertical Farming Market Revenue Million Forecast, by Consumption Analysis 2020 & 2033
- Table 54: Global US Vertical Farming Market Revenue Million Forecast, by Import Market Analysis (Value & Volume) 2020 & 2033
- Table 55: Global US Vertical Farming Market Revenue Million Forecast, by Export Market Analysis (Value & Volume) 2020 & 2033
- Table 56: Global US Vertical Farming Market Revenue Million Forecast, by Price Trend Analysis 2020 & 2033
- Table 57: Global US Vertical Farming Market Revenue Million Forecast, by Country 2020 & 2033
- Table 58: China US Vertical Farming Market Revenue (Million) Forecast, by Application 2020 & 2033
- Table 59: India US Vertical Farming Market Revenue (Million) Forecast, by Application 2020 & 2033
- Table 60: Japan US Vertical Farming Market Revenue (Million) Forecast, by Application 2020 & 2033
- Table 61: South Korea US Vertical Farming Market Revenue (Million) Forecast, by Application 2020 & 2033
- Table 62: ASEAN US Vertical Farming Market Revenue (Million) Forecast, by Application 2020 & 2033
- Table 63: Oceania US Vertical Farming Market Revenue (Million) Forecast, by Application 2020 & 2033
- Table 64: Rest of Asia Pacific US Vertical Farming Market Revenue (Million) Forecast, by Application 2020 & 2033
Frequently Asked Questions
1. What is the projected Compound Annual Growth Rate (CAGR) of the US Vertical Farming Market?
The projected CAGR is approximately 10.80%.
2. Which companies are prominent players in the US Vertical Farming Market?
Key companies in the market include Bowery Farming Inc, Freight Farms, Plenty Unlimited Inc, Green Sense Farm Holdings Inc, Aero Farms, Altius Farm, Green Spirit Farms.
3. What are the main segments of the US Vertical Farming Market?
The market segments include Production Analysis, Consumption Analysis, Import Market Analysis (Value & Volume), Export Market Analysis (Value & Volume), Price Trend Analysis.
4. Can you provide details about the market size?
The market size is estimated to be USD 3.56 Million as of 2022.
5. What are some drivers contributing to market growth?
Seed Treatment As A Solution To Enhance Yield; Growing Awareness For Seed Treatment Among The Farmers; Rising Trend Of Organic Farming.
6. What are the notable trends driving market growth?
The Hydroponics Segment Dominates the Market.
7. Are there any restraints impacting market growth?
Limitations Across Farm-Level Seed Treatment; Rising Environmental Concerns.
8. Can you provide examples of recent developments in the market?
August 2023: Plenty Unlimited Inc., a San Francisco-based company, began construction on a vertical indoor farming campus that, when completed, is likely to be the largest such operation in the world. The campus, to be developed in phases totaling USD 300 million, will sit on 120 acres in the Meadowville Technology Park.
9. What pricing options are available for accessing the report?
Pricing options include single-user, multi-user, and enterprise licenses priced at USD 3800, USD 4500, and USD 5800 respectively.
10. Is the market size provided in terms of value or volume?
The market size is provided in terms of value, measured in Million.
11. Are there any specific market keywords associated with the report?
Yes, the market keyword associated with the report is "US Vertical Farming Market," which aids in identifying and referencing the specific market segment covered.
12. How do I determine which pricing option suits my needs best?
The pricing options vary based on user requirements and access needs. Individual users may opt for single-user licenses, while businesses requiring broader access may choose multi-user or enterprise licenses for cost-effective access to the report.
13. Are there any additional resources or data provided in the US Vertical Farming Market report?
While the report offers comprehensive insights, it's advisable to review the specific contents or supplementary materials provided to ascertain if additional resources or data are available.
14. How can I stay updated on further developments or reports in the US Vertical Farming Market?
To stay informed about further developments, trends, and reports in the US Vertical Farming Market, consider subscribing to industry newsletters, following relevant companies and organizations, or regularly checking reputable industry news sources and publications.
Methodology
Step 1 - Identification of Relevant Samples Size from Population Database


Step 2 - Approaches for Defining Global Market Size (Value, Volume* & Price*)

Note*: In applicable scenarios
Step 3 - Data Sources
Primary Research
- Web Analytics
- Survey Reports
- Research Institute
- Latest Research Reports
- Opinion Leaders
Secondary Research
- Annual Reports
- White Paper
- Latest Press Release
- Industry Association
- Paid Database
- Investor Presentations

Step 4 - Data Triangulation
Involves using different sources of information in order to increase the validity of a study
These sources are likely to be stakeholders in a program - participants, other researchers, program staff, other community members, and so on.
Then we put all data in single framework & apply various statistical tools to find out the dynamic on the market.
During the analysis stage, feedback from the stakeholder groups would be compared to determine areas of agreement as well as areas of divergence