

Key Insights
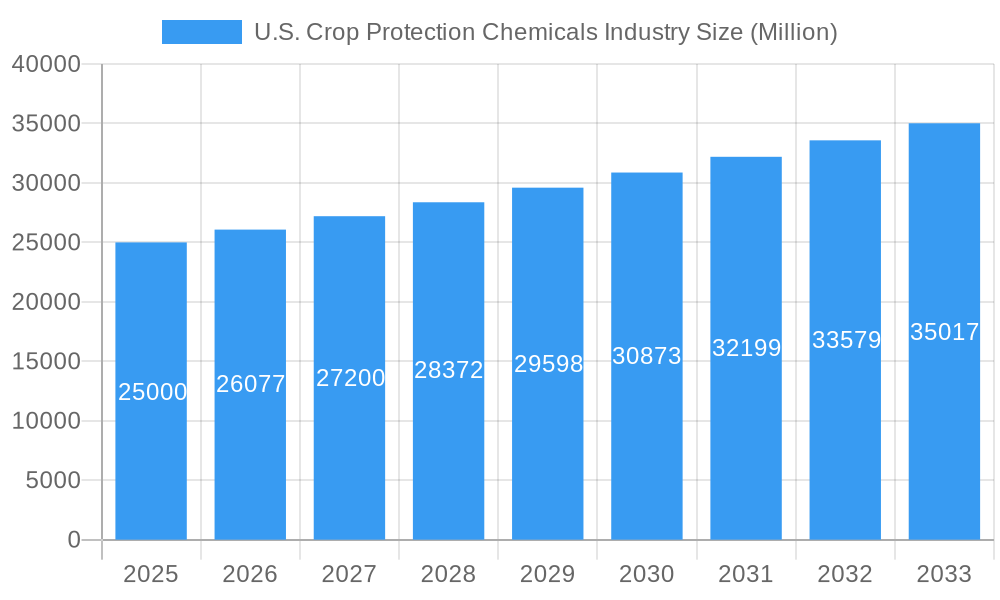
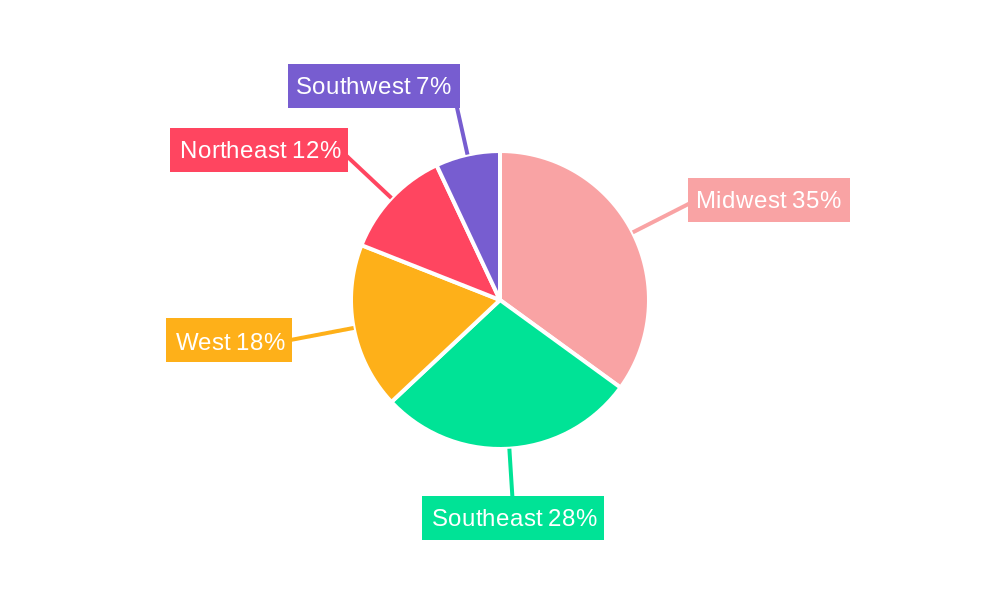
The U.S. crop protection chemicals market, valued at approximately $25 billion in 2025, is projected to experience robust growth, exhibiting a compound annual growth rate (CAGR) of 4.34% from 2025 to 2033. This expansion is driven by several key factors. Increasing demand for food security globally fuels the need for higher crop yields, leading to greater reliance on pesticides and herbicides. The prevalence of insect infestations, weed growth, and fungal diseases necessitates consistent application of crop protection chemicals across diverse crop types. Furthermore, technological advancements in chemical formulations, such as targeted delivery systems and biopesticides, are enhancing efficacy and reducing environmental impact, contributing to market growth. Specific segments like insecticides and fungicides are expected to witness above-average growth, fueled by rising concerns about pest and disease resistance. The increasing adoption of precision agriculture techniques, including chemigation and targeted foliar application, are optimizing chemical usage and enhancing productivity, further fueling market growth. Regional variations exist, with the Midwest and Southeast regions likely leading in market share due to their extensive agricultural production.
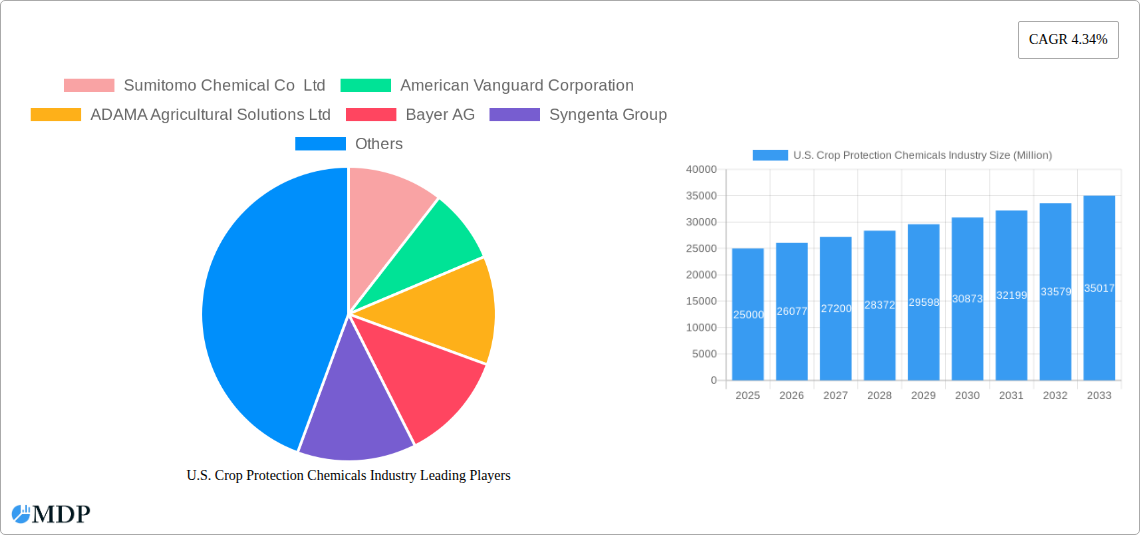
U.S. Crop Protection Chemicals Industry Market Size (In Billion)
However, the market also faces certain restraints. Growing regulatory scrutiny regarding the environmental and health impacts of certain chemicals, coupled with stringent approval processes for new product launches, pose challenges. Consumer demand for organically produced crops and the increasing adoption of integrated pest management (IPM) practices may slightly dampen growth in certain segments. Fluctuations in agricultural commodity prices and unfavorable weather conditions can also impact the market's trajectory. Nonetheless, the long-term outlook for the U.S. crop protection chemicals market remains positive, driven by the persistent need for enhanced crop protection and yield optimization in a growing global population. Innovation in sustainable and eco-friendly crop protection solutions will be crucial for sustained market growth.
U.S. Crop Protection Chemicals Industry Company Market Share
U.S. Crop Protection Chemicals Industry: Market Analysis & Forecast (2019-2033)
This comprehensive report provides a detailed analysis of the U.S. crop protection chemicals industry, offering invaluable insights for stakeholders seeking to navigate this dynamic market. With a study period spanning 2019-2033, a base year of 2025, and a forecast period of 2025-2033, this report delivers actionable intelligence on market size, growth drivers, and future trends. The report utilizes data from the historical period (2019-2024) to provide a robust foundation for future projections. Key players such as Sumitomo Chemical Co Ltd, American Vanguard Corporation, ADAMA Agricultural Solutions Ltd, Bayer AG, Syngenta Group, BASF SE, FMC Corporation, UPL Limited, Corteva Agriscience, and Nufarm Ltd are meticulously analyzed.
U.S. Crop Protection Chemicals Industry Market Dynamics & Concentration
The U.S. crop protection chemicals market is characterized by a moderately concentrated landscape, with a few major players holding significant market share. Market concentration is influenced by factors such as economies of scale in production and R&D, and strong brand recognition. While exact market share figures are proprietary, the top 10 companies likely account for over xx% of the total market value. Innovation is a key driver, with companies constantly investing in developing new, more effective, and sustainable crop protection solutions. Stringent regulatory frameworks, including those set by the Environmental Protection Agency (EPA), significantly influence product development and market entry. The industry faces pressure from the development of biopesticides and other sustainable alternatives, which represent a growing segment of the market. Mergers and acquisitions (M&A) have played a significant role in shaping market dynamics, with xx major M&A deals recorded between 2019 and 2024. End-user trends, including the growing demand for higher crop yields and increased focus on sustainable agriculture, further shape the market's trajectory.
- Market Concentration: Top 10 companies hold over xx% market share (estimated).
- M&A Activity: xx major deals between 2019 and 2024.
- Regulatory Framework: EPA regulations heavily influence product development and market entry.
- Innovation Drivers: Demand for higher crop yields and sustainable agriculture fuels R&D.
- Product Substitutes: Biopesticides and other eco-friendly alternatives pose competitive pressure.
U.S. Crop Protection Chemicals Industry Industry Trends & Analysis
The U.S. crop protection chemicals market exhibits a robust growth trajectory, driven primarily by increasing global food demand and the need to enhance crop yields. Technological advancements, such as the development of precision agriculture tools and targeted pesticide application techniques, are significantly impacting market dynamics, improving efficiency and reducing environmental impact. Consumer preferences towards sustainably produced food are also influencing the development of eco-friendly crop protection solutions. The market is characterized by intense competition among established players and emerging companies, leading to continuous innovation and product diversification. The Compound Annual Growth Rate (CAGR) for the period 2025-2033 is estimated at xx%, reflecting strong growth prospects. Market penetration of biopesticides is projected to increase from xx% in 2025 to xx% by 2033, highlighting the growing adoption of sustainable practices within the industry. This growth is further influenced by the increasing prevalence of resistant pests and weeds, necessitating the development of more potent and effective crop protection solutions.
Leading Markets & Segments in U.S. Crop Protection Chemicals Industry
Within the U.S. crop protection chemicals market, several segments demonstrate notable dominance. The Herbicide segment consistently holds the largest market share, driven by the pervasive need to control weeds in diverse agricultural settings. The Foliar application mode also accounts for a significant portion of the market due to its widespread adaptability and effectiveness in various crop types. Grains & Cereals represent the largest crop type segment, reflecting the significant acreage devoted to these crops in the U.S.
- Key Drivers for Herbicide Dominance: High prevalence of weeds across various crops, significant acreage of grains and cereals.
- Key Drivers for Foliar Application Dominance: Wide applicability, ease of use, and effectiveness across different crops.
- Key Drivers for Grains & Cereals Dominance: Vast acreage dedicated to these crops, high demand for global food security.
- Regional Dominance: The Midwest region likely holds the largest market share due to its high concentration of agricultural land.
U.S. Crop Protection Chemicals Industry Product Developments
Recent product developments showcase a clear trend towards increased efficacy, targeted application, and enhanced environmental sustainability. Innovations focus on reducing off-target effects, improving resistance management, and developing products with lower environmental impact. New formulations, such as more efficient liquid fungicides and herbicides designed to combat weed resistance, are being introduced, reflecting a response to evolving market needs. These developments underscore the industry's commitment to meeting the ever-changing demands of farmers and consumers.
Key Drivers of U.S. Crop Protection Chemicals Industry Growth
The growth of the U.S. crop protection chemicals market is propelled by several key factors. Increasing global food demand necessitates higher crop yields, driving the need for advanced crop protection solutions. Technological advancements in precision agriculture enable targeted pesticide application, maximizing efficacy while minimizing environmental impact. Favorable economic conditions and government support for agricultural development contribute to the market's expansion. Finally, the emergence of novel pests and diseases intensifies the demand for effective crop protection measures.
Challenges in the U.S. Crop Protection Chemicals Industry Market
Several challenges hinder the growth of the U.S. crop protection chemicals market. Stringent regulatory requirements, including those related to environmental protection and worker safety, increase the costs and complexity of product development and registration. Fluctuations in raw material prices and supply chain disruptions can impact production costs and product availability. Intense competition, including the emergence of biopesticides and other sustainable alternatives, puts pressure on pricing and profitability. These factors collectively contribute to market volatility and uncertainty.
Emerging Opportunities in U.S. Crop Protection Chemicals Industry
Significant opportunities exist for long-term growth in the U.S. crop protection chemicals market. Technological advancements, including the development of novel active ingredients and application technologies, offer avenues for enhanced efficacy and sustainability. Strategic partnerships between chemical companies and biotechnology firms are fostering the development of integrated pest management (IPM) solutions. Expansion into emerging markets and the development of customized solutions for specific crops and pests will further drive growth.
Leading Players in the U.S. Crop Protection Chemicals Industry Sector
Key Milestones in U.S. Crop Protection Chemicals Industry Industry
- April 2023: Nufarm launched Tourney EZ, a new liquid formulation fungicide for turf and ornamental crops, strengthening its position in this segment.
- March 2023: AMVAC launched new herbicides (Impact Core and Sinate) to address weed resistance in maize.
- January 2023: Bayer partnered with Oerth Bio to develop more eco-friendly crop protection solutions.
Strategic Outlook for U.S. Crop Protection Chemicals Industry Market
The U.S. crop protection chemicals market holds significant future potential, driven by continuous innovation, increasing food demand, and the growing adoption of sustainable agricultural practices. Strategic opportunities lie in developing innovative solutions that address the challenges of pest and weed resistance, climate change, and environmental concerns. Companies that invest in R&D, strategic partnerships, and sustainable product development will be well-positioned for long-term success in this dynamic and vital industry.
U.S. Crop Protection Chemicals Industry Segmentation
-
1. Function
- 1.1. Fungicide
- 1.2. Herbicide
- 1.3. Insecticide
- 1.4. Molluscicide
- 1.5. Nematicide
-
2. Application Mode
- 2.1. Chemigation
- 2.2. Foliar
- 2.3. Fumigation
- 2.4. Seed Treatment
- 2.5. Soil Treatment
-
3. Crop Type
- 3.1. Commercial Crops
- 3.2. Fruits & Vegetables
- 3.3. Grains & Cereals
- 3.4. Pulses & Oilseeds
- 3.5. Turf & Ornamental
-
4. Function
- 4.1. Fungicide
- 4.2. Herbicide
- 4.3. Insecticide
- 4.4. Molluscicide
- 4.5. Nematicide
-
5. Application Mode
- 5.1. Chemigation
- 5.2. Foliar
- 5.3. Fumigation
- 5.4. Seed Treatment
- 5.5. Soil Treatment
-
6. Crop Type
- 6.1. Commercial Crops
- 6.2. Fruits & Vegetables
- 6.3. Grains & Cereals
- 6.4. Pulses & Oilseeds
- 6.5. Turf & Ornamental
U.S. Crop Protection Chemicals Industry Segmentation By Geography
- 1. U.S.
U.S. Crop Protection Chemicals Industry Regional Market Share
Geographic Coverage of U.S. Crop Protection Chemicals Industry
U.S. Crop Protection Chemicals Industry REPORT HIGHLIGHTS
| Aspects | Details |
|---|---|
| Study Period | 2020-2034 |
| Base Year | 2025 |
| Estimated Year | 2026 |
| Forecast Period | 2026-2034 |
| Historical Period | 2020-2025 |
| Growth Rate | CAGR of 5% from 2020-2034 |
| Segmentation |
|
Table of Contents
- 1. Introduction
- 1.1. Research Scope
- 1.2. Market Segmentation
- 1.3. Research Methodology
- 1.4. Definitions and Assumptions
- 2. Executive Summary
- 2.1. Introduction
- 3. Market Dynamics
- 3.1. Introduction
- 3.2. Market Drivers
- 3.2.1. Seed Treatment As A Solution To Enhance Yield; Growing Awareness For Seed Treatment Among The Farmers; Rising Trend Of Organic Farming
- 3.3. Market Restrains
- 3.3.1. Limitations Across Farm-Level Seed Treatment; Rising Environmental Concerns
- 3.4. Market Trends
- 3.4.1 Rise in weed infestations
- 3.4.2 shortage of labor
- 3.4.3 increased wages
- 3.4.4 and need for higher food production may drive the herbicide market in the country
- 4. Market Factor Analysis
- 4.1. Porters Five Forces
- 4.2. Supply/Value Chain
- 4.3. PESTEL analysis
- 4.4. Market Entropy
- 4.5. Patent/Trademark Analysis
- 5. U.S. Crop Protection Chemicals Industry Analysis, Insights and Forecast, 2020-2032
- 5.1. Market Analysis, Insights and Forecast - by Function
- 5.1.1. Fungicide
- 5.1.2. Herbicide
- 5.1.3. Insecticide
- 5.1.4. Molluscicide
- 5.1.5. Nematicide
- 5.2. Market Analysis, Insights and Forecast - by Application Mode
- 5.2.1. Chemigation
- 5.2.2. Foliar
- 5.2.3. Fumigation
- 5.2.4. Seed Treatment
- 5.2.5. Soil Treatment
- 5.3. Market Analysis, Insights and Forecast - by Crop Type
- 5.3.1. Commercial Crops
- 5.3.2. Fruits & Vegetables
- 5.3.3. Grains & Cereals
- 5.3.4. Pulses & Oilseeds
- 5.3.5. Turf & Ornamental
- 5.4. Market Analysis, Insights and Forecast - by Function
- 5.4.1. Fungicide
- 5.4.2. Herbicide
- 5.4.3. Insecticide
- 5.4.4. Molluscicide
- 5.4.5. Nematicide
- 5.5. Market Analysis, Insights and Forecast - by Application Mode
- 5.5.1. Chemigation
- 5.5.2. Foliar
- 5.5.3. Fumigation
- 5.5.4. Seed Treatment
- 5.5.5. Soil Treatment
- 5.6. Market Analysis, Insights and Forecast - by Crop Type
- 5.6.1. Commercial Crops
- 5.6.2. Fruits & Vegetables
- 5.6.3. Grains & Cereals
- 5.6.4. Pulses & Oilseeds
- 5.6.5. Turf & Ornamental
- 5.7. Market Analysis, Insights and Forecast - by Region
- 5.7.1. U.S.
- 5.1. Market Analysis, Insights and Forecast - by Function
- 6. Competitive Analysis
- 6.1. Market Share Analysis 2025
- 6.2. Company Profiles
- 6.2.1 Sumitomo Chemical Co Ltd
- 6.2.1.1. Overview
- 6.2.1.2. Products
- 6.2.1.3. SWOT Analysis
- 6.2.1.4. Recent Developments
- 6.2.1.5. Financials (Based on Availability)
- 6.2.2 American Vanguard Corporation
- 6.2.2.1. Overview
- 6.2.2.2. Products
- 6.2.2.3. SWOT Analysis
- 6.2.2.4. Recent Developments
- 6.2.2.5. Financials (Based on Availability)
- 6.2.3 ADAMA Agricultural Solutions Ltd
- 6.2.3.1. Overview
- 6.2.3.2. Products
- 6.2.3.3. SWOT Analysis
- 6.2.3.4. Recent Developments
- 6.2.3.5. Financials (Based on Availability)
- 6.2.4 Bayer AG
- 6.2.4.1. Overview
- 6.2.4.2. Products
- 6.2.4.3. SWOT Analysis
- 6.2.4.4. Recent Developments
- 6.2.4.5. Financials (Based on Availability)
- 6.2.5 Syngenta Group
- 6.2.5.1. Overview
- 6.2.5.2. Products
- 6.2.5.3. SWOT Analysis
- 6.2.5.4. Recent Developments
- 6.2.5.5. Financials (Based on Availability)
- 6.2.6 BASF SE
- 6.2.6.1. Overview
- 6.2.6.2. Products
- 6.2.6.3. SWOT Analysis
- 6.2.6.4. Recent Developments
- 6.2.6.5. Financials (Based on Availability)
- 6.2.7 FMC Corporation
- 6.2.7.1. Overview
- 6.2.7.2. Products
- 6.2.7.3. SWOT Analysis
- 6.2.7.4. Recent Developments
- 6.2.7.5. Financials (Based on Availability)
- 6.2.8 UPL Limite
- 6.2.8.1. Overview
- 6.2.8.2. Products
- 6.2.8.3. SWOT Analysis
- 6.2.8.4. Recent Developments
- 6.2.8.5. Financials (Based on Availability)
- 6.2.9 Corteva Agriscience
- 6.2.9.1. Overview
- 6.2.9.2. Products
- 6.2.9.3. SWOT Analysis
- 6.2.9.4. Recent Developments
- 6.2.9.5. Financials (Based on Availability)
- 6.2.10 Nufarm Ltd
- 6.2.10.1. Overview
- 6.2.10.2. Products
- 6.2.10.3. SWOT Analysis
- 6.2.10.4. Recent Developments
- 6.2.10.5. Financials (Based on Availability)
- 6.2.1 Sumitomo Chemical Co Ltd
List of Figures
- Figure 1: U.S. Crop Protection Chemicals Industry Revenue Breakdown (undefined, %) by Product 2025 & 2033
- Figure 2: U.S. Crop Protection Chemicals Industry Share (%) by Company 2025
List of Tables
- Table 1: U.S. Crop Protection Chemicals Industry Revenue undefined Forecast, by Function 2020 & 2033
- Table 2: U.S. Crop Protection Chemicals Industry Volume Kiloton Forecast, by Function 2020 & 2033
- Table 3: U.S. Crop Protection Chemicals Industry Revenue undefined Forecast, by Application Mode 2020 & 2033
- Table 4: U.S. Crop Protection Chemicals Industry Volume Kiloton Forecast, by Application Mode 2020 & 2033
- Table 5: U.S. Crop Protection Chemicals Industry Revenue undefined Forecast, by Crop Type 2020 & 2033
- Table 6: U.S. Crop Protection Chemicals Industry Volume Kiloton Forecast, by Crop Type 2020 & 2033
- Table 7: U.S. Crop Protection Chemicals Industry Revenue undefined Forecast, by Function 2020 & 2033
- Table 8: U.S. Crop Protection Chemicals Industry Volume Kiloton Forecast, by Function 2020 & 2033
- Table 9: U.S. Crop Protection Chemicals Industry Revenue undefined Forecast, by Application Mode 2020 & 2033
- Table 10: U.S. Crop Protection Chemicals Industry Volume Kiloton Forecast, by Application Mode 2020 & 2033
- Table 11: U.S. Crop Protection Chemicals Industry Revenue undefined Forecast, by Crop Type 2020 & 2033
- Table 12: U.S. Crop Protection Chemicals Industry Volume Kiloton Forecast, by Crop Type 2020 & 2033
- Table 13: U.S. Crop Protection Chemicals Industry Revenue undefined Forecast, by Region 2020 & 2033
- Table 14: U.S. Crop Protection Chemicals Industry Volume Kiloton Forecast, by Region 2020 & 2033
- Table 15: U.S. Crop Protection Chemicals Industry Revenue undefined Forecast, by Function 2020 & 2033
- Table 16: U.S. Crop Protection Chemicals Industry Volume Kiloton Forecast, by Function 2020 & 2033
- Table 17: U.S. Crop Protection Chemicals Industry Revenue undefined Forecast, by Application Mode 2020 & 2033
- Table 18: U.S. Crop Protection Chemicals Industry Volume Kiloton Forecast, by Application Mode 2020 & 2033
- Table 19: U.S. Crop Protection Chemicals Industry Revenue undefined Forecast, by Crop Type 2020 & 2033
- Table 20: U.S. Crop Protection Chemicals Industry Volume Kiloton Forecast, by Crop Type 2020 & 2033
- Table 21: U.S. Crop Protection Chemicals Industry Revenue undefined Forecast, by Function 2020 & 2033
- Table 22: U.S. Crop Protection Chemicals Industry Volume Kiloton Forecast, by Function 2020 & 2033
- Table 23: U.S. Crop Protection Chemicals Industry Revenue undefined Forecast, by Application Mode 2020 & 2033
- Table 24: U.S. Crop Protection Chemicals Industry Volume Kiloton Forecast, by Application Mode 2020 & 2033
- Table 25: U.S. Crop Protection Chemicals Industry Revenue undefined Forecast, by Crop Type 2020 & 2033
- Table 26: U.S. Crop Protection Chemicals Industry Volume Kiloton Forecast, by Crop Type 2020 & 2033
- Table 27: U.S. Crop Protection Chemicals Industry Revenue undefined Forecast, by Country 2020 & 2033
- Table 28: U.S. Crop Protection Chemicals Industry Volume Kiloton Forecast, by Country 2020 & 2033
Frequently Asked Questions
1. What is the projected Compound Annual Growth Rate (CAGR) of the U.S. Crop Protection Chemicals Industry?
The projected CAGR is approximately 5%.
2. Which companies are prominent players in the U.S. Crop Protection Chemicals Industry?
Key companies in the market include Sumitomo Chemical Co Ltd, American Vanguard Corporation, ADAMA Agricultural Solutions Ltd, Bayer AG, Syngenta Group, BASF SE, FMC Corporation, UPL Limite, Corteva Agriscience, Nufarm Ltd.
3. What are the main segments of the U.S. Crop Protection Chemicals Industry?
The market segments include Function, Application Mode, Crop Type, Function, Application Mode, Crop Type.
4. Can you provide details about the market size?
The market size is estimated to be USD XXX N/A as of 2022.
5. What are some drivers contributing to market growth?
Seed Treatment As A Solution To Enhance Yield; Growing Awareness For Seed Treatment Among The Farmers; Rising Trend Of Organic Farming.
6. What are the notable trends driving market growth?
Rise in weed infestations. shortage of labor. increased wages. and need for higher food production may drive the herbicide market in the country.
7. Are there any restraints impacting market growth?
Limitations Across Farm-Level Seed Treatment; Rising Environmental Concerns.
8. Can you provide examples of recent developments in the market?
April 2023: Nufarm launched a new liquid formulation fungicide, Tourney EZ, exclusively for turf and ornamental crops based on customer demand, which further strengthens the company's role in turf and ornamental crop protection.March 2023: AMVAC launched a portfolio of herbicides, including Impact Core and Sinate, to combat weed resistance in maize.January 2023: Bayer formed a new partnership with Oerth Bio to enhance crop protection technology and create more eco-friendly crop protection solutions.
9. What pricing options are available for accessing the report?
Pricing options include single-user, multi-user, and enterprise licenses priced at USD 3800, USD 4500, and USD 5800 respectively.
10. Is the market size provided in terms of value or volume?
The market size is provided in terms of value, measured in N/A and volume, measured in Kiloton.
11. Are there any specific market keywords associated with the report?
Yes, the market keyword associated with the report is "U.S. Crop Protection Chemicals Industry," which aids in identifying and referencing the specific market segment covered.
12. How do I determine which pricing option suits my needs best?
The pricing options vary based on user requirements and access needs. Individual users may opt for single-user licenses, while businesses requiring broader access may choose multi-user or enterprise licenses for cost-effective access to the report.
13. Are there any additional resources or data provided in the U.S. Crop Protection Chemicals Industry report?
While the report offers comprehensive insights, it's advisable to review the specific contents or supplementary materials provided to ascertain if additional resources or data are available.
14. How can I stay updated on further developments or reports in the U.S. Crop Protection Chemicals Industry?
To stay informed about further developments, trends, and reports in the U.S. Crop Protection Chemicals Industry, consider subscribing to industry newsletters, following relevant companies and organizations, or regularly checking reputable industry news sources and publications.
Methodology
Step 1 - Identification of Relevant Samples Size from Population Database


Step 2 - Approaches for Defining Global Market Size (Value, Volume* & Price*)

Note*: In applicable scenarios
Step 3 - Data Sources
Primary Research
- Web Analytics
- Survey Reports
- Research Institute
- Latest Research Reports
- Opinion Leaders
Secondary Research
- Annual Reports
- White Paper
- Latest Press Release
- Industry Association
- Paid Database
- Investor Presentations

Step 4 - Data Triangulation
Involves using different sources of information in order to increase the validity of a study
These sources are likely to be stakeholders in a program - participants, other researchers, program staff, other community members, and so on.
Then we put all data in single framework & apply various statistical tools to find out the dynamic on the market.
During the analysis stage, feedback from the stakeholder groups would be compared to determine areas of agreement as well as areas of divergence