

Key Insights
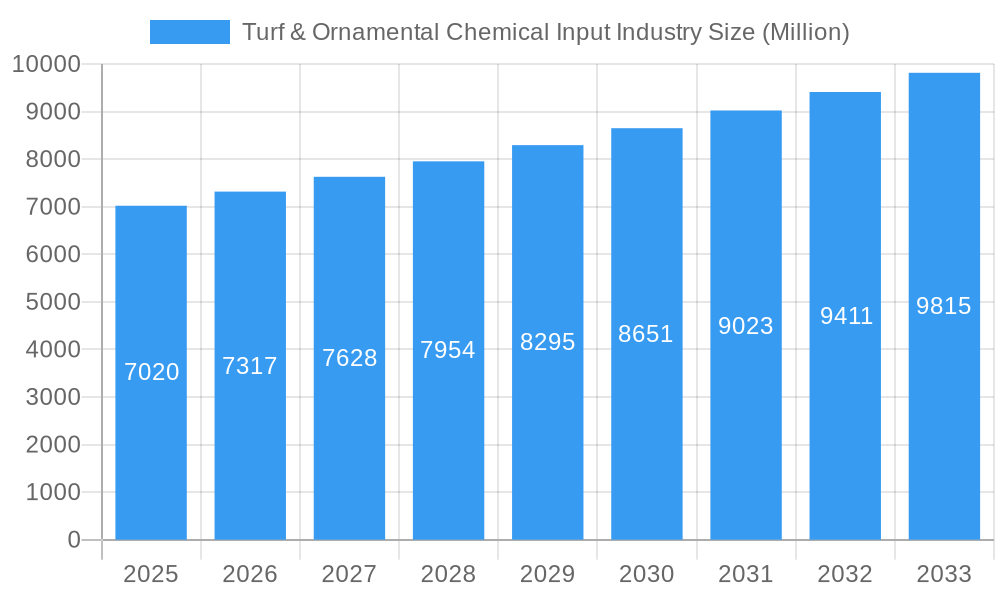
The Turf & Ornamental Chemical Input market, valued at $7.02 billion in 2025, is projected to experience robust growth, driven by increasing urbanization, rising disposable incomes leading to higher landscaping demands, and a growing preference for aesthetically pleasing green spaces in both residential and commercial settings. The market's Compound Annual Growth Rate (CAGR) of 4.34% from 2025 to 2033 indicates a steady expansion. Key drivers include the rising adoption of advanced chemical inputs for enhanced turf and ornamental plant health, pest and disease control, and improved yield. Emerging trends include the increasing demand for environmentally friendly and sustainable chemical inputs, promoting biopesticides and biofertilizers, and a focus on precision application technologies to minimize environmental impact and optimize resource utilization. Market restraints include stringent government regulations on chemical usage, concerns over potential health and environmental risks associated with certain chemical inputs, and fluctuating raw material prices impacting production costs. The market is segmented by type of ornamental grass (Feather Reed Grass, Fountain Grass, Purple Millet, Ravenna Grass, Fibre Optic Grass, Others), type of turf grass (Bermuda Grass, Zoysia Grass, Blue Kentucky Grass, Rye Grass, Tall Fescue, Others), and synthetic chemical inputs (pesticides, fertilizers, plant growth regulators, others). Major players like FMC Corporation, Bayer Crop Sciences, and Syngenta are actively engaged in research and development to cater to the evolving market needs and preferences. Regional analysis indicates significant market potential across North America, Europe, and the Asia-Pacific region, with developing economies showing particularly promising growth opportunities due to rising infrastructure development and landscaping projects.
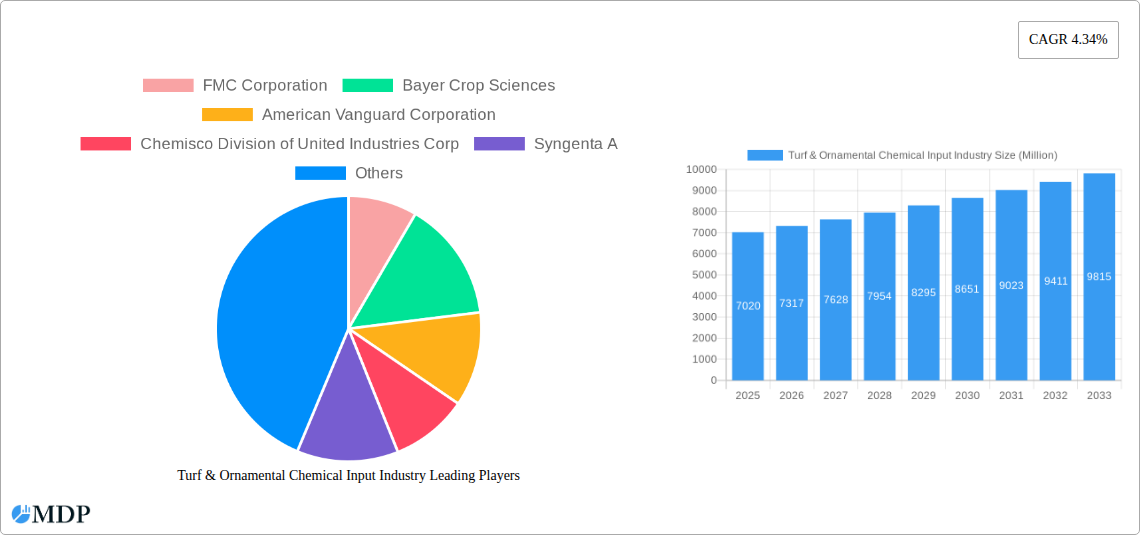
Turf & Ornamental Chemical Input Industry Market Size (In Billion)
The competitive landscape is characterized by both large multinational corporations and smaller specialized companies. Larger companies leverage their extensive research capabilities and global distribution networks to maintain market dominance, while smaller companies often focus on niche markets and the development of innovative, sustainable products. Future growth will depend on the adoption of sustainable practices, the development of novel chemical inputs with reduced environmental impact, and the continued investment in research and development to address emerging challenges and market demands. The increasing awareness of environmental concerns and the growing adoption of integrated pest management (IPM) strategies will also significantly shape the market trajectory in the coming years. The market's continued growth is predicated upon a sustained demand for aesthetically pleasing landscapes coupled with advancements in chemical inputs that meet both performance and sustainability criteria.
Turf & Ornamental Chemical Input Industry Company Market Share
Turf & Ornamental Chemical Input Industry: A Comprehensive Market Report (2019-2033)
This comprehensive report provides an in-depth analysis of the Turf & Ornamental Chemical Input Industry, covering market dynamics, leading players, emerging trends, and future growth prospects. With a study period spanning 2019-2033, a base year of 2025, and a forecast period of 2025-2033, this report is an invaluable resource for industry stakeholders, investors, and researchers seeking actionable insights. The report analyzes a market valued at xx Million in 2025, projected to reach xx Million by 2033, exhibiting a CAGR of xx% during the forecast period.
Turf & Ornamental Chemical Input Industry Market Dynamics & Concentration
The Turf & Ornamental Chemical Input Industry exhibits a moderate level of market concentration, where a few prominent global players hold substantial market share. Key industry leaders such as FMC Corporation, Bayer Crop Sciences, and Syngenta AG are collectively estimated to command a significant portion of the market, projected to reach approximately [Insert XX]% in 2025. Despite the dominance of these major corporations, the landscape is invigorated by the presence of a diverse array of smaller, specialized companies, including Precision Laboratories, Gowan International, and Adama Agricultural Solutions. This blend of large-scale enterprises and agile niche players contributes to a dynamic and competitive market environment.
The intricate market dynamics are shaped by a confluence of influential factors:
- Innovation & Product Development: A relentless pursuit of research and development (R&D) is paramount. Companies are heavily investing in the creation of environmentally conscious and highly efficacious products. A prime example is BASF's Pillar SC Intrinsic fungicide, launched in March 2022, which addresses the growing consumer and professional demand for sustainable and effective turf management solutions. This focus on cutting-edge formulations ensures product relevance and market competitiveness.
- Evolving Regulatory Frameworks: Stringent environmental regulations, both domestic and international, play a pivotal role in dictating product development pathways and market access. These regulations necessitate a continuous adaptation of manufacturing processes and product portfolios, often driving innovation towards more sustainable and compliant alternatives, thereby impacting industry profitability and strategic planning.
- The Rise of Product Substitutes: The increasing availability and adoption of bio-based and organic inputs present a significant challenge and opportunity for traditional synthetic chemical manufacturers. This trend compels industry participants to diversify their offerings and integrate sustainable options. Syngenta's strategic acquisition of bioinsecticide technologies in January 2022 exemplifies this industry-wide pivot towards embracing biological solutions to complement or replace conventional chemical treatments.
- Shifting End-User Preferences: A heightened global awareness regarding environmental sustainability, biodiversity, and human health is profoundly influencing purchasing decisions. End-users, including professional landscapers, golf course superintendents, and even residential consumers, are actively seeking safer, more environmentally friendly, and residue-conscious products. This shift necessitates a responsive product strategy from chemical input providers.
- Mergers & Acquisitions (M&A) Activity: The industry has experienced a consistent, albeit moderate, level of consolidation through mergers and acquisitions in recent years. Between 2019 and 2024, approximately [Insert XX] major M&A deals have been recorded. These strategic moves are primarily aimed at consolidating market share, broadening product portfolios to cater to diverse needs, gaining access to novel technologies, and achieving economies of scale.
Turf & Ornamental Chemical Input Industry Industry Trends & Analysis
The Turf & Ornamental Chemical Input Industry is experiencing a phase of robust growth, propelled by several interconnected and significant trends:
- Expansive Urbanization and Landscaping Needs: As global urbanization continues at an accelerated pace, there is a corresponding surge in the demand for well-maintained green spaces, including parks, residential gardens, golf courses, and commercial landscapes. This expansion directly fuels the need for comprehensive turf and ornamental care solutions, thereby driving demand for specialized chemical inputs.
- Heightened Awareness of Turf and Ornamental Health: There is a growing understanding among professionals and the public alike about the critical importance of maintaining healthy and resilient turfgrass and ornamental plants. This awareness translates into a proactive approach towards pest and disease management, weed control, and nutrient supplementation, leading to increased adoption of effective chemical inputs.
- Technological Advancements in Application and Formulation: The industry is witnessing significant progress in areas such as advanced formulation technologies that enhance product stability and efficacy, alongside the development of targeted delivery systems and precision application technologies. These innovations not only improve the effectiveness of chemical inputs but also contribute to minimizing environmental impact and optimizing resource utilization.
- Consumer Preference Shift Towards Sustainable Solutions: A pronounced global shift towards environmental stewardship and sustainable practices is profoundly influencing the demand for bio-based and organic inputs within the turf and ornamental sector. This trend is compelling manufacturers to prioritize the development and commercialization of eco-friendly products, often incorporating biopesticides, biostimulants, and naturally derived ingredients to meet evolving market expectations.
- Intensifying Competitive Dynamics: The market is characterized by vigorous competition among established major players, as well as emerging innovators. This competitive environment is a powerful catalyst for ongoing innovation, driving improvements in product quality, the development of differentiated solutions, and, in many cases, more competitive pricing structures that ultimately benefit the end-users.
Leading Markets & Segments in Turf & Ornamental Chemical Input Industry
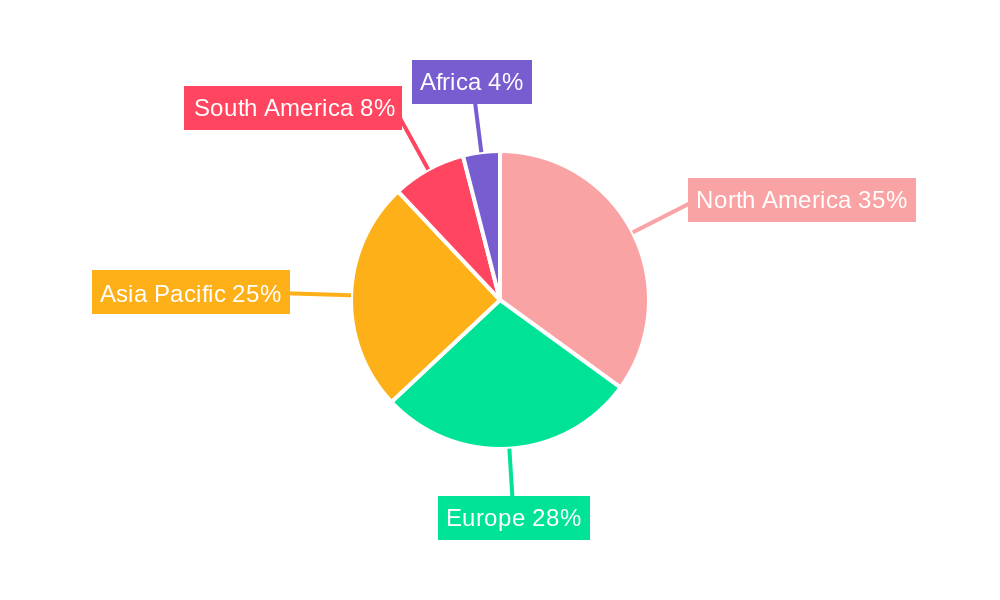
The North American region dominates the Turf & Ornamental Chemical Input market, driven by high per capita income, extensive landscaping practices, and a strong preference for aesthetically pleasing lawns and gardens. Within this region, the United States holds a leading position.
Key segments driving market growth include:
- Type of Turf Grass: Bermuda grass, Zoysia grass, and Tall Fescue are among the leading segments due to their widespread use in various applications.
- Synthetic Chemical Inputs: Pesticides continue to dominate, owing to their effectiveness in controlling pests and diseases. However, the demand for fertilizers and plant growth regulators is also increasing.
- Type of Ornamental Grass: Feather Reed Grass, Fountain Grass, and Purple Millet are experiencing increasing demand due to their aesthetic appeal and adaptability to diverse climates.
Key drivers for the dominant regions include:
- Favorable Economic Policies: Government support for landscaping and horticulture projects stimulates market growth.
- Developed Infrastructure: Efficient infrastructure facilitates the distribution and access to chemical inputs across the region.
Turf & Ornamental Chemical Input Industry Product Developments
Recent product innovations focus on enhanced efficacy, reduced environmental impact, and improved user-friendliness. Examples include the introduction of BASF's Pillar SC Intrinsic fungicide, offering broad-spectrum disease control with a single application. The market is also seeing increased development of bio-based and organic alternatives, driven by consumer demand for eco-friendly solutions. These developments reflect an industry trend toward more sustainable and precise application technologies.
Key Drivers of Turf & Ornamental Chemical Input Industry Growth
The sustained growth trajectory of the Turf & Ornamental Chemical Input Industry is underpinned by a multifaceted set of drivers:
- Technological Advancements: Continuous innovation is leading to the development of more effective, targeted, and environmentally benign chemical products. This includes advancements in formulations, active ingredients, and application methods that enhance performance while reducing potential ecological impacts.
- Increasing Disposable Incomes: In many developing economies, rising disposable incomes are leading to greater investment in leisure activities and lifestyle improvements, including enhanced landscaping and garden maintenance. This growing demand for aesthetic and functional green spaces directly fuels the need for chemical inputs.
- Supportive Government Policies and Initiatives: Favorable government policies and initiatives aimed at promoting the growth of the horticulture, landscaping, and urban greening sectors can significantly boost the demand for related chemical inputs. These policies may include subsidies, tax incentives, or regulations that encourage the adoption of professional turf and ornamental management practices.
Challenges in the Turf & Ornamental Chemical Input Industry Market
The industry faces several challenges:
- Stringent environmental regulations increasing the cost of product development and market access.
- Supply chain disruptions impacting the availability and cost of raw materials.
- Intense competition among industry players impacting profitability. These factors combined can lead to a reduction in overall market growth by an estimated xx% by 2030 if not adequately addressed.
Emerging Opportunities in Turf & Ornamental Chemical Input Industry
Significant growth opportunities exist:
- Expansion into developing markets with rising disposable incomes and growing demand for landscaping services.
- Development of innovative products catering to the growing demand for sustainable and eco-friendly solutions.
- Strategic partnerships and collaborations to enhance product development, distribution, and market access.
Leading Players in the Turf & Ornamental Chemical Input Industry Sector
- FMC Corporation
- Bayer Crop Sciences
- American Vanguard Corporation
- Chemisco Division of United Industries Corp
- Syngenta A
- Precision Laboratories
- DowDuPont
- Monsanto Company
- Gowan International
- Chemtura Agro Solutions
- Adama Agricultural Solutions
- Koch Agronomic Services LLC
- Nufarm Ltd
- BASF SE
Key Milestones in Turf & Ornamental Chemical Input Industry Industry
- March 2022: BASF launched Pillar SC Intrinsic brand fungicide. This introduction marked a significant advancement in managing turfgrass diseases, offering enhanced efficacy and contributing to healthier, more resilient playing surfaces and landscapes.
- January 2022: Syngenta strategically acquired the bioinsecticide assets of Nematrident and Unispore. This acquisition was a key move to bolster Syngenta's biological product portfolio, providing innovative solutions for pest resistance management and catering to the increasing demand for sustainable pest control methods.
Strategic Outlook for Turf & Ornamental Chemical Input Industry Market
The Turf & Ornamental Chemical Input Industry is strategically positioned for continued and robust growth in the foreseeable future. This expansion will be largely driven by the persistent forces of increasing urbanization, rising disposable incomes that fuel demand for enhanced landscaping services, and a profound and growing emphasis on sustainable environmental practices. The industry presents significant strategic opportunities for companies that can effectively leverage innovation. Key avenues for growth include the development of novel, eco-friendly products that align with sustainability goals, strategic market penetration into rapidly developing emerging economies, and the cultivation of strong strategic partnerships that foster collaboration and market access. Ultimately, companies that demonstrate agility in adapting to evolving consumer preferences, navigate the complex regulatory landscapes, and embrace sustainable solutions will be exceptionally well-positioned to capture substantial market share and achieve long-term success in the dynamic Turf & Ornamental Chemical Input Industry.
Turf & Ornamental Chemical Input Industry Segmentation
-
1. Type of Turf Grass
- 1.1. Bermuda Grass
- 1.2. Zoysia Grass
- 1.3. Blue Kentucky Grass
- 1.4. Rye Grass
- 1.5. Tall Fescue
- 1.6. Others
-
2. Type of Ornamental Grass
- 2.1. Feather Reed Grass
- 2.2. Fountain Grass
- 2.3. Purple Millet
- 2.4. Ravenna Grass
- 2.5. Fibre Optic Grass
- 2.6. Others
-
3. Synthetic Chemical Inputs
- 3.1. Pesticides
- 3.2. Fertilizers
- 3.3. Plant Growth Regulators
- 3.4. Others
-
4. Type of Turf Grass
- 4.1. Bermuda Grass
- 4.2. Zoysia Grass
- 4.3. Blue Kentucky Grass
- 4.4. Rye Grass
- 4.5. Tall Fescue
- 4.6. Others
-
5. Type of Ornamental Grass
- 5.1. Feather Reed Grass
- 5.2. Fountain Grass
- 5.3. Purple Millet
- 5.4. Ravenna Grass
- 5.5. Fibre Optic Grass
- 5.6. Others
-
6. Synthetic Chemical Inputs
- 6.1. Pesticides
- 6.2. Fertilizers
- 6.3. Plant Growth Regulators
- 6.4. Others
Turf & Ornamental Chemical Input Industry Segmentation By Geography
-
1. North America
- 1.1. United States
- 1.2. Canada
- 1.3. Mexico
- 1.4. Rest of North America
-
2. Europe
- 2.1. Spain
- 2.2. United Kingdom
- 2.3. France
- 2.4. Germany
- 2.5. Denmark
- 2.6. Italy
- 2.7. Rest of Europe
-
3. Asia Pacific
- 3.1. China
- 3.2. India
- 3.3. Japan
- 3.4. Thailand
- 3.5. Australia
- 3.6. Rest of Asia Pacific
-
4. South America
- 4.1. Brazil
- 4.2. Argentina
- 4.3. Rest of South America
-
5. Africa
- 5.1. South Africa
- 5.2. Rest of Africa
Turf & Ornamental Chemical Input Industry Regional Market Share
Geographic Coverage of Turf & Ornamental Chemical Input Industry
Turf & Ornamental Chemical Input Industry REPORT HIGHLIGHTS
| Aspects | Details |
|---|---|
| Study Period | 2020-2034 |
| Base Year | 2025 |
| Estimated Year | 2026 |
| Forecast Period | 2026-2034 |
| Historical Period | 2020-2025 |
| Growth Rate | CAGR of 4.34% from 2020-2034 |
| Segmentation |
|
Table of Contents
- 1. Introduction
- 1.1. Research Scope
- 1.2. Market Segmentation
- 1.3. Research Methodology
- 1.4. Definitions and Assumptions
- 2. Executive Summary
- 2.1. Introduction
- 3. Market Dynamics
- 3.1. Introduction
- 3.2. Market Drivers
- 3.2.1. Seed Treatment As A Solution To Enhance Yield; Growing Awareness For Seed Treatment Among The Farmers; Rising Trend Of Organic Farming
- 3.3. Market Restrains
- 3.3.1. Limitations Across Farm-Level Seed Treatment; Rising Environmental Concerns
- 3.4. Market Trends
- 3.4.1. Increasing Development of the Golf Courses and Sports Field
- 4. Market Factor Analysis
- 4.1. Porters Five Forces
- 4.2. Supply/Value Chain
- 4.3. PESTEL analysis
- 4.4. Market Entropy
- 4.5. Patent/Trademark Analysis
- 5. Global Turf & Ornamental Chemical Input Industry Analysis, Insights and Forecast, 2020-2032
- 5.1. Market Analysis, Insights and Forecast - by Type of Turf Grass
- 5.1.1. Bermuda Grass
- 5.1.2. Zoysia Grass
- 5.1.3. Blue Kentucky Grass
- 5.1.4. Rye Grass
- 5.1.5. Tall Fescue
- 5.1.6. Others
- 5.2. Market Analysis, Insights and Forecast - by Type of Ornamental Grass
- 5.2.1. Feather Reed Grass
- 5.2.2. Fountain Grass
- 5.2.3. Purple Millet
- 5.2.4. Ravenna Grass
- 5.2.5. Fibre Optic Grass
- 5.2.6. Others
- 5.3. Market Analysis, Insights and Forecast - by Synthetic Chemical Inputs
- 5.3.1. Pesticides
- 5.3.2. Fertilizers
- 5.3.3. Plant Growth Regulators
- 5.3.4. Others
- 5.4. Market Analysis, Insights and Forecast - by Type of Turf Grass
- 5.4.1. Bermuda Grass
- 5.4.2. Zoysia Grass
- 5.4.3. Blue Kentucky Grass
- 5.4.4. Rye Grass
- 5.4.5. Tall Fescue
- 5.4.6. Others
- 5.5. Market Analysis, Insights and Forecast - by Type of Ornamental Grass
- 5.5.1. Feather Reed Grass
- 5.5.2. Fountain Grass
- 5.5.3. Purple Millet
- 5.5.4. Ravenna Grass
- 5.5.5. Fibre Optic Grass
- 5.5.6. Others
- 5.6. Market Analysis, Insights and Forecast - by Synthetic Chemical Inputs
- 5.6.1. Pesticides
- 5.6.2. Fertilizers
- 5.6.3. Plant Growth Regulators
- 5.6.4. Others
- 5.7. Market Analysis, Insights and Forecast - by Region
- 5.7.1. North America
- 5.7.2. Europe
- 5.7.3. Asia Pacific
- 5.7.4. South America
- 5.7.5. Africa
- 5.1. Market Analysis, Insights and Forecast - by Type of Turf Grass
- 6. North America Turf & Ornamental Chemical Input Industry Analysis, Insights and Forecast, 2020-2032
- 6.1. Market Analysis, Insights and Forecast - by Type of Turf Grass
- 6.1.1. Bermuda Grass
- 6.1.2. Zoysia Grass
- 6.1.3. Blue Kentucky Grass
- 6.1.4. Rye Grass
- 6.1.5. Tall Fescue
- 6.1.6. Others
- 6.2. Market Analysis, Insights and Forecast - by Type of Ornamental Grass
- 6.2.1. Feather Reed Grass
- 6.2.2. Fountain Grass
- 6.2.3. Purple Millet
- 6.2.4. Ravenna Grass
- 6.2.5. Fibre Optic Grass
- 6.2.6. Others
- 6.3. Market Analysis, Insights and Forecast - by Synthetic Chemical Inputs
- 6.3.1. Pesticides
- 6.3.2. Fertilizers
- 6.3.3. Plant Growth Regulators
- 6.3.4. Others
- 6.4. Market Analysis, Insights and Forecast - by Type of Turf Grass
- 6.4.1. Bermuda Grass
- 6.4.2. Zoysia Grass
- 6.4.3. Blue Kentucky Grass
- 6.4.4. Rye Grass
- 6.4.5. Tall Fescue
- 6.4.6. Others
- 6.5. Market Analysis, Insights and Forecast - by Type of Ornamental Grass
- 6.5.1. Feather Reed Grass
- 6.5.2. Fountain Grass
- 6.5.3. Purple Millet
- 6.5.4. Ravenna Grass
- 6.5.5. Fibre Optic Grass
- 6.5.6. Others
- 6.6. Market Analysis, Insights and Forecast - by Synthetic Chemical Inputs
- 6.6.1. Pesticides
- 6.6.2. Fertilizers
- 6.6.3. Plant Growth Regulators
- 6.6.4. Others
- 6.1. Market Analysis, Insights and Forecast - by Type of Turf Grass
- 7. Europe Turf & Ornamental Chemical Input Industry Analysis, Insights and Forecast, 2020-2032
- 7.1. Market Analysis, Insights and Forecast - by Type of Turf Grass
- 7.1.1. Bermuda Grass
- 7.1.2. Zoysia Grass
- 7.1.3. Blue Kentucky Grass
- 7.1.4. Rye Grass
- 7.1.5. Tall Fescue
- 7.1.6. Others
- 7.2. Market Analysis, Insights and Forecast - by Type of Ornamental Grass
- 7.2.1. Feather Reed Grass
- 7.2.2. Fountain Grass
- 7.2.3. Purple Millet
- 7.2.4. Ravenna Grass
- 7.2.5. Fibre Optic Grass
- 7.2.6. Others
- 7.3. Market Analysis, Insights and Forecast - by Synthetic Chemical Inputs
- 7.3.1. Pesticides
- 7.3.2. Fertilizers
- 7.3.3. Plant Growth Regulators
- 7.3.4. Others
- 7.4. Market Analysis, Insights and Forecast - by Type of Turf Grass
- 7.4.1. Bermuda Grass
- 7.4.2. Zoysia Grass
- 7.4.3. Blue Kentucky Grass
- 7.4.4. Rye Grass
- 7.4.5. Tall Fescue
- 7.4.6. Others
- 7.5. Market Analysis, Insights and Forecast - by Type of Ornamental Grass
- 7.5.1. Feather Reed Grass
- 7.5.2. Fountain Grass
- 7.5.3. Purple Millet
- 7.5.4. Ravenna Grass
- 7.5.5. Fibre Optic Grass
- 7.5.6. Others
- 7.6. Market Analysis, Insights and Forecast - by Synthetic Chemical Inputs
- 7.6.1. Pesticides
- 7.6.2. Fertilizers
- 7.6.3. Plant Growth Regulators
- 7.6.4. Others
- 7.1. Market Analysis, Insights and Forecast - by Type of Turf Grass
- 8. Asia Pacific Turf & Ornamental Chemical Input Industry Analysis, Insights and Forecast, 2020-2032
- 8.1. Market Analysis, Insights and Forecast - by Type of Turf Grass
- 8.1.1. Bermuda Grass
- 8.1.2. Zoysia Grass
- 8.1.3. Blue Kentucky Grass
- 8.1.4. Rye Grass
- 8.1.5. Tall Fescue
- 8.1.6. Others
- 8.2. Market Analysis, Insights and Forecast - by Type of Ornamental Grass
- 8.2.1. Feather Reed Grass
- 8.2.2. Fountain Grass
- 8.2.3. Purple Millet
- 8.2.4. Ravenna Grass
- 8.2.5. Fibre Optic Grass
- 8.2.6. Others
- 8.3. Market Analysis, Insights and Forecast - by Synthetic Chemical Inputs
- 8.3.1. Pesticides
- 8.3.2. Fertilizers
- 8.3.3. Plant Growth Regulators
- 8.3.4. Others
- 8.4. Market Analysis, Insights and Forecast - by Type of Turf Grass
- 8.4.1. Bermuda Grass
- 8.4.2. Zoysia Grass
- 8.4.3. Blue Kentucky Grass
- 8.4.4. Rye Grass
- 8.4.5. Tall Fescue
- 8.4.6. Others
- 8.5. Market Analysis, Insights and Forecast - by Type of Ornamental Grass
- 8.5.1. Feather Reed Grass
- 8.5.2. Fountain Grass
- 8.5.3. Purple Millet
- 8.5.4. Ravenna Grass
- 8.5.5. Fibre Optic Grass
- 8.5.6. Others
- 8.6. Market Analysis, Insights and Forecast - by Synthetic Chemical Inputs
- 8.6.1. Pesticides
- 8.6.2. Fertilizers
- 8.6.3. Plant Growth Regulators
- 8.6.4. Others
- 8.1. Market Analysis, Insights and Forecast - by Type of Turf Grass
- 9. South America Turf & Ornamental Chemical Input Industry Analysis, Insights and Forecast, 2020-2032
- 9.1. Market Analysis, Insights and Forecast - by Type of Turf Grass
- 9.1.1. Bermuda Grass
- 9.1.2. Zoysia Grass
- 9.1.3. Blue Kentucky Grass
- 9.1.4. Rye Grass
- 9.1.5. Tall Fescue
- 9.1.6. Others
- 9.2. Market Analysis, Insights and Forecast - by Type of Ornamental Grass
- 9.2.1. Feather Reed Grass
- 9.2.2. Fountain Grass
- 9.2.3. Purple Millet
- 9.2.4. Ravenna Grass
- 9.2.5. Fibre Optic Grass
- 9.2.6. Others
- 9.3. Market Analysis, Insights and Forecast - by Synthetic Chemical Inputs
- 9.3.1. Pesticides
- 9.3.2. Fertilizers
- 9.3.3. Plant Growth Regulators
- 9.3.4. Others
- 9.4. Market Analysis, Insights and Forecast - by Type of Turf Grass
- 9.4.1. Bermuda Grass
- 9.4.2. Zoysia Grass
- 9.4.3. Blue Kentucky Grass
- 9.4.4. Rye Grass
- 9.4.5. Tall Fescue
- 9.4.6. Others
- 9.5. Market Analysis, Insights and Forecast - by Type of Ornamental Grass
- 9.5.1. Feather Reed Grass
- 9.5.2. Fountain Grass
- 9.5.3. Purple Millet
- 9.5.4. Ravenna Grass
- 9.5.5. Fibre Optic Grass
- 9.5.6. Others
- 9.6. Market Analysis, Insights and Forecast - by Synthetic Chemical Inputs
- 9.6.1. Pesticides
- 9.6.2. Fertilizers
- 9.6.3. Plant Growth Regulators
- 9.6.4. Others
- 9.1. Market Analysis, Insights and Forecast - by Type of Turf Grass
- 10. Africa Turf & Ornamental Chemical Input Industry Analysis, Insights and Forecast, 2020-2032
- 10.1. Market Analysis, Insights and Forecast - by Type of Turf Grass
- 10.1.1. Bermuda Grass
- 10.1.2. Zoysia Grass
- 10.1.3. Blue Kentucky Grass
- 10.1.4. Rye Grass
- 10.1.5. Tall Fescue
- 10.1.6. Others
- 10.2. Market Analysis, Insights and Forecast - by Type of Ornamental Grass
- 10.2.1. Feather Reed Grass
- 10.2.2. Fountain Grass
- 10.2.3. Purple Millet
- 10.2.4. Ravenna Grass
- 10.2.5. Fibre Optic Grass
- 10.2.6. Others
- 10.3. Market Analysis, Insights and Forecast - by Synthetic Chemical Inputs
- 10.3.1. Pesticides
- 10.3.2. Fertilizers
- 10.3.3. Plant Growth Regulators
- 10.3.4. Others
- 10.4. Market Analysis, Insights and Forecast - by Type of Turf Grass
- 10.4.1. Bermuda Grass
- 10.4.2. Zoysia Grass
- 10.4.3. Blue Kentucky Grass
- 10.4.4. Rye Grass
- 10.4.5. Tall Fescue
- 10.4.6. Others
- 10.5. Market Analysis, Insights and Forecast - by Type of Ornamental Grass
- 10.5.1. Feather Reed Grass
- 10.5.2. Fountain Grass
- 10.5.3. Purple Millet
- 10.5.4. Ravenna Grass
- 10.5.5. Fibre Optic Grass
- 10.5.6. Others
- 10.6. Market Analysis, Insights and Forecast - by Synthetic Chemical Inputs
- 10.6.1. Pesticides
- 10.6.2. Fertilizers
- 10.6.3. Plant Growth Regulators
- 10.6.4. Others
- 10.1. Market Analysis, Insights and Forecast - by Type of Turf Grass
- 11. Competitive Analysis
- 11.1. Global Market Share Analysis 2025
- 11.2. Company Profiles
- 11.2.1 FMC Corporation
- 11.2.1.1. Overview
- 11.2.1.2. Products
- 11.2.1.3. SWOT Analysis
- 11.2.1.4. Recent Developments
- 11.2.1.5. Financials (Based on Availability)
- 11.2.2 Bayer Crop Sciences
- 11.2.2.1. Overview
- 11.2.2.2. Products
- 11.2.2.3. SWOT Analysis
- 11.2.2.4. Recent Developments
- 11.2.2.5. Financials (Based on Availability)
- 11.2.3 American Vanguard Corporation
- 11.2.3.1. Overview
- 11.2.3.2. Products
- 11.2.3.3. SWOT Analysis
- 11.2.3.4. Recent Developments
- 11.2.3.5. Financials (Based on Availability)
- 11.2.4 Chemisco Division of United Industries Corp
- 11.2.4.1. Overview
- 11.2.4.2. Products
- 11.2.4.3. SWOT Analysis
- 11.2.4.4. Recent Developments
- 11.2.4.5. Financials (Based on Availability)
- 11.2.5 Syngenta A
- 11.2.5.1. Overview
- 11.2.5.2. Products
- 11.2.5.3. SWOT Analysis
- 11.2.5.4. Recent Developments
- 11.2.5.5. Financials (Based on Availability)
- 11.2.6 Precision Laboratories
- 11.2.6.1. Overview
- 11.2.6.2. Products
- 11.2.6.3. SWOT Analysis
- 11.2.6.4. Recent Developments
- 11.2.6.5. Financials (Based on Availability)
- 11.2.7 DowDuPont
- 11.2.7.1. Overview
- 11.2.7.2. Products
- 11.2.7.3. SWOT Analysis
- 11.2.7.4. Recent Developments
- 11.2.7.5. Financials (Based on Availability)
- 11.2.8 Monsanto Company
- 11.2.8.1. Overview
- 11.2.8.2. Products
- 11.2.8.3. SWOT Analysis
- 11.2.8.4. Recent Developments
- 11.2.8.5. Financials (Based on Availability)
- 11.2.9 Gowan International
- 11.2.9.1. Overview
- 11.2.9.2. Products
- 11.2.9.3. SWOT Analysis
- 11.2.9.4. Recent Developments
- 11.2.9.5. Financials (Based on Availability)
- 11.2.10 Chemtura Agro Solutions
- 11.2.10.1. Overview
- 11.2.10.2. Products
- 11.2.10.3. SWOT Analysis
- 11.2.10.4. Recent Developments
- 11.2.10.5. Financials (Based on Availability)
- 11.2.11 Adama Agricultural Solutions
- 11.2.11.1. Overview
- 11.2.11.2. Products
- 11.2.11.3. SWOT Analysis
- 11.2.11.4. Recent Developments
- 11.2.11.5. Financials (Based on Availability)
- 11.2.12 Koch Agronomic Services LLC
- 11.2.12.1. Overview
- 11.2.12.2. Products
- 11.2.12.3. SWOT Analysis
- 11.2.12.4. Recent Developments
- 11.2.12.5. Financials (Based on Availability)
- 11.2.13 Nufarm Ltd
- 11.2.13.1. Overview
- 11.2.13.2. Products
- 11.2.13.3. SWOT Analysis
- 11.2.13.4. Recent Developments
- 11.2.13.5. Financials (Based on Availability)
- 11.2.14 BASF SE
- 11.2.14.1. Overview
- 11.2.14.2. Products
- 11.2.14.3. SWOT Analysis
- 11.2.14.4. Recent Developments
- 11.2.14.5. Financials (Based on Availability)
- 11.2.1 FMC Corporation
List of Figures
- Figure 1: Global Turf & Ornamental Chemical Input Industry Revenue Breakdown (Million, %) by Region 2025 & 2033
- Figure 2: Global Turf & Ornamental Chemical Input Industry Volume Breakdown (Kiloton, %) by Region 2025 & 2033
- Figure 3: North America Turf & Ornamental Chemical Input Industry Revenue (Million), by Type of Turf Grass 2025 & 2033
- Figure 4: North America Turf & Ornamental Chemical Input Industry Volume (Kiloton), by Type of Turf Grass 2025 & 2033
- Figure 5: North America Turf & Ornamental Chemical Input Industry Revenue Share (%), by Type of Turf Grass 2025 & 2033
- Figure 6: North America Turf & Ornamental Chemical Input Industry Volume Share (%), by Type of Turf Grass 2025 & 2033
- Figure 7: North America Turf & Ornamental Chemical Input Industry Revenue (Million), by Type of Ornamental Grass 2025 & 2033
- Figure 8: North America Turf & Ornamental Chemical Input Industry Volume (Kiloton), by Type of Ornamental Grass 2025 & 2033
- Figure 9: North America Turf & Ornamental Chemical Input Industry Revenue Share (%), by Type of Ornamental Grass 2025 & 2033
- Figure 10: North America Turf & Ornamental Chemical Input Industry Volume Share (%), by Type of Ornamental Grass 2025 & 2033
- Figure 11: North America Turf & Ornamental Chemical Input Industry Revenue (Million), by Synthetic Chemical Inputs 2025 & 2033
- Figure 12: North America Turf & Ornamental Chemical Input Industry Volume (Kiloton), by Synthetic Chemical Inputs 2025 & 2033
- Figure 13: North America Turf & Ornamental Chemical Input Industry Revenue Share (%), by Synthetic Chemical Inputs 2025 & 2033
- Figure 14: North America Turf & Ornamental Chemical Input Industry Volume Share (%), by Synthetic Chemical Inputs 2025 & 2033
- Figure 15: North America Turf & Ornamental Chemical Input Industry Revenue (Million), by Type of Turf Grass 2025 & 2033
- Figure 16: North America Turf & Ornamental Chemical Input Industry Volume (Kiloton), by Type of Turf Grass 2025 & 2033
- Figure 17: North America Turf & Ornamental Chemical Input Industry Revenue Share (%), by Type of Turf Grass 2025 & 2033
- Figure 18: North America Turf & Ornamental Chemical Input Industry Volume Share (%), by Type of Turf Grass 2025 & 2033
- Figure 19: North America Turf & Ornamental Chemical Input Industry Revenue (Million), by Type of Ornamental Grass 2025 & 2033
- Figure 20: North America Turf & Ornamental Chemical Input Industry Volume (Kiloton), by Type of Ornamental Grass 2025 & 2033
- Figure 21: North America Turf & Ornamental Chemical Input Industry Revenue Share (%), by Type of Ornamental Grass 2025 & 2033
- Figure 22: North America Turf & Ornamental Chemical Input Industry Volume Share (%), by Type of Ornamental Grass 2025 & 2033
- Figure 23: North America Turf & Ornamental Chemical Input Industry Revenue (Million), by Synthetic Chemical Inputs 2025 & 2033
- Figure 24: North America Turf & Ornamental Chemical Input Industry Volume (Kiloton), by Synthetic Chemical Inputs 2025 & 2033
- Figure 25: North America Turf & Ornamental Chemical Input Industry Revenue Share (%), by Synthetic Chemical Inputs 2025 & 2033
- Figure 26: North America Turf & Ornamental Chemical Input Industry Volume Share (%), by Synthetic Chemical Inputs 2025 & 2033
- Figure 27: North America Turf & Ornamental Chemical Input Industry Revenue (Million), by Country 2025 & 2033
- Figure 28: North America Turf & Ornamental Chemical Input Industry Volume (Kiloton), by Country 2025 & 2033
- Figure 29: North America Turf & Ornamental Chemical Input Industry Revenue Share (%), by Country 2025 & 2033
- Figure 30: North America Turf & Ornamental Chemical Input Industry Volume Share (%), by Country 2025 & 2033
- Figure 31: Europe Turf & Ornamental Chemical Input Industry Revenue (Million), by Type of Turf Grass 2025 & 2033
- Figure 32: Europe Turf & Ornamental Chemical Input Industry Volume (Kiloton), by Type of Turf Grass 2025 & 2033
- Figure 33: Europe Turf & Ornamental Chemical Input Industry Revenue Share (%), by Type of Turf Grass 2025 & 2033
- Figure 34: Europe Turf & Ornamental Chemical Input Industry Volume Share (%), by Type of Turf Grass 2025 & 2033
- Figure 35: Europe Turf & Ornamental Chemical Input Industry Revenue (Million), by Type of Ornamental Grass 2025 & 2033
- Figure 36: Europe Turf & Ornamental Chemical Input Industry Volume (Kiloton), by Type of Ornamental Grass 2025 & 2033
- Figure 37: Europe Turf & Ornamental Chemical Input Industry Revenue Share (%), by Type of Ornamental Grass 2025 & 2033
- Figure 38: Europe Turf & Ornamental Chemical Input Industry Volume Share (%), by Type of Ornamental Grass 2025 & 2033
- Figure 39: Europe Turf & Ornamental Chemical Input Industry Revenue (Million), by Synthetic Chemical Inputs 2025 & 2033
- Figure 40: Europe Turf & Ornamental Chemical Input Industry Volume (Kiloton), by Synthetic Chemical Inputs 2025 & 2033
- Figure 41: Europe Turf & Ornamental Chemical Input Industry Revenue Share (%), by Synthetic Chemical Inputs 2025 & 2033
- Figure 42: Europe Turf & Ornamental Chemical Input Industry Volume Share (%), by Synthetic Chemical Inputs 2025 & 2033
- Figure 43: Europe Turf & Ornamental Chemical Input Industry Revenue (Million), by Type of Turf Grass 2025 & 2033
- Figure 44: Europe Turf & Ornamental Chemical Input Industry Volume (Kiloton), by Type of Turf Grass 2025 & 2033
- Figure 45: Europe Turf & Ornamental Chemical Input Industry Revenue Share (%), by Type of Turf Grass 2025 & 2033
- Figure 46: Europe Turf & Ornamental Chemical Input Industry Volume Share (%), by Type of Turf Grass 2025 & 2033
- Figure 47: Europe Turf & Ornamental Chemical Input Industry Revenue (Million), by Type of Ornamental Grass 2025 & 2033
- Figure 48: Europe Turf & Ornamental Chemical Input Industry Volume (Kiloton), by Type of Ornamental Grass 2025 & 2033
- Figure 49: Europe Turf & Ornamental Chemical Input Industry Revenue Share (%), by Type of Ornamental Grass 2025 & 2033
- Figure 50: Europe Turf & Ornamental Chemical Input Industry Volume Share (%), by Type of Ornamental Grass 2025 & 2033
- Figure 51: Europe Turf & Ornamental Chemical Input Industry Revenue (Million), by Synthetic Chemical Inputs 2025 & 2033
- Figure 52: Europe Turf & Ornamental Chemical Input Industry Volume (Kiloton), by Synthetic Chemical Inputs 2025 & 2033
- Figure 53: Europe Turf & Ornamental Chemical Input Industry Revenue Share (%), by Synthetic Chemical Inputs 2025 & 2033
- Figure 54: Europe Turf & Ornamental Chemical Input Industry Volume Share (%), by Synthetic Chemical Inputs 2025 & 2033
- Figure 55: Europe Turf & Ornamental Chemical Input Industry Revenue (Million), by Country 2025 & 2033
- Figure 56: Europe Turf & Ornamental Chemical Input Industry Volume (Kiloton), by Country 2025 & 2033
- Figure 57: Europe Turf & Ornamental Chemical Input Industry Revenue Share (%), by Country 2025 & 2033
- Figure 58: Europe Turf & Ornamental Chemical Input Industry Volume Share (%), by Country 2025 & 2033
- Figure 59: Asia Pacific Turf & Ornamental Chemical Input Industry Revenue (Million), by Type of Turf Grass 2025 & 2033
- Figure 60: Asia Pacific Turf & Ornamental Chemical Input Industry Volume (Kiloton), by Type of Turf Grass 2025 & 2033
- Figure 61: Asia Pacific Turf & Ornamental Chemical Input Industry Revenue Share (%), by Type of Turf Grass 2025 & 2033
- Figure 62: Asia Pacific Turf & Ornamental Chemical Input Industry Volume Share (%), by Type of Turf Grass 2025 & 2033
- Figure 63: Asia Pacific Turf & Ornamental Chemical Input Industry Revenue (Million), by Type of Ornamental Grass 2025 & 2033
- Figure 64: Asia Pacific Turf & Ornamental Chemical Input Industry Volume (Kiloton), by Type of Ornamental Grass 2025 & 2033
- Figure 65: Asia Pacific Turf & Ornamental Chemical Input Industry Revenue Share (%), by Type of Ornamental Grass 2025 & 2033
- Figure 66: Asia Pacific Turf & Ornamental Chemical Input Industry Volume Share (%), by Type of Ornamental Grass 2025 & 2033
- Figure 67: Asia Pacific Turf & Ornamental Chemical Input Industry Revenue (Million), by Synthetic Chemical Inputs 2025 & 2033
- Figure 68: Asia Pacific Turf & Ornamental Chemical Input Industry Volume (Kiloton), by Synthetic Chemical Inputs 2025 & 2033
- Figure 69: Asia Pacific Turf & Ornamental Chemical Input Industry Revenue Share (%), by Synthetic Chemical Inputs 2025 & 2033
- Figure 70: Asia Pacific Turf & Ornamental Chemical Input Industry Volume Share (%), by Synthetic Chemical Inputs 2025 & 2033
- Figure 71: Asia Pacific Turf & Ornamental Chemical Input Industry Revenue (Million), by Type of Turf Grass 2025 & 2033
- Figure 72: Asia Pacific Turf & Ornamental Chemical Input Industry Volume (Kiloton), by Type of Turf Grass 2025 & 2033
- Figure 73: Asia Pacific Turf & Ornamental Chemical Input Industry Revenue Share (%), by Type of Turf Grass 2025 & 2033
- Figure 74: Asia Pacific Turf & Ornamental Chemical Input Industry Volume Share (%), by Type of Turf Grass 2025 & 2033
- Figure 75: Asia Pacific Turf & Ornamental Chemical Input Industry Revenue (Million), by Type of Ornamental Grass 2025 & 2033
- Figure 76: Asia Pacific Turf & Ornamental Chemical Input Industry Volume (Kiloton), by Type of Ornamental Grass 2025 & 2033
- Figure 77: Asia Pacific Turf & Ornamental Chemical Input Industry Revenue Share (%), by Type of Ornamental Grass 2025 & 2033
- Figure 78: Asia Pacific Turf & Ornamental Chemical Input Industry Volume Share (%), by Type of Ornamental Grass 2025 & 2033
- Figure 79: Asia Pacific Turf & Ornamental Chemical Input Industry Revenue (Million), by Synthetic Chemical Inputs 2025 & 2033
- Figure 80: Asia Pacific Turf & Ornamental Chemical Input Industry Volume (Kiloton), by Synthetic Chemical Inputs 2025 & 2033
- Figure 81: Asia Pacific Turf & Ornamental Chemical Input Industry Revenue Share (%), by Synthetic Chemical Inputs 2025 & 2033
- Figure 82: Asia Pacific Turf & Ornamental Chemical Input Industry Volume Share (%), by Synthetic Chemical Inputs 2025 & 2033
- Figure 83: Asia Pacific Turf & Ornamental Chemical Input Industry Revenue (Million), by Country 2025 & 2033
- Figure 84: Asia Pacific Turf & Ornamental Chemical Input Industry Volume (Kiloton), by Country 2025 & 2033
- Figure 85: Asia Pacific Turf & Ornamental Chemical Input Industry Revenue Share (%), by Country 2025 & 2033
- Figure 86: Asia Pacific Turf & Ornamental Chemical Input Industry Volume Share (%), by Country 2025 & 2033
- Figure 87: South America Turf & Ornamental Chemical Input Industry Revenue (Million), by Type of Turf Grass 2025 & 2033
- Figure 88: South America Turf & Ornamental Chemical Input Industry Volume (Kiloton), by Type of Turf Grass 2025 & 2033
- Figure 89: South America Turf & Ornamental Chemical Input Industry Revenue Share (%), by Type of Turf Grass 2025 & 2033
- Figure 90: South America Turf & Ornamental Chemical Input Industry Volume Share (%), by Type of Turf Grass 2025 & 2033
- Figure 91: South America Turf & Ornamental Chemical Input Industry Revenue (Million), by Type of Ornamental Grass 2025 & 2033
- Figure 92: South America Turf & Ornamental Chemical Input Industry Volume (Kiloton), by Type of Ornamental Grass 2025 & 2033
- Figure 93: South America Turf & Ornamental Chemical Input Industry Revenue Share (%), by Type of Ornamental Grass 2025 & 2033
- Figure 94: South America Turf & Ornamental Chemical Input Industry Volume Share (%), by Type of Ornamental Grass 2025 & 2033
- Figure 95: South America Turf & Ornamental Chemical Input Industry Revenue (Million), by Synthetic Chemical Inputs 2025 & 2033
- Figure 96: South America Turf & Ornamental Chemical Input Industry Volume (Kiloton), by Synthetic Chemical Inputs 2025 & 2033
- Figure 97: South America Turf & Ornamental Chemical Input Industry Revenue Share (%), by Synthetic Chemical Inputs 2025 & 2033
- Figure 98: South America Turf & Ornamental Chemical Input Industry Volume Share (%), by Synthetic Chemical Inputs 2025 & 2033
- Figure 99: South America Turf & Ornamental Chemical Input Industry Revenue (Million), by Type of Turf Grass 2025 & 2033
- Figure 100: South America Turf & Ornamental Chemical Input Industry Volume (Kiloton), by Type of Turf Grass 2025 & 2033
- Figure 101: South America Turf & Ornamental Chemical Input Industry Revenue Share (%), by Type of Turf Grass 2025 & 2033
- Figure 102: South America Turf & Ornamental Chemical Input Industry Volume Share (%), by Type of Turf Grass 2025 & 2033
- Figure 103: South America Turf & Ornamental Chemical Input Industry Revenue (Million), by Type of Ornamental Grass 2025 & 2033
- Figure 104: South America Turf & Ornamental Chemical Input Industry Volume (Kiloton), by Type of Ornamental Grass 2025 & 2033
- Figure 105: South America Turf & Ornamental Chemical Input Industry Revenue Share (%), by Type of Ornamental Grass 2025 & 2033
- Figure 106: South America Turf & Ornamental Chemical Input Industry Volume Share (%), by Type of Ornamental Grass 2025 & 2033
- Figure 107: South America Turf & Ornamental Chemical Input Industry Revenue (Million), by Synthetic Chemical Inputs 2025 & 2033
- Figure 108: South America Turf & Ornamental Chemical Input Industry Volume (Kiloton), by Synthetic Chemical Inputs 2025 & 2033
- Figure 109: South America Turf & Ornamental Chemical Input Industry Revenue Share (%), by Synthetic Chemical Inputs 2025 & 2033
- Figure 110: South America Turf & Ornamental Chemical Input Industry Volume Share (%), by Synthetic Chemical Inputs 2025 & 2033
- Figure 111: South America Turf & Ornamental Chemical Input Industry Revenue (Million), by Country 2025 & 2033
- Figure 112: South America Turf & Ornamental Chemical Input Industry Volume (Kiloton), by Country 2025 & 2033
- Figure 113: South America Turf & Ornamental Chemical Input Industry Revenue Share (%), by Country 2025 & 2033
- Figure 114: South America Turf & Ornamental Chemical Input Industry Volume Share (%), by Country 2025 & 2033
- Figure 115: Africa Turf & Ornamental Chemical Input Industry Revenue (Million), by Type of Turf Grass 2025 & 2033
- Figure 116: Africa Turf & Ornamental Chemical Input Industry Volume (Kiloton), by Type of Turf Grass 2025 & 2033
- Figure 117: Africa Turf & Ornamental Chemical Input Industry Revenue Share (%), by Type of Turf Grass 2025 & 2033
- Figure 118: Africa Turf & Ornamental Chemical Input Industry Volume Share (%), by Type of Turf Grass 2025 & 2033
- Figure 119: Africa Turf & Ornamental Chemical Input Industry Revenue (Million), by Type of Ornamental Grass 2025 & 2033
- Figure 120: Africa Turf & Ornamental Chemical Input Industry Volume (Kiloton), by Type of Ornamental Grass 2025 & 2033
- Figure 121: Africa Turf & Ornamental Chemical Input Industry Revenue Share (%), by Type of Ornamental Grass 2025 & 2033
- Figure 122: Africa Turf & Ornamental Chemical Input Industry Volume Share (%), by Type of Ornamental Grass 2025 & 2033
- Figure 123: Africa Turf & Ornamental Chemical Input Industry Revenue (Million), by Synthetic Chemical Inputs 2025 & 2033
- Figure 124: Africa Turf & Ornamental Chemical Input Industry Volume (Kiloton), by Synthetic Chemical Inputs 2025 & 2033
- Figure 125: Africa Turf & Ornamental Chemical Input Industry Revenue Share (%), by Synthetic Chemical Inputs 2025 & 2033
- Figure 126: Africa Turf & Ornamental Chemical Input Industry Volume Share (%), by Synthetic Chemical Inputs 2025 & 2033
- Figure 127: Africa Turf & Ornamental Chemical Input Industry Revenue (Million), by Type of Turf Grass 2025 & 2033
- Figure 128: Africa Turf & Ornamental Chemical Input Industry Volume (Kiloton), by Type of Turf Grass 2025 & 2033
- Figure 129: Africa Turf & Ornamental Chemical Input Industry Revenue Share (%), by Type of Turf Grass 2025 & 2033
- Figure 130: Africa Turf & Ornamental Chemical Input Industry Volume Share (%), by Type of Turf Grass 2025 & 2033
- Figure 131: Africa Turf & Ornamental Chemical Input Industry Revenue (Million), by Type of Ornamental Grass 2025 & 2033
- Figure 132: Africa Turf & Ornamental Chemical Input Industry Volume (Kiloton), by Type of Ornamental Grass 2025 & 2033
- Figure 133: Africa Turf & Ornamental Chemical Input Industry Revenue Share (%), by Type of Ornamental Grass 2025 & 2033
- Figure 134: Africa Turf & Ornamental Chemical Input Industry Volume Share (%), by Type of Ornamental Grass 2025 & 2033
- Figure 135: Africa Turf & Ornamental Chemical Input Industry Revenue (Million), by Synthetic Chemical Inputs 2025 & 2033
- Figure 136: Africa Turf & Ornamental Chemical Input Industry Volume (Kiloton), by Synthetic Chemical Inputs 2025 & 2033
- Figure 137: Africa Turf & Ornamental Chemical Input Industry Revenue Share (%), by Synthetic Chemical Inputs 2025 & 2033
- Figure 138: Africa Turf & Ornamental Chemical Input Industry Volume Share (%), by Synthetic Chemical Inputs 2025 & 2033
- Figure 139: Africa Turf & Ornamental Chemical Input Industry Revenue (Million), by Country 2025 & 2033
- Figure 140: Africa Turf & Ornamental Chemical Input Industry Volume (Kiloton), by Country 2025 & 2033
- Figure 141: Africa Turf & Ornamental Chemical Input Industry Revenue Share (%), by Country 2025 & 2033
- Figure 142: Africa Turf & Ornamental Chemical Input Industry Volume Share (%), by Country 2025 & 2033
List of Tables
- Table 1: Global Turf & Ornamental Chemical Input Industry Revenue Million Forecast, by Type of Turf Grass 2020 & 2033
- Table 2: Global Turf & Ornamental Chemical Input Industry Volume Kiloton Forecast, by Type of Turf Grass 2020 & 2033
- Table 3: Global Turf & Ornamental Chemical Input Industry Revenue Million Forecast, by Type of Ornamental Grass 2020 & 2033
- Table 4: Global Turf & Ornamental Chemical Input Industry Volume Kiloton Forecast, by Type of Ornamental Grass 2020 & 2033
- Table 5: Global Turf & Ornamental Chemical Input Industry Revenue Million Forecast, by Synthetic Chemical Inputs 2020 & 2033
- Table 6: Global Turf & Ornamental Chemical Input Industry Volume Kiloton Forecast, by Synthetic Chemical Inputs 2020 & 2033
- Table 7: Global Turf & Ornamental Chemical Input Industry Revenue Million Forecast, by Type of Turf Grass 2020 & 2033
- Table 8: Global Turf & Ornamental Chemical Input Industry Volume Kiloton Forecast, by Type of Turf Grass 2020 & 2033
- Table 9: Global Turf & Ornamental Chemical Input Industry Revenue Million Forecast, by Type of Ornamental Grass 2020 & 2033
- Table 10: Global Turf & Ornamental Chemical Input Industry Volume Kiloton Forecast, by Type of Ornamental Grass 2020 & 2033
- Table 11: Global Turf & Ornamental Chemical Input Industry Revenue Million Forecast, by Synthetic Chemical Inputs 2020 & 2033
- Table 12: Global Turf & Ornamental Chemical Input Industry Volume Kiloton Forecast, by Synthetic Chemical Inputs 2020 & 2033
- Table 13: Global Turf & Ornamental Chemical Input Industry Revenue Million Forecast, by Region 2020 & 2033
- Table 14: Global Turf & Ornamental Chemical Input Industry Volume Kiloton Forecast, by Region 2020 & 2033
- Table 15: Global Turf & Ornamental Chemical Input Industry Revenue Million Forecast, by Type of Turf Grass 2020 & 2033
- Table 16: Global Turf & Ornamental Chemical Input Industry Volume Kiloton Forecast, by Type of Turf Grass 2020 & 2033
- Table 17: Global Turf & Ornamental Chemical Input Industry Revenue Million Forecast, by Type of Ornamental Grass 2020 & 2033
- Table 18: Global Turf & Ornamental Chemical Input Industry Volume Kiloton Forecast, by Type of Ornamental Grass 2020 & 2033
- Table 19: Global Turf & Ornamental Chemical Input Industry Revenue Million Forecast, by Synthetic Chemical Inputs 2020 & 2033
- Table 20: Global Turf & Ornamental Chemical Input Industry Volume Kiloton Forecast, by Synthetic Chemical Inputs 2020 & 2033
- Table 21: Global Turf & Ornamental Chemical Input Industry Revenue Million Forecast, by Type of Turf Grass 2020 & 2033
- Table 22: Global Turf & Ornamental Chemical Input Industry Volume Kiloton Forecast, by Type of Turf Grass 2020 & 2033
- Table 23: Global Turf & Ornamental Chemical Input Industry Revenue Million Forecast, by Type of Ornamental Grass 2020 & 2033
- Table 24: Global Turf & Ornamental Chemical Input Industry Volume Kiloton Forecast, by Type of Ornamental Grass 2020 & 2033
- Table 25: Global Turf & Ornamental Chemical Input Industry Revenue Million Forecast, by Synthetic Chemical Inputs 2020 & 2033
- Table 26: Global Turf & Ornamental Chemical Input Industry Volume Kiloton Forecast, by Synthetic Chemical Inputs 2020 & 2033
- Table 27: Global Turf & Ornamental Chemical Input Industry Revenue Million Forecast, by Country 2020 & 2033
- Table 28: Global Turf & Ornamental Chemical Input Industry Volume Kiloton Forecast, by Country 2020 & 2033
- Table 29: United States Turf & Ornamental Chemical Input Industry Revenue (Million) Forecast, by Application 2020 & 2033
- Table 30: United States Turf & Ornamental Chemical Input Industry Volume (Kiloton) Forecast, by Application 2020 & 2033
- Table 31: Canada Turf & Ornamental Chemical Input Industry Revenue (Million) Forecast, by Application 2020 & 2033
- Table 32: Canada Turf & Ornamental Chemical Input Industry Volume (Kiloton) Forecast, by Application 2020 & 2033
- Table 33: Mexico Turf & Ornamental Chemical Input Industry Revenue (Million) Forecast, by Application 2020 & 2033
- Table 34: Mexico Turf & Ornamental Chemical Input Industry Volume (Kiloton) Forecast, by Application 2020 & 2033
- Table 35: Rest of North America Turf & Ornamental Chemical Input Industry Revenue (Million) Forecast, by Application 2020 & 2033
- Table 36: Rest of North America Turf & Ornamental Chemical Input Industry Volume (Kiloton) Forecast, by Application 2020 & 2033
- Table 37: Global Turf & Ornamental Chemical Input Industry Revenue Million Forecast, by Type of Turf Grass 2020 & 2033
- Table 38: Global Turf & Ornamental Chemical Input Industry Volume Kiloton Forecast, by Type of Turf Grass 2020 & 2033
- Table 39: Global Turf & Ornamental Chemical Input Industry Revenue Million Forecast, by Type of Ornamental Grass 2020 & 2033
- Table 40: Global Turf & Ornamental Chemical Input Industry Volume Kiloton Forecast, by Type of Ornamental Grass 2020 & 2033
- Table 41: Global Turf & Ornamental Chemical Input Industry Revenue Million Forecast, by Synthetic Chemical Inputs 2020 & 2033
- Table 42: Global Turf & Ornamental Chemical Input Industry Volume Kiloton Forecast, by Synthetic Chemical Inputs 2020 & 2033
- Table 43: Global Turf & Ornamental Chemical Input Industry Revenue Million Forecast, by Type of Turf Grass 2020 & 2033
- Table 44: Global Turf & Ornamental Chemical Input Industry Volume Kiloton Forecast, by Type of Turf Grass 2020 & 2033
- Table 45: Global Turf & Ornamental Chemical Input Industry Revenue Million Forecast, by Type of Ornamental Grass 2020 & 2033
- Table 46: Global Turf & Ornamental Chemical Input Industry Volume Kiloton Forecast, by Type of Ornamental Grass 2020 & 2033
- Table 47: Global Turf & Ornamental Chemical Input Industry Revenue Million Forecast, by Synthetic Chemical Inputs 2020 & 2033
- Table 48: Global Turf & Ornamental Chemical Input Industry Volume Kiloton Forecast, by Synthetic Chemical Inputs 2020 & 2033
- Table 49: Global Turf & Ornamental Chemical Input Industry Revenue Million Forecast, by Country 2020 & 2033
- Table 50: Global Turf & Ornamental Chemical Input Industry Volume Kiloton Forecast, by Country 2020 & 2033
- Table 51: Spain Turf & Ornamental Chemical Input Industry Revenue (Million) Forecast, by Application 2020 & 2033
- Table 52: Spain Turf & Ornamental Chemical Input Industry Volume (Kiloton) Forecast, by Application 2020 & 2033
- Table 53: United Kingdom Turf & Ornamental Chemical Input Industry Revenue (Million) Forecast, by Application 2020 & 2033
- Table 54: United Kingdom Turf & Ornamental Chemical Input Industry Volume (Kiloton) Forecast, by Application 2020 & 2033
- Table 55: France Turf & Ornamental Chemical Input Industry Revenue (Million) Forecast, by Application 2020 & 2033
- Table 56: France Turf & Ornamental Chemical Input Industry Volume (Kiloton) Forecast, by Application 2020 & 2033
- Table 57: Germany Turf & Ornamental Chemical Input Industry Revenue (Million) Forecast, by Application 2020 & 2033
- Table 58: Germany Turf & Ornamental Chemical Input Industry Volume (Kiloton) Forecast, by Application 2020 & 2033
- Table 59: Denmark Turf & Ornamental Chemical Input Industry Revenue (Million) Forecast, by Application 2020 & 2033
- Table 60: Denmark Turf & Ornamental Chemical Input Industry Volume (Kiloton) Forecast, by Application 2020 & 2033
- Table 61: Italy Turf & Ornamental Chemical Input Industry Revenue (Million) Forecast, by Application 2020 & 2033
- Table 62: Italy Turf & Ornamental Chemical Input Industry Volume (Kiloton) Forecast, by Application 2020 & 2033
- Table 63: Rest of Europe Turf & Ornamental Chemical Input Industry Revenue (Million) Forecast, by Application 2020 & 2033
- Table 64: Rest of Europe Turf & Ornamental Chemical Input Industry Volume (Kiloton) Forecast, by Application 2020 & 2033
- Table 65: Global Turf & Ornamental Chemical Input Industry Revenue Million Forecast, by Type of Turf Grass 2020 & 2033
- Table 66: Global Turf & Ornamental Chemical Input Industry Volume Kiloton Forecast, by Type of Turf Grass 2020 & 2033
- Table 67: Global Turf & Ornamental Chemical Input Industry Revenue Million Forecast, by Type of Ornamental Grass 2020 & 2033
- Table 68: Global Turf & Ornamental Chemical Input Industry Volume Kiloton Forecast, by Type of Ornamental Grass 2020 & 2033
- Table 69: Global Turf & Ornamental Chemical Input Industry Revenue Million Forecast, by Synthetic Chemical Inputs 2020 & 2033
- Table 70: Global Turf & Ornamental Chemical Input Industry Volume Kiloton Forecast, by Synthetic Chemical Inputs 2020 & 2033
- Table 71: Global Turf & Ornamental Chemical Input Industry Revenue Million Forecast, by Type of Turf Grass 2020 & 2033
- Table 72: Global Turf & Ornamental Chemical Input Industry Volume Kiloton Forecast, by Type of Turf Grass 2020 & 2033
- Table 73: Global Turf & Ornamental Chemical Input Industry Revenue Million Forecast, by Type of Ornamental Grass 2020 & 2033
- Table 74: Global Turf & Ornamental Chemical Input Industry Volume Kiloton Forecast, by Type of Ornamental Grass 2020 & 2033
- Table 75: Global Turf & Ornamental Chemical Input Industry Revenue Million Forecast, by Synthetic Chemical Inputs 2020 & 2033
- Table 76: Global Turf & Ornamental Chemical Input Industry Volume Kiloton Forecast, by Synthetic Chemical Inputs 2020 & 2033
- Table 77: Global Turf & Ornamental Chemical Input Industry Revenue Million Forecast, by Country 2020 & 2033
- Table 78: Global Turf & Ornamental Chemical Input Industry Volume Kiloton Forecast, by Country 2020 & 2033
- Table 79: China Turf & Ornamental Chemical Input Industry Revenue (Million) Forecast, by Application 2020 & 2033
- Table 80: China Turf & Ornamental Chemical Input Industry Volume (Kiloton) Forecast, by Application 2020 & 2033
- Table 81: India Turf & Ornamental Chemical Input Industry Revenue (Million) Forecast, by Application 2020 & 2033
- Table 82: India Turf & Ornamental Chemical Input Industry Volume (Kiloton) Forecast, by Application 2020 & 2033
- Table 83: Japan Turf & Ornamental Chemical Input Industry Revenue (Million) Forecast, by Application 2020 & 2033
- Table 84: Japan Turf & Ornamental Chemical Input Industry Volume (Kiloton) Forecast, by Application 2020 & 2033
- Table 85: Thailand Turf & Ornamental Chemical Input Industry Revenue (Million) Forecast, by Application 2020 & 2033
- Table 86: Thailand Turf & Ornamental Chemical Input Industry Volume (Kiloton) Forecast, by Application 2020 & 2033
- Table 87: Australia Turf & Ornamental Chemical Input Industry Revenue (Million) Forecast, by Application 2020 & 2033
- Table 88: Australia Turf & Ornamental Chemical Input Industry Volume (Kiloton) Forecast, by Application 2020 & 2033
- Table 89: Rest of Asia Pacific Turf & Ornamental Chemical Input Industry Revenue (Million) Forecast, by Application 2020 & 2033
- Table 90: Rest of Asia Pacific Turf & Ornamental Chemical Input Industry Volume (Kiloton) Forecast, by Application 2020 & 2033
- Table 91: Global Turf & Ornamental Chemical Input Industry Revenue Million Forecast, by Type of Turf Grass 2020 & 2033
- Table 92: Global Turf & Ornamental Chemical Input Industry Volume Kiloton Forecast, by Type of Turf Grass 2020 & 2033
- Table 93: Global Turf & Ornamental Chemical Input Industry Revenue Million Forecast, by Type of Ornamental Grass 2020 & 2033
- Table 94: Global Turf & Ornamental Chemical Input Industry Volume Kiloton Forecast, by Type of Ornamental Grass 2020 & 2033
- Table 95: Global Turf & Ornamental Chemical Input Industry Revenue Million Forecast, by Synthetic Chemical Inputs 2020 & 2033
- Table 96: Global Turf & Ornamental Chemical Input Industry Volume Kiloton Forecast, by Synthetic Chemical Inputs 2020 & 2033
- Table 97: Global Turf & Ornamental Chemical Input Industry Revenue Million Forecast, by Type of Turf Grass 2020 & 2033
- Table 98: Global Turf & Ornamental Chemical Input Industry Volume Kiloton Forecast, by Type of Turf Grass 2020 & 2033
- Table 99: Global Turf & Ornamental Chemical Input Industry Revenue Million Forecast, by Type of Ornamental Grass 2020 & 2033
- Table 100: Global Turf & Ornamental Chemical Input Industry Volume Kiloton Forecast, by Type of Ornamental Grass 2020 & 2033
- Table 101: Global Turf & Ornamental Chemical Input Industry Revenue Million Forecast, by Synthetic Chemical Inputs 2020 & 2033
- Table 102: Global Turf & Ornamental Chemical Input Industry Volume Kiloton Forecast, by Synthetic Chemical Inputs 2020 & 2033
- Table 103: Global Turf & Ornamental Chemical Input Industry Revenue Million Forecast, by Country 2020 & 2033
- Table 104: Global Turf & Ornamental Chemical Input Industry Volume Kiloton Forecast, by Country 2020 & 2033
- Table 105: Brazil Turf & Ornamental Chemical Input Industry Revenue (Million) Forecast, by Application 2020 & 2033
- Table 106: Brazil Turf & Ornamental Chemical Input Industry Volume (Kiloton) Forecast, by Application 2020 & 2033
- Table 107: Argentina Turf & Ornamental Chemical Input Industry Revenue (Million) Forecast, by Application 2020 & 2033
- Table 108: Argentina Turf & Ornamental Chemical Input Industry Volume (Kiloton) Forecast, by Application 2020 & 2033
- Table 109: Rest of South America Turf & Ornamental Chemical Input Industry Revenue (Million) Forecast, by Application 2020 & 2033
- Table 110: Rest of South America Turf & Ornamental Chemical Input Industry Volume (Kiloton) Forecast, by Application 2020 & 2033
- Table 111: Global Turf & Ornamental Chemical Input Industry Revenue Million Forecast, by Type of Turf Grass 2020 & 2033
- Table 112: Global Turf & Ornamental Chemical Input Industry Volume Kiloton Forecast, by Type of Turf Grass 2020 & 2033
- Table 113: Global Turf & Ornamental Chemical Input Industry Revenue Million Forecast, by Type of Ornamental Grass 2020 & 2033
- Table 114: Global Turf & Ornamental Chemical Input Industry Volume Kiloton Forecast, by Type of Ornamental Grass 2020 & 2033
- Table 115: Global Turf & Ornamental Chemical Input Industry Revenue Million Forecast, by Synthetic Chemical Inputs 2020 & 2033
- Table 116: Global Turf & Ornamental Chemical Input Industry Volume Kiloton Forecast, by Synthetic Chemical Inputs 2020 & 2033
- Table 117: Global Turf & Ornamental Chemical Input Industry Revenue Million Forecast, by Type of Turf Grass 2020 & 2033
- Table 118: Global Turf & Ornamental Chemical Input Industry Volume Kiloton Forecast, by Type of Turf Grass 2020 & 2033
- Table 119: Global Turf & Ornamental Chemical Input Industry Revenue Million Forecast, by Type of Ornamental Grass 2020 & 2033
- Table 120: Global Turf & Ornamental Chemical Input Industry Volume Kiloton Forecast, by Type of Ornamental Grass 2020 & 2033
- Table 121: Global Turf & Ornamental Chemical Input Industry Revenue Million Forecast, by Synthetic Chemical Inputs 2020 & 2033
- Table 122: Global Turf & Ornamental Chemical Input Industry Volume Kiloton Forecast, by Synthetic Chemical Inputs 2020 & 2033
- Table 123: Global Turf & Ornamental Chemical Input Industry Revenue Million Forecast, by Country 2020 & 2033
- Table 124: Global Turf & Ornamental Chemical Input Industry Volume Kiloton Forecast, by Country 2020 & 2033
- Table 125: South Africa Turf & Ornamental Chemical Input Industry Revenue (Million) Forecast, by Application 2020 & 2033
- Table 126: South Africa Turf & Ornamental Chemical Input Industry Volume (Kiloton) Forecast, by Application 2020 & 2033
- Table 127: Rest of Africa Turf & Ornamental Chemical Input Industry Revenue (Million) Forecast, by Application 2020 & 2033
- Table 128: Rest of Africa Turf & Ornamental Chemical Input Industry Volume (Kiloton) Forecast, by Application 2020 & 2033
Frequently Asked Questions
1. What is the projected Compound Annual Growth Rate (CAGR) of the Turf & Ornamental Chemical Input Industry?
The projected CAGR is approximately 4.34%.
2. Which companies are prominent players in the Turf & Ornamental Chemical Input Industry?
Key companies in the market include FMC Corporation, Bayer Crop Sciences, American Vanguard Corporation, Chemisco Division of United Industries Corp, Syngenta A, Precision Laboratories, DowDuPont, Monsanto Company, Gowan International, Chemtura Agro Solutions, Adama Agricultural Solutions, Koch Agronomic Services LLC, Nufarm Ltd, BASF SE.
3. What are the main segments of the Turf & Ornamental Chemical Input Industry?
The market segments include Type of Turf Grass, Type of Ornamental Grass, Synthetic Chemical Inputs, Type of Turf Grass, Type of Ornamental Grass, Synthetic Chemical Inputs.
4. Can you provide details about the market size?
The market size is estimated to be USD 7.02 Million as of 2022.
5. What are some drivers contributing to market growth?
Seed Treatment As A Solution To Enhance Yield; Growing Awareness For Seed Treatment Among The Farmers; Rising Trend Of Organic Farming.
6. What are the notable trends driving market growth?
Increasing Development of the Golf Courses and Sports Field.
7. Are there any restraints impacting market growth?
Limitations Across Farm-Level Seed Treatment; Rising Environmental Concerns.
8. Can you provide examples of recent developments in the market?
March 2022: BASF introduced Pillar SC Intrinsic brand fungicide.This fungicide provided broad-spectrum control of 26 cool- and warm-season turf diseases, like brown patch, dollar spot, leaf spots and large patch with one use rate. Pillar SC Intrinsic brand fungicide is the first fungicide developed for lawn care from BASF.
9. What pricing options are available for accessing the report?
Pricing options include single-user, multi-user, and enterprise licenses priced at USD 4750, USD 5250, and USD 8750 respectively.
10. Is the market size provided in terms of value or volume?
The market size is provided in terms of value, measured in Million and volume, measured in Kiloton.
11. Are there any specific market keywords associated with the report?
Yes, the market keyword associated with the report is "Turf & Ornamental Chemical Input Industry," which aids in identifying and referencing the specific market segment covered.
12. How do I determine which pricing option suits my needs best?
The pricing options vary based on user requirements and access needs. Individual users may opt for single-user licenses, while businesses requiring broader access may choose multi-user or enterprise licenses for cost-effective access to the report.
13. Are there any additional resources or data provided in the Turf & Ornamental Chemical Input Industry report?
While the report offers comprehensive insights, it's advisable to review the specific contents or supplementary materials provided to ascertain if additional resources or data are available.
14. How can I stay updated on further developments or reports in the Turf & Ornamental Chemical Input Industry?
To stay informed about further developments, trends, and reports in the Turf & Ornamental Chemical Input Industry, consider subscribing to industry newsletters, following relevant companies and organizations, or regularly checking reputable industry news sources and publications.
Methodology
Step 1 - Identification of Relevant Samples Size from Population Database


Step 2 - Approaches for Defining Global Market Size (Value, Volume* & Price*)

Note*: In applicable scenarios
Step 3 - Data Sources
Primary Research
- Web Analytics
- Survey Reports
- Research Institute
- Latest Research Reports
- Opinion Leaders
Secondary Research
- Annual Reports
- White Paper
- Latest Press Release
- Industry Association
- Paid Database
- Investor Presentations

Step 4 - Data Triangulation
Involves using different sources of information in order to increase the validity of a study
These sources are likely to be stakeholders in a program - participants, other researchers, program staff, other community members, and so on.
Then we put all data in single framework & apply various statistical tools to find out the dynamic on the market.
During the analysis stage, feedback from the stakeholder groups would be compared to determine areas of agreement as well as areas of divergence