

Key Insights
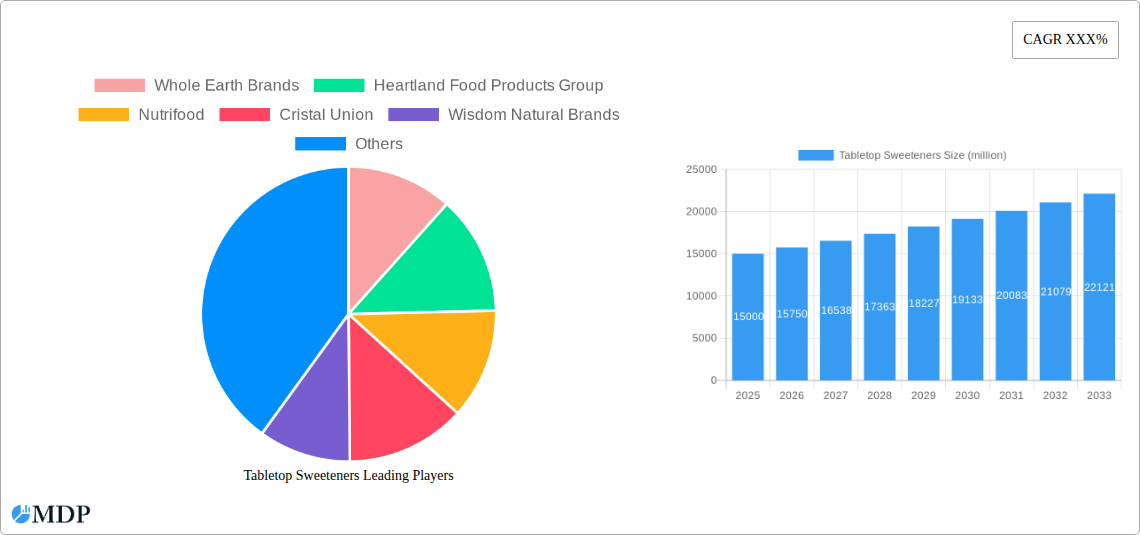
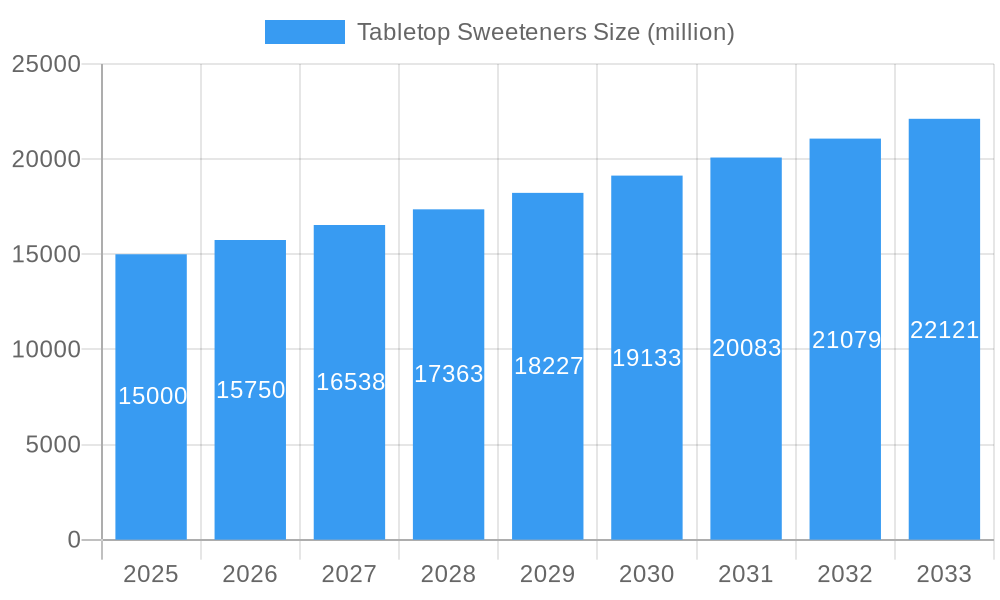
The global tabletop sweeteners market is experiencing robust growth, driven by increasing health consciousness and a shift towards low-calorie and natural alternatives. The market, estimated at $15 billion in 2025, is projected to exhibit a Compound Annual Growth Rate (CAGR) of 5% from 2025 to 2033, reaching approximately $22 billion by 2033. This growth is fueled by several key factors. The rising prevalence of diabetes and obesity is prompting consumers to seek healthier alternatives to traditional sugar. The increasing demand for convenient and portable sweeteners, particularly for on-the-go consumption, is further driving market expansion. Furthermore, the growing popularity of specialty coffee and tea, along with the increasing use of sweeteners in baking and other culinary applications, contributes significantly to market growth. Major players like Whole Earth Brands, Heartland Food Products Group, and Ajinomoto are actively innovating and expanding their product portfolios to cater to evolving consumer preferences, focusing on natural ingredients, reduced calorie options, and unique flavor profiles.
Tabletop Sweeteners Market Size (In Billion)
However, the market also faces certain challenges. Fluctuations in raw material prices, particularly those of natural sweeteners like stevia and monk fruit, can impact profitability. Furthermore, stringent regulatory guidelines concerning the labeling and safety of artificial sweeteners present a hurdle for market expansion. Nevertheless, the overall outlook for the tabletop sweeteners market remains positive, with significant growth opportunities arising from emerging markets, increasing product diversification, and the growing adoption of healthier lifestyles. The continued focus on research and development of novel, healthier sweeteners will be crucial for sustained market growth in the coming years. The segmentation of the market, while not explicitly detailed, likely includes categories based on sweetener type (e.g., sugar substitutes, natural sweeteners), form (e.g., granulated, liquid, packets), and distribution channel (e.g., retail, food service).
Tabletop Sweeteners Company Market Share
Unlock the Sweetness: A Comprehensive Report on the Tabletop Sweeteners Market (2019-2033)
This in-depth report delves into the dynamic world of tabletop sweeteners, offering invaluable insights for industry stakeholders, investors, and strategists. With a focus on market trends, leading players, and future projections, this report provides a 360° view of this multi-million dollar market. The study period covers 2019-2033, with a base year of 2025 and a forecast period spanning 2025-2033. We analyze historical data (2019-2024) to project future growth accurately. The report leverages data to predict a xx million market size by 2033, showcasing significant growth potential.
Tabletop Sweeteners Market Dynamics & Concentration
This section analyzes the competitive landscape of the tabletop sweeteners market, examining market concentration, innovation drivers, regulatory influences, substitute products, end-user trends, and mergers & acquisitions (M&A) activity. The market exhibits a moderately concentrated structure, with the top five players controlling an estimated xx% of the market share in 2025.
- Market Concentration: The top 10 players (including Whole Earth Brands, Heartland Food Products Group, Nutrifood, Cristal Union, Wisdom Natural Brands, Zydus Wellness, Hermes Sweeteners, Saraya, Associated British Foods, Sudzucker AG, and Ajinomoto) hold a combined xx% market share.
- Innovation Drivers: The increasing demand for natural and low-calorie sweeteners is driving significant innovation, with companies focusing on developing new products with enhanced functionalities and improved taste profiles.
- Regulatory Framework: Government regulations regarding sugar content and labeling are influencing product formulation and marketing strategies. Compliance costs have shown a significant impact with xx million incurred in regulatory compliance by 2024.
- Product Substitutes: The rising popularity of alternative sweeteners, such as stevia and monk fruit, is posing a challenge to traditional tabletop sweeteners.
- End-User Trends: Consumers are increasingly seeking healthier and more convenient options, influencing product development and packaging.
- M&A Activities: The industry has witnessed xx M&A deals in the historical period (2019-2024), indicating consolidation and strategic expansion among key players.
Tabletop Sweeteners Industry Trends & Analysis
This section provides a comprehensive analysis of the tabletop sweeteners market, examining market growth drivers, technological disruptions, consumer preferences, and competitive dynamics. The market is projected to witness a Compound Annual Growth Rate (CAGR) of xx% during the forecast period (2025-2033), driven by several key factors. Market penetration of low-calorie options is projected to increase by xx% by 2033. This growth is fueled by several factors including a growing health-conscious population, rising disposable incomes, and changing lifestyle trends. Technological advancements in sweetener production, along with the development of more sophisticated and efficient processing methods, are further boosting market growth. The emergence of novel sweeteners with improved functionalities and flavor profiles is enhancing consumer adoption. This growth, however, faces the pressure of price fluctuations in raw materials and increasing competition from emerging market players. The competitive landscape is characterized by both established players and new entrants, creating a dynamic market with diverse offerings and price points.
Leading Markets & Segments in Tabletop Sweeteners
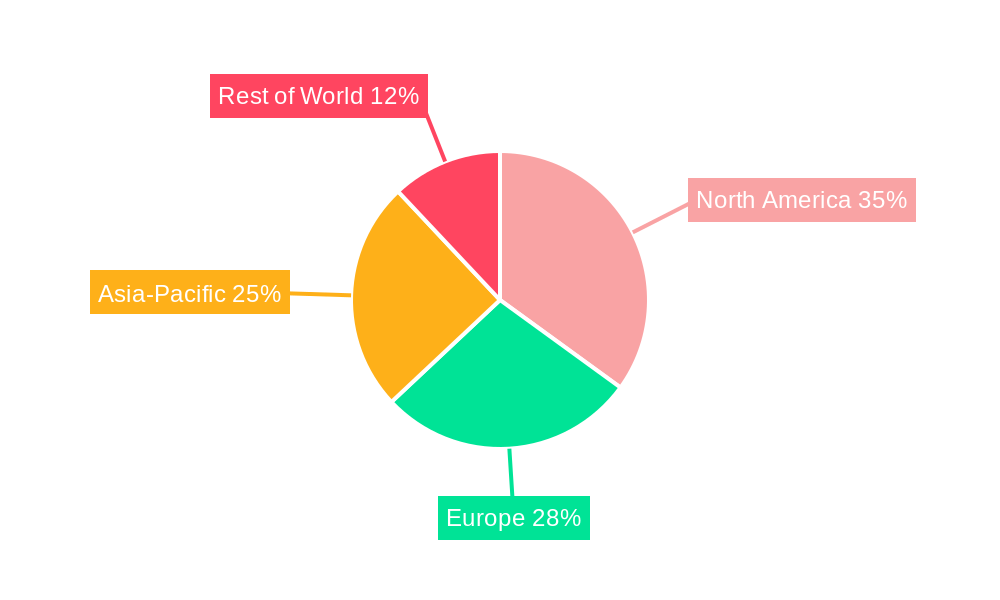
This section identifies the dominant regions, countries, and segments within the tabletop sweeteners market. Based on our analysis, the North American market holds a significant market share, driven by factors such as high consumer spending, developed distribution networks, and strong demand for premium and functional sweeteners.
- Key Drivers in North America:
- High per capita consumption of processed foods and beverages.
- Strong consumer preference for convenience and ready-to-use sweeteners.
- Extensive distribution channels and retail infrastructure.
- Robust research and development efforts in the food and beverage industry.
- Favorable regulatory environment promoting innovation.
The detailed dominance analysis reveals that North America's robust economy, coupled with its advanced infrastructure and strong consumer demand for healthier options, has created a favorable environment for growth in the tabletop sweetener segment. Other significant markets include Europe and Asia-Pacific, exhibiting strong growth potential due to rising disposable incomes and changing dietary habits.
Tabletop Sweeteners Product Developments
Recent years have witnessed significant innovation in tabletop sweeteners, driven by consumer demand for healthier alternatives. This includes the development of new sugar substitutes, such as stevia and erythritol, as well as functional sweeteners with added health benefits. Companies are also focusing on enhancing the taste and texture of these alternatives to match the sensory experience of traditional sugar. These product innovations are creating new market segments and expanding the overall market size. Technological advancements in sweetener production are leading to improved product quality, increased efficiency, and reduced costs.
Key Drivers of Tabletop Sweeteners Growth
The growth of the tabletop sweeteners market is driven by several factors. Firstly, the rising health consciousness among consumers is leading to increased demand for low-calorie and sugar-free options. Secondly, technological advancements in sweetener production are enabling the creation of healthier, tastier, and more affordable alternatives. Finally, changing lifestyles and increased consumption of processed foods and beverages are also contributing to market expansion. These factors, combined with favorable regulatory environments in certain regions, create a fertile ground for growth.
Challenges in the Tabletop Sweeteners Market
Despite its growth potential, the tabletop sweeteners market faces several challenges. Fluctuations in the prices of raw materials, particularly sugar cane and beet, can significantly impact production costs and profitability. Moreover, intense competition among established players and new entrants creates pressure on pricing and margins. Regulatory hurdles concerning the labeling and approval of new sweeteners can also impede market expansion. Supply chain disruptions, especially those caused by global events, have recently impacted the availability of raw materials and increased production costs by xx million in 2024.
Emerging Opportunities in Tabletop Sweeteners
Several emerging opportunities exist for growth in the tabletop sweeteners market. Strategic partnerships between sweetener producers and food and beverage companies can facilitate the wider adoption of novel sweeteners in various products. The development of innovative sweetener formulations with enhanced functionalities, such as those with improved texture or flavor profiles, offers significant market expansion potential. Moreover, tapping into emerging markets with growing populations and rising disposable incomes presents considerable growth opportunities. Expansion into new geographical regions can unlock previously untapped market segments.
Leading Players in the Tabletop Sweeteners Sector
- Whole Earth Brands
- Heartland Food Products Group
- Nutrifood
- Cristal Union
- Wisdom Natural Brands
- Zydus Wellness
- Hermes Sweeteners
- Saraya
- Associated British Foods
- Sudzucker AG
- Ajinomoto
Key Milestones in Tabletop Sweeteners Industry
- 2020: Increased focus on natural sweeteners driven by consumer demand for healthier alternatives.
- 2021: Several new product launches, featuring novel sweeteners and improved formulations.
- 2022: Significant investments in research and development to enhance sweetener technology.
- 2023: Consolidation in the industry through mergers and acquisitions.
- 2024: Growing awareness of the impact of sugar consumption on health, fueling market growth in low-calorie sweeteners.
Strategic Outlook for Tabletop Sweeteners Market
The future of the tabletop sweeteners market looks promising, with continued growth expected in the coming years. Strategic investments in research and development, coupled with innovative product launches and expansion into new markets, will be crucial for success. Companies that can effectively adapt to changing consumer preferences and regulatory environments are likely to gain a competitive advantage. The focus on sustainability and the development of environmentally friendly sweeteners will also be vital for future growth. The market's evolution will depend heavily on consumer health trends, technological innovation, and successful navigation of regulatory changes.
Tabletop Sweeteners Segmentation
-
1. Application
- 1.1. Dining Room
- 1.2. Family
- 1.3. Others
-
2. Type
- 2.1. Natural
- 2.2. Artificial
Tabletop Sweeteners Segmentation By Geography
-
1. North America
- 1.1. United States
- 1.2. Canada
- 1.3. Mexico
-
2. South America
- 2.1. Brazil
- 2.2. Argentina
- 2.3. Rest of South America
-
3. Europe
- 3.1. United Kingdom
- 3.2. Germany
- 3.3. France
- 3.4. Italy
- 3.5. Spain
- 3.6. Russia
- 3.7. Benelux
- 3.8. Nordics
- 3.9. Rest of Europe
-
4. Middle East & Africa
- 4.1. Turkey
- 4.2. Israel
- 4.3. GCC
- 4.4. North Africa
- 4.5. South Africa
- 4.6. Rest of Middle East & Africa
-
5. Asia Pacific
- 5.1. China
- 5.2. India
- 5.3. Japan
- 5.4. South Korea
- 5.5. ASEAN
- 5.6. Oceania
- 5.7. Rest of Asia Pacific
Tabletop Sweeteners Regional Market Share
Geographic Coverage of Tabletop Sweeteners
Tabletop Sweeteners REPORT HIGHLIGHTS
| Aspects | Details |
|---|---|
| Study Period | 2020-2034 |
| Base Year | 2025 |
| Estimated Year | 2026 |
| Forecast Period | 2026-2034 |
| Historical Period | 2020-2025 |
| Growth Rate | CAGR of 13.35% from 2020-2034 |
| Segmentation |
|
Table of Contents
- 1. Introduction
- 1.1. Research Scope
- 1.2. Market Segmentation
- 1.3. Research Methodology
- 1.4. Definitions and Assumptions
- 2. Executive Summary
- 2.1. Introduction
- 3. Market Dynamics
- 3.1. Introduction
- 3.2. Market Drivers
- 3.3. Market Restrains
- 3.4. Market Trends
- 4. Market Factor Analysis
- 4.1. Porters Five Forces
- 4.2. Supply/Value Chain
- 4.3. PESTEL analysis
- 4.4. Market Entropy
- 4.5. Patent/Trademark Analysis
- 5. Global Tabletop Sweeteners Analysis, Insights and Forecast, 2020-2032
- 5.1. Market Analysis, Insights and Forecast - by Application
- 5.1.1. Dining Room
- 5.1.2. Family
- 5.1.3. Others
- 5.2. Market Analysis, Insights and Forecast - by Type
- 5.2.1. Natural
- 5.2.2. Artificial
- 5.3. Market Analysis, Insights and Forecast - by Region
- 5.3.1. North America
- 5.3.2. South America
- 5.3.3. Europe
- 5.3.4. Middle East & Africa
- 5.3.5. Asia Pacific
- 5.1. Market Analysis, Insights and Forecast - by Application
- 6. North America Tabletop Sweeteners Analysis, Insights and Forecast, 2020-2032
- 6.1. Market Analysis, Insights and Forecast - by Application
- 6.1.1. Dining Room
- 6.1.2. Family
- 6.1.3. Others
- 6.2. Market Analysis, Insights and Forecast - by Type
- 6.2.1. Natural
- 6.2.2. Artificial
- 6.1. Market Analysis, Insights and Forecast - by Application
- 7. South America Tabletop Sweeteners Analysis, Insights and Forecast, 2020-2032
- 7.1. Market Analysis, Insights and Forecast - by Application
- 7.1.1. Dining Room
- 7.1.2. Family
- 7.1.3. Others
- 7.2. Market Analysis, Insights and Forecast - by Type
- 7.2.1. Natural
- 7.2.2. Artificial
- 7.1. Market Analysis, Insights and Forecast - by Application
- 8. Europe Tabletop Sweeteners Analysis, Insights and Forecast, 2020-2032
- 8.1. Market Analysis, Insights and Forecast - by Application
- 8.1.1. Dining Room
- 8.1.2. Family
- 8.1.3. Others
- 8.2. Market Analysis, Insights and Forecast - by Type
- 8.2.1. Natural
- 8.2.2. Artificial
- 8.1. Market Analysis, Insights and Forecast - by Application
- 9. Middle East & Africa Tabletop Sweeteners Analysis, Insights and Forecast, 2020-2032
- 9.1. Market Analysis, Insights and Forecast - by Application
- 9.1.1. Dining Room
- 9.1.2. Family
- 9.1.3. Others
- 9.2. Market Analysis, Insights and Forecast - by Type
- 9.2.1. Natural
- 9.2.2. Artificial
- 9.1. Market Analysis, Insights and Forecast - by Application
- 10. Asia Pacific Tabletop Sweeteners Analysis, Insights and Forecast, 2020-2032
- 10.1. Market Analysis, Insights and Forecast - by Application
- 10.1.1. Dining Room
- 10.1.2. Family
- 10.1.3. Others
- 10.2. Market Analysis, Insights and Forecast - by Type
- 10.2.1. Natural
- 10.2.2. Artificial
- 10.1. Market Analysis, Insights and Forecast - by Application
- 11. Competitive Analysis
- 11.1. Global Market Share Analysis 2025
- 11.2. Company Profiles
- 11.2.1 Whole Earth Brands
- 11.2.1.1. Overview
- 11.2.1.2. Products
- 11.2.1.3. SWOT Analysis
- 11.2.1.4. Recent Developments
- 11.2.1.5. Financials (Based on Availability)
- 11.2.2 Heartland Food Products Group
- 11.2.2.1. Overview
- 11.2.2.2. Products
- 11.2.2.3. SWOT Analysis
- 11.2.2.4. Recent Developments
- 11.2.2.5. Financials (Based on Availability)
- 11.2.3 Nutrifood
- 11.2.3.1. Overview
- 11.2.3.2. Products
- 11.2.3.3. SWOT Analysis
- 11.2.3.4. Recent Developments
- 11.2.3.5. Financials (Based on Availability)
- 11.2.4 Cristal Union
- 11.2.4.1. Overview
- 11.2.4.2. Products
- 11.2.4.3. SWOT Analysis
- 11.2.4.4. Recent Developments
- 11.2.4.5. Financials (Based on Availability)
- 11.2.5 Wisdom Natural Brands
- 11.2.5.1. Overview
- 11.2.5.2. Products
- 11.2.5.3. SWOT Analysis
- 11.2.5.4. Recent Developments
- 11.2.5.5. Financials (Based on Availability)
- 11.2.6 Zydus Wellness
- 11.2.6.1. Overview
- 11.2.6.2. Products
- 11.2.6.3. SWOT Analysis
- 11.2.6.4. Recent Developments
- 11.2.6.5. Financials (Based on Availability)
- 11.2.7 Hermes Sweeteners
- 11.2.7.1. Overview
- 11.2.7.2. Products
- 11.2.7.3. SWOT Analysis
- 11.2.7.4. Recent Developments
- 11.2.7.5. Financials (Based on Availability)
- 11.2.8 Saraya
- 11.2.8.1. Overview
- 11.2.8.2. Products
- 11.2.8.3. SWOT Analysis
- 11.2.8.4. Recent Developments
- 11.2.8.5. Financials (Based on Availability)
- 11.2.9 Associated British Foods
- 11.2.9.1. Overview
- 11.2.9.2. Products
- 11.2.9.3. SWOT Analysis
- 11.2.9.4. Recent Developments
- 11.2.9.5. Financials (Based on Availability)
- 11.2.10 Sudzucker AG
- 11.2.10.1. Overview
- 11.2.10.2. Products
- 11.2.10.3. SWOT Analysis
- 11.2.10.4. Recent Developments
- 11.2.10.5. Financials (Based on Availability)
- 11.2.11 Ajinomoto
- 11.2.11.1. Overview
- 11.2.11.2. Products
- 11.2.11.3. SWOT Analysis
- 11.2.11.4. Recent Developments
- 11.2.11.5. Financials (Based on Availability)
- 11.2.1 Whole Earth Brands
List of Figures
- Figure 1: Global Tabletop Sweeteners Revenue Breakdown (undefined, %) by Region 2025 & 2033
- Figure 2: Global Tabletop Sweeteners Volume Breakdown (K, %) by Region 2025 & 2033
- Figure 3: North America Tabletop Sweeteners Revenue (undefined), by Application 2025 & 2033
- Figure 4: North America Tabletop Sweeteners Volume (K), by Application 2025 & 2033
- Figure 5: North America Tabletop Sweeteners Revenue Share (%), by Application 2025 & 2033
- Figure 6: North America Tabletop Sweeteners Volume Share (%), by Application 2025 & 2033
- Figure 7: North America Tabletop Sweeteners Revenue (undefined), by Type 2025 & 2033
- Figure 8: North America Tabletop Sweeteners Volume (K), by Type 2025 & 2033
- Figure 9: North America Tabletop Sweeteners Revenue Share (%), by Type 2025 & 2033
- Figure 10: North America Tabletop Sweeteners Volume Share (%), by Type 2025 & 2033
- Figure 11: North America Tabletop Sweeteners Revenue (undefined), by Country 2025 & 2033
- Figure 12: North America Tabletop Sweeteners Volume (K), by Country 2025 & 2033
- Figure 13: North America Tabletop Sweeteners Revenue Share (%), by Country 2025 & 2033
- Figure 14: North America Tabletop Sweeteners Volume Share (%), by Country 2025 & 2033
- Figure 15: South America Tabletop Sweeteners Revenue (undefined), by Application 2025 & 2033
- Figure 16: South America Tabletop Sweeteners Volume (K), by Application 2025 & 2033
- Figure 17: South America Tabletop Sweeteners Revenue Share (%), by Application 2025 & 2033
- Figure 18: South America Tabletop Sweeteners Volume Share (%), by Application 2025 & 2033
- Figure 19: South America Tabletop Sweeteners Revenue (undefined), by Type 2025 & 2033
- Figure 20: South America Tabletop Sweeteners Volume (K), by Type 2025 & 2033
- Figure 21: South America Tabletop Sweeteners Revenue Share (%), by Type 2025 & 2033
- Figure 22: South America Tabletop Sweeteners Volume Share (%), by Type 2025 & 2033
- Figure 23: South America Tabletop Sweeteners Revenue (undefined), by Country 2025 & 2033
- Figure 24: South America Tabletop Sweeteners Volume (K), by Country 2025 & 2033
- Figure 25: South America Tabletop Sweeteners Revenue Share (%), by Country 2025 & 2033
- Figure 26: South America Tabletop Sweeteners Volume Share (%), by Country 2025 & 2033
- Figure 27: Europe Tabletop Sweeteners Revenue (undefined), by Application 2025 & 2033
- Figure 28: Europe Tabletop Sweeteners Volume (K), by Application 2025 & 2033
- Figure 29: Europe Tabletop Sweeteners Revenue Share (%), by Application 2025 & 2033
- Figure 30: Europe Tabletop Sweeteners Volume Share (%), by Application 2025 & 2033
- Figure 31: Europe Tabletop Sweeteners Revenue (undefined), by Type 2025 & 2033
- Figure 32: Europe Tabletop Sweeteners Volume (K), by Type 2025 & 2033
- Figure 33: Europe Tabletop Sweeteners Revenue Share (%), by Type 2025 & 2033
- Figure 34: Europe Tabletop Sweeteners Volume Share (%), by Type 2025 & 2033
- Figure 35: Europe Tabletop Sweeteners Revenue (undefined), by Country 2025 & 2033
- Figure 36: Europe Tabletop Sweeteners Volume (K), by Country 2025 & 2033
- Figure 37: Europe Tabletop Sweeteners Revenue Share (%), by Country 2025 & 2033
- Figure 38: Europe Tabletop Sweeteners Volume Share (%), by Country 2025 & 2033
- Figure 39: Middle East & Africa Tabletop Sweeteners Revenue (undefined), by Application 2025 & 2033
- Figure 40: Middle East & Africa Tabletop Sweeteners Volume (K), by Application 2025 & 2033
- Figure 41: Middle East & Africa Tabletop Sweeteners Revenue Share (%), by Application 2025 & 2033
- Figure 42: Middle East & Africa Tabletop Sweeteners Volume Share (%), by Application 2025 & 2033
- Figure 43: Middle East & Africa Tabletop Sweeteners Revenue (undefined), by Type 2025 & 2033
- Figure 44: Middle East & Africa Tabletop Sweeteners Volume (K), by Type 2025 & 2033
- Figure 45: Middle East & Africa Tabletop Sweeteners Revenue Share (%), by Type 2025 & 2033
- Figure 46: Middle East & Africa Tabletop Sweeteners Volume Share (%), by Type 2025 & 2033
- Figure 47: Middle East & Africa Tabletop Sweeteners Revenue (undefined), by Country 2025 & 2033
- Figure 48: Middle East & Africa Tabletop Sweeteners Volume (K), by Country 2025 & 2033
- Figure 49: Middle East & Africa Tabletop Sweeteners Revenue Share (%), by Country 2025 & 2033
- Figure 50: Middle East & Africa Tabletop Sweeteners Volume Share (%), by Country 2025 & 2033
- Figure 51: Asia Pacific Tabletop Sweeteners Revenue (undefined), by Application 2025 & 2033
- Figure 52: Asia Pacific Tabletop Sweeteners Volume (K), by Application 2025 & 2033
- Figure 53: Asia Pacific Tabletop Sweeteners Revenue Share (%), by Application 2025 & 2033
- Figure 54: Asia Pacific Tabletop Sweeteners Volume Share (%), by Application 2025 & 2033
- Figure 55: Asia Pacific Tabletop Sweeteners Revenue (undefined), by Type 2025 & 2033
- Figure 56: Asia Pacific Tabletop Sweeteners Volume (K), by Type 2025 & 2033
- Figure 57: Asia Pacific Tabletop Sweeteners Revenue Share (%), by Type 2025 & 2033
- Figure 58: Asia Pacific Tabletop Sweeteners Volume Share (%), by Type 2025 & 2033
- Figure 59: Asia Pacific Tabletop Sweeteners Revenue (undefined), by Country 2025 & 2033
- Figure 60: Asia Pacific Tabletop Sweeteners Volume (K), by Country 2025 & 2033
- Figure 61: Asia Pacific Tabletop Sweeteners Revenue Share (%), by Country 2025 & 2033
- Figure 62: Asia Pacific Tabletop Sweeteners Volume Share (%), by Country 2025 & 2033
List of Tables
- Table 1: Global Tabletop Sweeteners Revenue undefined Forecast, by Application 2020 & 2033
- Table 2: Global Tabletop Sweeteners Volume K Forecast, by Application 2020 & 2033
- Table 3: Global Tabletop Sweeteners Revenue undefined Forecast, by Type 2020 & 2033
- Table 4: Global Tabletop Sweeteners Volume K Forecast, by Type 2020 & 2033
- Table 5: Global Tabletop Sweeteners Revenue undefined Forecast, by Region 2020 & 2033
- Table 6: Global Tabletop Sweeteners Volume K Forecast, by Region 2020 & 2033
- Table 7: Global Tabletop Sweeteners Revenue undefined Forecast, by Application 2020 & 2033
- Table 8: Global Tabletop Sweeteners Volume K Forecast, by Application 2020 & 2033
- Table 9: Global Tabletop Sweeteners Revenue undefined Forecast, by Type 2020 & 2033
- Table 10: Global Tabletop Sweeteners Volume K Forecast, by Type 2020 & 2033
- Table 11: Global Tabletop Sweeteners Revenue undefined Forecast, by Country 2020 & 2033
- Table 12: Global Tabletop Sweeteners Volume K Forecast, by Country 2020 & 2033
- Table 13: United States Tabletop Sweeteners Revenue (undefined) Forecast, by Application 2020 & 2033
- Table 14: United States Tabletop Sweeteners Volume (K) Forecast, by Application 2020 & 2033
- Table 15: Canada Tabletop Sweeteners Revenue (undefined) Forecast, by Application 2020 & 2033
- Table 16: Canada Tabletop Sweeteners Volume (K) Forecast, by Application 2020 & 2033
- Table 17: Mexico Tabletop Sweeteners Revenue (undefined) Forecast, by Application 2020 & 2033
- Table 18: Mexico Tabletop Sweeteners Volume (K) Forecast, by Application 2020 & 2033
- Table 19: Global Tabletop Sweeteners Revenue undefined Forecast, by Application 2020 & 2033
- Table 20: Global Tabletop Sweeteners Volume K Forecast, by Application 2020 & 2033
- Table 21: Global Tabletop Sweeteners Revenue undefined Forecast, by Type 2020 & 2033
- Table 22: Global Tabletop Sweeteners Volume K Forecast, by Type 2020 & 2033
- Table 23: Global Tabletop Sweeteners Revenue undefined Forecast, by Country 2020 & 2033
- Table 24: Global Tabletop Sweeteners Volume K Forecast, by Country 2020 & 2033
- Table 25: Brazil Tabletop Sweeteners Revenue (undefined) Forecast, by Application 2020 & 2033
- Table 26: Brazil Tabletop Sweeteners Volume (K) Forecast, by Application 2020 & 2033
- Table 27: Argentina Tabletop Sweeteners Revenue (undefined) Forecast, by Application 2020 & 2033
- Table 28: Argentina Tabletop Sweeteners Volume (K) Forecast, by Application 2020 & 2033
- Table 29: Rest of South America Tabletop Sweeteners Revenue (undefined) Forecast, by Application 2020 & 2033
- Table 30: Rest of South America Tabletop Sweeteners Volume (K) Forecast, by Application 2020 & 2033
- Table 31: Global Tabletop Sweeteners Revenue undefined Forecast, by Application 2020 & 2033
- Table 32: Global Tabletop Sweeteners Volume K Forecast, by Application 2020 & 2033
- Table 33: Global Tabletop Sweeteners Revenue undefined Forecast, by Type 2020 & 2033
- Table 34: Global Tabletop Sweeteners Volume K Forecast, by Type 2020 & 2033
- Table 35: Global Tabletop Sweeteners Revenue undefined Forecast, by Country 2020 & 2033
- Table 36: Global Tabletop Sweeteners Volume K Forecast, by Country 2020 & 2033
- Table 37: United Kingdom Tabletop Sweeteners Revenue (undefined) Forecast, by Application 2020 & 2033
- Table 38: United Kingdom Tabletop Sweeteners Volume (K) Forecast, by Application 2020 & 2033
- Table 39: Germany Tabletop Sweeteners Revenue (undefined) Forecast, by Application 2020 & 2033
- Table 40: Germany Tabletop Sweeteners Volume (K) Forecast, by Application 2020 & 2033
- Table 41: France Tabletop Sweeteners Revenue (undefined) Forecast, by Application 2020 & 2033
- Table 42: France Tabletop Sweeteners Volume (K) Forecast, by Application 2020 & 2033
- Table 43: Italy Tabletop Sweeteners Revenue (undefined) Forecast, by Application 2020 & 2033
- Table 44: Italy Tabletop Sweeteners Volume (K) Forecast, by Application 2020 & 2033
- Table 45: Spain Tabletop Sweeteners Revenue (undefined) Forecast, by Application 2020 & 2033
- Table 46: Spain Tabletop Sweeteners Volume (K) Forecast, by Application 2020 & 2033
- Table 47: Russia Tabletop Sweeteners Revenue (undefined) Forecast, by Application 2020 & 2033
- Table 48: Russia Tabletop Sweeteners Volume (K) Forecast, by Application 2020 & 2033
- Table 49: Benelux Tabletop Sweeteners Revenue (undefined) Forecast, by Application 2020 & 2033
- Table 50: Benelux Tabletop Sweeteners Volume (K) Forecast, by Application 2020 & 2033
- Table 51: Nordics Tabletop Sweeteners Revenue (undefined) Forecast, by Application 2020 & 2033
- Table 52: Nordics Tabletop Sweeteners Volume (K) Forecast, by Application 2020 & 2033
- Table 53: Rest of Europe Tabletop Sweeteners Revenue (undefined) Forecast, by Application 2020 & 2033
- Table 54: Rest of Europe Tabletop Sweeteners Volume (K) Forecast, by Application 2020 & 2033
- Table 55: Global Tabletop Sweeteners Revenue undefined Forecast, by Application 2020 & 2033
- Table 56: Global Tabletop Sweeteners Volume K Forecast, by Application 2020 & 2033
- Table 57: Global Tabletop Sweeteners Revenue undefined Forecast, by Type 2020 & 2033
- Table 58: Global Tabletop Sweeteners Volume K Forecast, by Type 2020 & 2033
- Table 59: Global Tabletop Sweeteners Revenue undefined Forecast, by Country 2020 & 2033
- Table 60: Global Tabletop Sweeteners Volume K Forecast, by Country 2020 & 2033
- Table 61: Turkey Tabletop Sweeteners Revenue (undefined) Forecast, by Application 2020 & 2033
- Table 62: Turkey Tabletop Sweeteners Volume (K) Forecast, by Application 2020 & 2033
- Table 63: Israel Tabletop Sweeteners Revenue (undefined) Forecast, by Application 2020 & 2033
- Table 64: Israel Tabletop Sweeteners Volume (K) Forecast, by Application 2020 & 2033
- Table 65: GCC Tabletop Sweeteners Revenue (undefined) Forecast, by Application 2020 & 2033
- Table 66: GCC Tabletop Sweeteners Volume (K) Forecast, by Application 2020 & 2033
- Table 67: North Africa Tabletop Sweeteners Revenue (undefined) Forecast, by Application 2020 & 2033
- Table 68: North Africa Tabletop Sweeteners Volume (K) Forecast, by Application 2020 & 2033
- Table 69: South Africa Tabletop Sweeteners Revenue (undefined) Forecast, by Application 2020 & 2033
- Table 70: South Africa Tabletop Sweeteners Volume (K) Forecast, by Application 2020 & 2033
- Table 71: Rest of Middle East & Africa Tabletop Sweeteners Revenue (undefined) Forecast, by Application 2020 & 2033
- Table 72: Rest of Middle East & Africa Tabletop Sweeteners Volume (K) Forecast, by Application 2020 & 2033
- Table 73: Global Tabletop Sweeteners Revenue undefined Forecast, by Application 2020 & 2033
- Table 74: Global Tabletop Sweeteners Volume K Forecast, by Application 2020 & 2033
- Table 75: Global Tabletop Sweeteners Revenue undefined Forecast, by Type 2020 & 2033
- Table 76: Global Tabletop Sweeteners Volume K Forecast, by Type 2020 & 2033
- Table 77: Global Tabletop Sweeteners Revenue undefined Forecast, by Country 2020 & 2033
- Table 78: Global Tabletop Sweeteners Volume K Forecast, by Country 2020 & 2033
- Table 79: China Tabletop Sweeteners Revenue (undefined) Forecast, by Application 2020 & 2033
- Table 80: China Tabletop Sweeteners Volume (K) Forecast, by Application 2020 & 2033
- Table 81: India Tabletop Sweeteners Revenue (undefined) Forecast, by Application 2020 & 2033
- Table 82: India Tabletop Sweeteners Volume (K) Forecast, by Application 2020 & 2033
- Table 83: Japan Tabletop Sweeteners Revenue (undefined) Forecast, by Application 2020 & 2033
- Table 84: Japan Tabletop Sweeteners Volume (K) Forecast, by Application 2020 & 2033
- Table 85: South Korea Tabletop Sweeteners Revenue (undefined) Forecast, by Application 2020 & 2033
- Table 86: South Korea Tabletop Sweeteners Volume (K) Forecast, by Application 2020 & 2033
- Table 87: ASEAN Tabletop Sweeteners Revenue (undefined) Forecast, by Application 2020 & 2033
- Table 88: ASEAN Tabletop Sweeteners Volume (K) Forecast, by Application 2020 & 2033
- Table 89: Oceania Tabletop Sweeteners Revenue (undefined) Forecast, by Application 2020 & 2033
- Table 90: Oceania Tabletop Sweeteners Volume (K) Forecast, by Application 2020 & 2033
- Table 91: Rest of Asia Pacific Tabletop Sweeteners Revenue (undefined) Forecast, by Application 2020 & 2033
- Table 92: Rest of Asia Pacific Tabletop Sweeteners Volume (K) Forecast, by Application 2020 & 2033
Frequently Asked Questions
1. What is the projected Compound Annual Growth Rate (CAGR) of the Tabletop Sweeteners?
The projected CAGR is approximately 13.35%.
2. Which companies are prominent players in the Tabletop Sweeteners?
Key companies in the market include Whole Earth Brands, Heartland Food Products Group, Nutrifood, Cristal Union, Wisdom Natural Brands, Zydus Wellness, Hermes Sweeteners, Saraya, Associated British Foods, Sudzucker AG, Ajinomoto.
3. What are the main segments of the Tabletop Sweeteners?
The market segments include Application, Type.
4. Can you provide details about the market size?
The market size is estimated to be USD XXX N/A as of 2022.
5. What are some drivers contributing to market growth?
N/A
6. What are the notable trends driving market growth?
N/A
7. Are there any restraints impacting market growth?
N/A
8. Can you provide examples of recent developments in the market?
N/A
9. What pricing options are available for accessing the report?
Pricing options include single-user, multi-user, and enterprise licenses priced at USD 3950.00, USD 5925.00, and USD 7900.00 respectively.
10. Is the market size provided in terms of value or volume?
The market size is provided in terms of value, measured in N/A and volume, measured in K.
11. Are there any specific market keywords associated with the report?
Yes, the market keyword associated with the report is "Tabletop Sweeteners," which aids in identifying and referencing the specific market segment covered.
12. How do I determine which pricing option suits my needs best?
The pricing options vary based on user requirements and access needs. Individual users may opt for single-user licenses, while businesses requiring broader access may choose multi-user or enterprise licenses for cost-effective access to the report.
13. Are there any additional resources or data provided in the Tabletop Sweeteners report?
While the report offers comprehensive insights, it's advisable to review the specific contents or supplementary materials provided to ascertain if additional resources or data are available.
14. How can I stay updated on further developments or reports in the Tabletop Sweeteners?
To stay informed about further developments, trends, and reports in the Tabletop Sweeteners, consider subscribing to industry newsletters, following relevant companies and organizations, or regularly checking reputable industry news sources and publications.
Methodology
Step 1 - Identification of Relevant Samples Size from Population Database


Step 2 - Approaches for Defining Global Market Size (Value, Volume* & Price*)

Note*: In applicable scenarios
Step 3 - Data Sources
Primary Research
- Web Analytics
- Survey Reports
- Research Institute
- Latest Research Reports
- Opinion Leaders
Secondary Research
- Annual Reports
- White Paper
- Latest Press Release
- Industry Association
- Paid Database
- Investor Presentations

Step 4 - Data Triangulation
Involves using different sources of information in order to increase the validity of a study
These sources are likely to be stakeholders in a program - participants, other researchers, program staff, other community members, and so on.
Then we put all data in single framework & apply various statistical tools to find out the dynamic on the market.
During the analysis stage, feedback from the stakeholder groups would be compared to determine areas of agreement as well as areas of divergence