

Key Insights
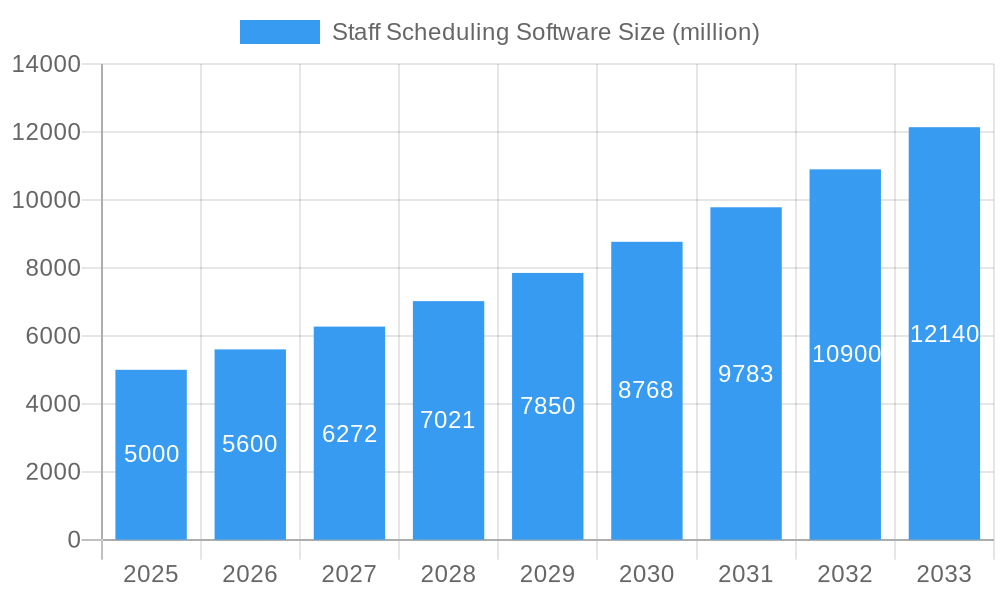
The staff scheduling software market is experiencing robust growth, driven by the increasing need for efficient workforce management across various industries. The rising adoption of cloud-based solutions, coupled with the integration of advanced features like AI-powered optimization and real-time tracking, is significantly boosting market expansion. Businesses are increasingly recognizing the value proposition of streamlined scheduling, leading to reduced labor costs, improved employee satisfaction, and enhanced operational efficiency. This market is segmented by deployment (cloud, on-premise), organization size (small, medium, large), industry (healthcare, hospitality, retail, etc.), and functionality (time-off management, shift swapping, communication tools). Competition is fierce, with established players like Ultimate Software and emerging companies like Calendly vying for market share. The market's growth trajectory is fueled by the ongoing digital transformation across sectors and the need for businesses to optimize their human capital effectively. We estimate the market size to be approximately $5 billion in 2025, growing at a compound annual growth rate (CAGR) of 12% over the forecast period (2025-2033). This growth is despite some restraints such as the initial investment costs associated with implementing new software and the potential for integration challenges with existing systems.
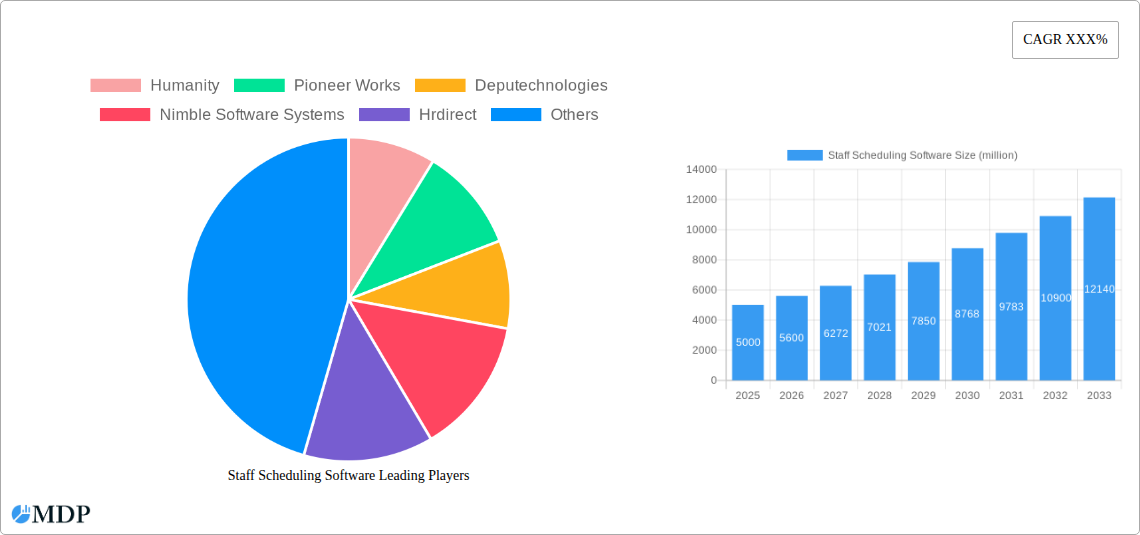
Staff Scheduling Software Market Size (In Billion)
The continued focus on improving employee engagement and reducing administrative overhead will propel the market forward. The integration of advanced analytics and reporting capabilities within staff scheduling software is enhancing decision-making related to workforce planning and resource allocation. Furthermore, the increasing adoption of mobile-friendly interfaces is making it easier for employees to manage their schedules and communicate with managers. The competitive landscape necessitates continuous innovation in features, pricing models, and customer support. Companies are focusing on providing customized solutions tailored to specific industry requirements to gain a competitive edge. The market is expected to see further consolidation in the coming years as larger players acquire smaller companies to expand their product portfolios and market reach. This dynamic environment presents both opportunities and challenges for businesses operating within this evolving landscape.
Staff Scheduling Software Company Market Share
Staff Scheduling Software Market Report: 2019-2033 - A Comprehensive Analysis of a Multi-Billion Dollar Industry
This in-depth report provides a comprehensive analysis of the global Staff Scheduling Software market, projecting a market value exceeding $XX billion by 2033. The study period covers 2019-2033, with 2025 as the base and estimated year. The forecast period spans 2025-2033, building upon historical data from 2019-2024. This report is crucial for industry stakeholders, investors, and businesses seeking to understand this rapidly evolving market. Key players analyzed include Humanity, Pioneer Works, Deputechnologies, Nimble Software Systems, Hrdirect, TimeForge Scheduling, WhenToWork, TimeCurve, Workforce, Planday, Zip Schedules, Ultimate Software, Atlas Business Solutions, Acuity Scheduling, ReachLocal, Resource Guru, Appointy, Shiftboard, SetMore, MyTime, Calendly, Simplybook.me, Bobclass, Shortcuts Software, and Amobius Group.
Staff Scheduling Software Market Dynamics & Concentration
The global staff scheduling software market is experiencing significant growth, driven by increasing adoption across diverse industries. Market concentration is moderately high, with a few major players holding substantial market share, estimated at approximately xx% in 2025. However, numerous smaller players are also present, contributing to a competitive landscape. Innovation is a key driver, with continuous improvements in features like AI-powered optimization, mobile accessibility, and integration with other HR and payroll systems. Regulatory frameworks, particularly around data privacy and security, influence market dynamics. Substitutes include manual scheduling methods, but their limitations are increasingly evident in larger organizations. End-user trends point towards a preference for cloud-based solutions offering scalability and accessibility. M&A activity within the sector remains relatively active, with an estimated xx deals in the last five years, fostering consolidation and market expansion.
- Market Share: Top 5 players hold approximately xx% of the market in 2025.
- M&A Deals (2020-2024): Approximately xx deals, primarily focused on consolidating smaller players.
- Innovation Drivers: AI-powered optimization, mobile accessibility, enhanced integrations.
- Regulatory Factors: Compliance with GDPR, CCPA, and other data privacy regulations.
Staff Scheduling Software Industry Trends & Analysis
The staff scheduling software market exhibits a robust Compound Annual Growth Rate (CAGR) of xx% during the forecast period (2025-2033). This growth is fueled by several key factors. Technological disruptions, particularly the rise of cloud computing and mobile technologies, have significantly enhanced the functionality and accessibility of these solutions. Consumer preferences are shifting towards user-friendly interfaces and intuitive features, encouraging greater adoption. The competitive dynamics are shaping the market with continuous innovation and strategic partnerships. Market penetration is growing rapidly, particularly within the SME and large enterprise segments. Further growth is expected due to the increasing demand for efficient workforce management, coupled with advancements in AI and machine learning capabilities within these platforms.
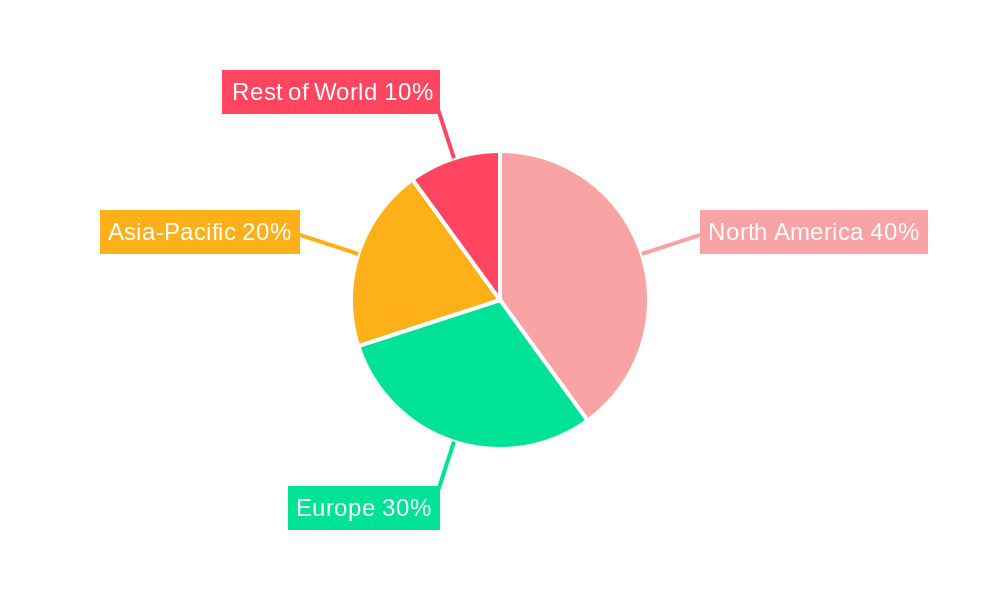
Leading Markets & Segments in Staff Scheduling Software
The North American market currently holds the largest share of the global staff scheduling software market, accounting for approximately xx% in 2025. This dominance is driven by factors such as:
- High Technological Adoption: Advanced infrastructure supports widespread cloud adoption and digital transformation initiatives.
- Strong Economic Growth: Provides financial resources for businesses to invest in productivity-enhancing software.
- Regulatory Environment: Favors innovation and technological advancement while maintaining robust data protection standards.
Other regions, such as Europe and Asia-Pacific, are also showing significant growth potential due to increasing digitization efforts and the growing need for streamlined workforce management. The healthcare and hospitality sectors are major contributors to market revenue, followed by retail and manufacturing industries.
Staff Scheduling Software Product Developments
Recent product developments focus on integrating AI and machine learning algorithms to optimize staff scheduling, predict staffing needs, and minimize labor costs. These advanced solutions improve workforce efficiency and reduce administrative overhead. Seamless integration with existing HR systems, payroll software, and communication platforms is also a key focus, offering streamlined workforce management workflows. The market is evolving towards more sophisticated solutions, offering improved forecasting capabilities, real-time monitoring, and flexible scheduling options, meeting diverse business needs and enhancing user experience.
Key Drivers of Staff Scheduling Software Growth
Technological advancements, such as cloud computing, mobile accessibility, and AI-powered optimization, are paramount in driving market growth. Economic factors, such as reduced labor costs and increased productivity, further incentivize adoption. Moreover, favorable regulatory environments, promoting digital transformation and data security, play a critical role. For example, government initiatives promoting digitalization in various sectors fuel the adoption of staff scheduling software.
Challenges in the Staff Scheduling Software Market
High initial investment costs, particularly for larger organizations integrating complex systems, can pose a challenge. The increasing complexity of data privacy regulations necessitates robust security measures and compliance, adding to operational costs. Intense competition among established players and new entrants puts pressure on pricing and necessitates continuous innovation to retain market share. This competitive pressure, coupled with data security considerations, represents an ongoing challenge. Integration difficulties with legacy systems within some organizations can also hinder wider adoption.
Emerging Opportunities in Staff Scheduling Software
The integration of advanced analytics and predictive modeling capabilities presents exciting opportunities for improving workforce optimization and reducing labor costs. Strategic partnerships between staff scheduling software providers and other HR technology companies will facilitate seamless integration and comprehensive workforce management solutions. Market expansion into emerging economies with rapidly growing workforce numbers will drive significant future growth.
Leading Players in the Staff Scheduling Software Sector
- Humanity
- Pioneer Works (Note: This may not be the correct link, further research is needed)
- Deputechnologies
- Nimble Software Systems
- Hrdirect
- TimeForge Scheduling
- WhenToWork
- TimeCurve
- Workforce
- Planday
- Zip Schedules
- Ultimate Software
- Atlas Business Solutions
- Acuity Scheduling
- ReachLocal
- Resource Guru
- Appointy
- Shiftboard
- SetMore
- MyTime
- Calendly
- Simplybook.me
- Bobclass
- Shortcuts Software
- Amobius Group
Key Milestones in Staff Scheduling Software Industry
- 2020: Increased adoption of cloud-based solutions due to remote work mandates.
- 2021: Significant investments in AI-powered features by major players.
- 2022: Several mergers and acquisitions consolidate market share.
- 2023: Enhanced integration with payroll and HR systems becomes prevalent.
- 2024: Focus shifts towards improving user experience and mobile accessibility.
Strategic Outlook for Staff Scheduling Software Market
The staff scheduling software market is poised for continued strong growth, driven by technological innovation, increasing demand for efficient workforce management, and expansion into new market segments. Strategic partnerships and acquisitions will reshape the competitive landscape, while a focus on enhancing user experience and integrating advanced analytics will be key to success. The market’s future potential remains significant, promising substantial returns for innovative players and substantial improvements in workforce efficiency across various sectors.
Staff Scheduling Software Segmentation
-
1. Application
- 1.1. Small Business
- 1.2. Midsize Enterprise
- 1.3. Large Enterprise
- 1.4. Other
-
2. Type
- 2.1. Cloud-based
- 2.2. On-premises
Staff Scheduling Software Segmentation By Geography
-
1. North America
- 1.1. United States
- 1.2. Canada
- 1.3. Mexico
-
2. South America
- 2.1. Brazil
- 2.2. Argentina
- 2.3. Rest of South America
-
3. Europe
- 3.1. United Kingdom
- 3.2. Germany
- 3.3. France
- 3.4. Italy
- 3.5. Spain
- 3.6. Russia
- 3.7. Benelux
- 3.8. Nordics
- 3.9. Rest of Europe
-
4. Middle East & Africa
- 4.1. Turkey
- 4.2. Israel
- 4.3. GCC
- 4.4. North Africa
- 4.5. South Africa
- 4.6. Rest of Middle East & Africa
-
5. Asia Pacific
- 5.1. China
- 5.2. India
- 5.3. Japan
- 5.4. South Korea
- 5.5. ASEAN
- 5.6. Oceania
- 5.7. Rest of Asia Pacific
Staff Scheduling Software Regional Market Share
Geographic Coverage of Staff Scheduling Software
Staff Scheduling Software REPORT HIGHLIGHTS
| Aspects | Details |
|---|---|
| Study Period | 2020-2034 |
| Base Year | 2025 |
| Estimated Year | 2026 |
| Forecast Period | 2026-2034 |
| Historical Period | 2020-2025 |
| Growth Rate | CAGR of 12.1% from 2020-2034 |
| Segmentation |
|
Table of Contents
- 1. Introduction
- 1.1. Research Scope
- 1.2. Market Segmentation
- 1.3. Research Objective
- 1.4. Definitions and Assumptions
- 2. Executive Summary
- 2.1. Market Snapshot
- 3. Market Dynamics
- 3.1. Market Drivers
- 3.2. Market Restrains
- 3.3. Market Trends
- 3.4. Market Opportunities
- 4. Market Factor Analysis
- 4.1. Porters Five Forces
- 4.1.1. Bargaining Power of Suppliers
- 4.1.2. Bargaining Power of Buyers
- 4.1.3. Threat of New Entrants
- 4.1.4. Threat of Substitutes
- 4.1.5. Competitive Rivalry
- 4.2. PESTEL analysis
- 4.3. BCG Analysis
- 4.3.1. Stars (High Growth, High Market Share)
- 4.3.2. Cash Cows (Low Growth, High Market Share)
- 4.3.3. Question Mark (High Growth, Low Market Share)
- 4.3.4. Dogs (Low Growth, Low Market Share)
- 4.4. Ansoff Matrix Analysis
- 4.5. Supply Chain Analysis
- 4.6. Regulatory Landscape
- 4.7. Current Market Potential and Opportunity Assessment (TAM–SAM–SOM Framework)
- 4.8. MDP Analyst Note
- 4.1. Porters Five Forces
- 5. Market Analysis, Insights and Forecast 2021-2033
- 5.1. Market Analysis, Insights and Forecast - by Application
- 5.1.1. Small Business
- 5.1.2. Midsize Enterprise
- 5.1.3. Large Enterprise
- 5.1.4. Other
- 5.2. Market Analysis, Insights and Forecast - by Type
- 5.2.1. Cloud-based
- 5.2.2. On-premises
- 5.3. Market Analysis, Insights and Forecast - by Region
- 5.3.1. North America
- 5.3.2. South America
- 5.3.3. Europe
- 5.3.4. Middle East & Africa
- 5.3.5. Asia Pacific
- 5.1. Market Analysis, Insights and Forecast - by Application
- 6. Global Staff Scheduling Software Analysis, Insights and Forecast, 2021-2033
- 6.1. Market Analysis, Insights and Forecast - by Application
- 6.1.1. Small Business
- 6.1.2. Midsize Enterprise
- 6.1.3. Large Enterprise
- 6.1.4. Other
- 6.2. Market Analysis, Insights and Forecast - by Type
- 6.2.1. Cloud-based
- 6.2.2. On-premises
- 6.1. Market Analysis, Insights and Forecast - by Application
- 7. North America Staff Scheduling Software Analysis, Insights and Forecast, 2020-2032
- 7.1. Market Analysis, Insights and Forecast - by Application
- 7.1.1. Small Business
- 7.1.2. Midsize Enterprise
- 7.1.3. Large Enterprise
- 7.1.4. Other
- 7.2. Market Analysis, Insights and Forecast - by Type
- 7.2.1. Cloud-based
- 7.2.2. On-premises
- 7.1. Market Analysis, Insights and Forecast - by Application
- 8. South America Staff Scheduling Software Analysis, Insights and Forecast, 2020-2032
- 8.1. Market Analysis, Insights and Forecast - by Application
- 8.1.1. Small Business
- 8.1.2. Midsize Enterprise
- 8.1.3. Large Enterprise
- 8.1.4. Other
- 8.2. Market Analysis, Insights and Forecast - by Type
- 8.2.1. Cloud-based
- 8.2.2. On-premises
- 8.1. Market Analysis, Insights and Forecast - by Application
- 9. Europe Staff Scheduling Software Analysis, Insights and Forecast, 2020-2032
- 9.1. Market Analysis, Insights and Forecast - by Application
- 9.1.1. Small Business
- 9.1.2. Midsize Enterprise
- 9.1.3. Large Enterprise
- 9.1.4. Other
- 9.2. Market Analysis, Insights and Forecast - by Type
- 9.2.1. Cloud-based
- 9.2.2. On-premises
- 9.1. Market Analysis, Insights and Forecast - by Application
- 10. Middle East & Africa Staff Scheduling Software Analysis, Insights and Forecast, 2020-2032
- 10.1. Market Analysis, Insights and Forecast - by Application
- 10.1.1. Small Business
- 10.1.2. Midsize Enterprise
- 10.1.3. Large Enterprise
- 10.1.4. Other
- 10.2. Market Analysis, Insights and Forecast - by Type
- 10.2.1. Cloud-based
- 10.2.2. On-premises
- 10.1. Market Analysis, Insights and Forecast - by Application
- 11. Asia Pacific Staff Scheduling Software Analysis, Insights and Forecast, 2020-2032
- 11.1. Market Analysis, Insights and Forecast - by Application
- 11.1.1. Small Business
- 11.1.2. Midsize Enterprise
- 11.1.3. Large Enterprise
- 11.1.4. Other
- 11.2. Market Analysis, Insights and Forecast - by Type
- 11.2.1. Cloud-based
- 11.2.2. On-premises
- 11.1. Market Analysis, Insights and Forecast - by Application
- 12. Competitive Analysis
- 12.1. Company Profiles
- 12.1.1 Humanity
- 12.1.1.1. Company Overview
- 12.1.1.2. Products
- 12.1.1.3. Company Financials
- 12.1.1.4. SWOT Analysis
- 12.1.2 Pioneer Works
- 12.1.2.1. Company Overview
- 12.1.2.2. Products
- 12.1.2.3. Company Financials
- 12.1.2.4. SWOT Analysis
- 12.1.3 Deputechnologies
- 12.1.3.1. Company Overview
- 12.1.3.2. Products
- 12.1.3.3. Company Financials
- 12.1.3.4. SWOT Analysis
- 12.1.4 Nimble Software Systems
- 12.1.4.1. Company Overview
- 12.1.4.2. Products
- 12.1.4.3. Company Financials
- 12.1.4.4. SWOT Analysis
- 12.1.5 Hrdirect
- 12.1.5.1. Company Overview
- 12.1.5.2. Products
- 12.1.5.3. Company Financials
- 12.1.5.4. SWOT Analysis
- 12.1.6 TimeForge Scheduling
- 12.1.6.1. Company Overview
- 12.1.6.2. Products
- 12.1.6.3. Company Financials
- 12.1.6.4. SWOT Analysis
- 12.1.7 WhenToWork
- 12.1.7.1. Company Overview
- 12.1.7.2. Products
- 12.1.7.3. Company Financials
- 12.1.7.4. SWOT Analysis
- 12.1.8 TimeCurve
- 12.1.8.1. Company Overview
- 12.1.8.2. Products
- 12.1.8.3. Company Financials
- 12.1.8.4. SWOT Analysis
- 12.1.9 Workforce
- 12.1.9.1. Company Overview
- 12.1.9.2. Products
- 12.1.9.3. Company Financials
- 12.1.9.4. SWOT Analysis
- 12.1.10 Planday
- 12.1.10.1. Company Overview
- 12.1.10.2. Products
- 12.1.10.3. Company Financials
- 12.1.10.4. SWOT Analysis
- 12.1.11 Zip Schedules
- 12.1.11.1. Company Overview
- 12.1.11.2. Products
- 12.1.11.3. Company Financials
- 12.1.11.4. SWOT Analysis
- 12.1.12 Ultimate Software
- 12.1.12.1. Company Overview
- 12.1.12.2. Products
- 12.1.12.3. Company Financials
- 12.1.12.4. SWOT Analysis
- 12.1.13 Atlas Business Solutions
- 12.1.13.1. Company Overview
- 12.1.13.2. Products
- 12.1.13.3. Company Financials
- 12.1.13.4. SWOT Analysis
- 12.1.14 Acuity Scheduling
- 12.1.14.1. Company Overview
- 12.1.14.2. Products
- 12.1.14.3. Company Financials
- 12.1.14.4. SWOT Analysis
- 12.1.15 ReachLocal
- 12.1.15.1. Company Overview
- 12.1.15.2. Products
- 12.1.15.3. Company Financials
- 12.1.15.4. SWOT Analysis
- 12.1.16 Resource Guru
- 12.1.16.1. Company Overview
- 12.1.16.2. Products
- 12.1.16.3. Company Financials
- 12.1.16.4. SWOT Analysis
- 12.1.17 Appointy
- 12.1.17.1. Company Overview
- 12.1.17.2. Products
- 12.1.17.3. Company Financials
- 12.1.17.4. SWOT Analysis
- 12.1.18 Shiftboard
- 12.1.18.1. Company Overview
- 12.1.18.2. Products
- 12.1.18.3. Company Financials
- 12.1.18.4. SWOT Analysis
- 12.1.19 SetMore
- 12.1.19.1. Company Overview
- 12.1.19.2. Products
- 12.1.19.3. Company Financials
- 12.1.19.4. SWOT Analysis
- 12.1.20 MyTime
- 12.1.20.1. Company Overview
- 12.1.20.2. Products
- 12.1.20.3. Company Financials
- 12.1.20.4. SWOT Analysis
- 12.1.21 Calendly
- 12.1.21.1. Company Overview
- 12.1.21.2. Products
- 12.1.21.3. Company Financials
- 12.1.21.4. SWOT Analysis
- 12.1.22 Simplybook.me
- 12.1.22.1. Company Overview
- 12.1.22.2. Products
- 12.1.22.3. Company Financials
- 12.1.22.4. SWOT Analysis
- 12.1.23 Bobclass
- 12.1.23.1. Company Overview
- 12.1.23.2. Products
- 12.1.23.3. Company Financials
- 12.1.23.4. SWOT Analysis
- 12.1.24 Shortcuts Software
- 12.1.24.1. Company Overview
- 12.1.24.2. Products
- 12.1.24.3. Company Financials
- 12.1.24.4. SWOT Analysis
- 12.1.25 Amobius Group
- 12.1.25.1. Company Overview
- 12.1.25.2. Products
- 12.1.25.3. Company Financials
- 12.1.25.4. SWOT Analysis
- 12.1.1 Humanity
- 12.2. Market Entropy
- 12.2.1 Company's Key Areas Served
- 12.2.2 Recent Developments
- 12.3. Company Market Share Analysis 2025
- 12.3.1 Top 5 Companies Market Share Analysis
- 12.3.2 Top 3 Companies Market Share Analysis
- 12.4. List of Potential Customers
- 13. Research Methodology
List of Figures
- Figure 1: Global Staff Scheduling Software Revenue Breakdown (undefined, %) by Region 2025 & 2033
- Figure 2: North America Staff Scheduling Software Revenue (undefined), by Application 2025 & 2033
- Figure 3: North America Staff Scheduling Software Revenue Share (%), by Application 2025 & 2033
- Figure 4: North America Staff Scheduling Software Revenue (undefined), by Type 2025 & 2033
- Figure 5: North America Staff Scheduling Software Revenue Share (%), by Type 2025 & 2033
- Figure 6: North America Staff Scheduling Software Revenue (undefined), by Country 2025 & 2033
- Figure 7: North America Staff Scheduling Software Revenue Share (%), by Country 2025 & 2033
- Figure 8: South America Staff Scheduling Software Revenue (undefined), by Application 2025 & 2033
- Figure 9: South America Staff Scheduling Software Revenue Share (%), by Application 2025 & 2033
- Figure 10: South America Staff Scheduling Software Revenue (undefined), by Type 2025 & 2033
- Figure 11: South America Staff Scheduling Software Revenue Share (%), by Type 2025 & 2033
- Figure 12: South America Staff Scheduling Software Revenue (undefined), by Country 2025 & 2033
- Figure 13: South America Staff Scheduling Software Revenue Share (%), by Country 2025 & 2033
- Figure 14: Europe Staff Scheduling Software Revenue (undefined), by Application 2025 & 2033
- Figure 15: Europe Staff Scheduling Software Revenue Share (%), by Application 2025 & 2033
- Figure 16: Europe Staff Scheduling Software Revenue (undefined), by Type 2025 & 2033
- Figure 17: Europe Staff Scheduling Software Revenue Share (%), by Type 2025 & 2033
- Figure 18: Europe Staff Scheduling Software Revenue (undefined), by Country 2025 & 2033
- Figure 19: Europe Staff Scheduling Software Revenue Share (%), by Country 2025 & 2033
- Figure 20: Middle East & Africa Staff Scheduling Software Revenue (undefined), by Application 2025 & 2033
- Figure 21: Middle East & Africa Staff Scheduling Software Revenue Share (%), by Application 2025 & 2033
- Figure 22: Middle East & Africa Staff Scheduling Software Revenue (undefined), by Type 2025 & 2033
- Figure 23: Middle East & Africa Staff Scheduling Software Revenue Share (%), by Type 2025 & 2033
- Figure 24: Middle East & Africa Staff Scheduling Software Revenue (undefined), by Country 2025 & 2033
- Figure 25: Middle East & Africa Staff Scheduling Software Revenue Share (%), by Country 2025 & 2033
- Figure 26: Asia Pacific Staff Scheduling Software Revenue (undefined), by Application 2025 & 2033
- Figure 27: Asia Pacific Staff Scheduling Software Revenue Share (%), by Application 2025 & 2033
- Figure 28: Asia Pacific Staff Scheduling Software Revenue (undefined), by Type 2025 & 2033
- Figure 29: Asia Pacific Staff Scheduling Software Revenue Share (%), by Type 2025 & 2033
- Figure 30: Asia Pacific Staff Scheduling Software Revenue (undefined), by Country 2025 & 2033
- Figure 31: Asia Pacific Staff Scheduling Software Revenue Share (%), by Country 2025 & 2033
List of Tables
- Table 1: Global Staff Scheduling Software Revenue undefined Forecast, by Application 2020 & 2033
- Table 2: Global Staff Scheduling Software Revenue undefined Forecast, by Type 2020 & 2033
- Table 3: Global Staff Scheduling Software Revenue undefined Forecast, by Region 2020 & 2033
- Table 4: Global Staff Scheduling Software Revenue undefined Forecast, by Application 2020 & 2033
- Table 5: Global Staff Scheduling Software Revenue undefined Forecast, by Type 2020 & 2033
- Table 6: Global Staff Scheduling Software Revenue undefined Forecast, by Country 2020 & 2033
- Table 7: United States Staff Scheduling Software Revenue (undefined) Forecast, by Application 2020 & 2033
- Table 8: Canada Staff Scheduling Software Revenue (undefined) Forecast, by Application 2020 & 2033
- Table 9: Mexico Staff Scheduling Software Revenue (undefined) Forecast, by Application 2020 & 2033
- Table 10: Global Staff Scheduling Software Revenue undefined Forecast, by Application 2020 & 2033
- Table 11: Global Staff Scheduling Software Revenue undefined Forecast, by Type 2020 & 2033
- Table 12: Global Staff Scheduling Software Revenue undefined Forecast, by Country 2020 & 2033
- Table 13: Brazil Staff Scheduling Software Revenue (undefined) Forecast, by Application 2020 & 2033
- Table 14: Argentina Staff Scheduling Software Revenue (undefined) Forecast, by Application 2020 & 2033
- Table 15: Rest of South America Staff Scheduling Software Revenue (undefined) Forecast, by Application 2020 & 2033
- Table 16: Global Staff Scheduling Software Revenue undefined Forecast, by Application 2020 & 2033
- Table 17: Global Staff Scheduling Software Revenue undefined Forecast, by Type 2020 & 2033
- Table 18: Global Staff Scheduling Software Revenue undefined Forecast, by Country 2020 & 2033
- Table 19: United Kingdom Staff Scheduling Software Revenue (undefined) Forecast, by Application 2020 & 2033
- Table 20: Germany Staff Scheduling Software Revenue (undefined) Forecast, by Application 2020 & 2033
- Table 21: France Staff Scheduling Software Revenue (undefined) Forecast, by Application 2020 & 2033
- Table 22: Italy Staff Scheduling Software Revenue (undefined) Forecast, by Application 2020 & 2033
- Table 23: Spain Staff Scheduling Software Revenue (undefined) Forecast, by Application 2020 & 2033
- Table 24: Russia Staff Scheduling Software Revenue (undefined) Forecast, by Application 2020 & 2033
- Table 25: Benelux Staff Scheduling Software Revenue (undefined) Forecast, by Application 2020 & 2033
- Table 26: Nordics Staff Scheduling Software Revenue (undefined) Forecast, by Application 2020 & 2033
- Table 27: Rest of Europe Staff Scheduling Software Revenue (undefined) Forecast, by Application 2020 & 2033
- Table 28: Global Staff Scheduling Software Revenue undefined Forecast, by Application 2020 & 2033
- Table 29: Global Staff Scheduling Software Revenue undefined Forecast, by Type 2020 & 2033
- Table 30: Global Staff Scheduling Software Revenue undefined Forecast, by Country 2020 & 2033
- Table 31: Turkey Staff Scheduling Software Revenue (undefined) Forecast, by Application 2020 & 2033
- Table 32: Israel Staff Scheduling Software Revenue (undefined) Forecast, by Application 2020 & 2033
- Table 33: GCC Staff Scheduling Software Revenue (undefined) Forecast, by Application 2020 & 2033
- Table 34: North Africa Staff Scheduling Software Revenue (undefined) Forecast, by Application 2020 & 2033
- Table 35: South Africa Staff Scheduling Software Revenue (undefined) Forecast, by Application 2020 & 2033
- Table 36: Rest of Middle East & Africa Staff Scheduling Software Revenue (undefined) Forecast, by Application 2020 & 2033
- Table 37: Global Staff Scheduling Software Revenue undefined Forecast, by Application 2020 & 2033
- Table 38: Global Staff Scheduling Software Revenue undefined Forecast, by Type 2020 & 2033
- Table 39: Global Staff Scheduling Software Revenue undefined Forecast, by Country 2020 & 2033
- Table 40: China Staff Scheduling Software Revenue (undefined) Forecast, by Application 2020 & 2033
- Table 41: India Staff Scheduling Software Revenue (undefined) Forecast, by Application 2020 & 2033
- Table 42: Japan Staff Scheduling Software Revenue (undefined) Forecast, by Application 2020 & 2033
- Table 43: South Korea Staff Scheduling Software Revenue (undefined) Forecast, by Application 2020 & 2033
- Table 44: ASEAN Staff Scheduling Software Revenue (undefined) Forecast, by Application 2020 & 2033
- Table 45: Oceania Staff Scheduling Software Revenue (undefined) Forecast, by Application 2020 & 2033
- Table 46: Rest of Asia Pacific Staff Scheduling Software Revenue (undefined) Forecast, by Application 2020 & 2033
Frequently Asked Questions
1. What is the projected Compound Annual Growth Rate (CAGR) of the Staff Scheduling Software?
The projected CAGR is approximately 12.1%.
2. Which companies are prominent players in the Staff Scheduling Software?
Key companies in the market include Humanity, Pioneer Works, Deputechnologies, Nimble Software Systems, Hrdirect, TimeForge Scheduling, WhenToWork, TimeCurve, Workforce, Planday, Zip Schedules, Ultimate Software, Atlas Business Solutions, Acuity Scheduling, ReachLocal, Resource Guru, Appointy, Shiftboard, SetMore, MyTime, Calendly, Simplybook.me, Bobclass, Shortcuts Software, Amobius Group.
3. What are the main segments of the Staff Scheduling Software?
The market segments include Application, Type.
4. Can you provide details about the market size?
The market size is estimated to be USD XXX N/A as of 2022.
5. What are some drivers contributing to market growth?
N/A
6. What are the notable trends driving market growth?
N/A
7. Are there any restraints impacting market growth?
N/A
8. Can you provide examples of recent developments in the market?
N/A
9. What pricing options are available for accessing the report?
Pricing options include single-user, multi-user, and enterprise licenses priced at USD 2900.00, USD 4350.00, and USD 5800.00 respectively.
10. Is the market size provided in terms of value or volume?
The market size is provided in terms of value, measured in N/A.
11. Are there any specific market keywords associated with the report?
Yes, the market keyword associated with the report is "Staff Scheduling Software," which aids in identifying and referencing the specific market segment covered.
12. How do I determine which pricing option suits my needs best?
The pricing options vary based on user requirements and access needs. Individual users may opt for single-user licenses, while businesses requiring broader access may choose multi-user or enterprise licenses for cost-effective access to the report.
13. Are there any additional resources or data provided in the Staff Scheduling Software report?
While the report offers comprehensive insights, it's advisable to review the specific contents or supplementary materials provided to ascertain if additional resources or data are available.
14. How can I stay updated on further developments or reports in the Staff Scheduling Software?
To stay informed about further developments, trends, and reports in the Staff Scheduling Software, consider subscribing to industry newsletters, following relevant companies and organizations, or regularly checking reputable industry news sources and publications.
Methodology
Step 1 - Identification of Relevant Samples Size from Population Database


Step 2 - Approaches for Defining Global Market Size (Value, Volume* & Price*)

Note*: In applicable scenarios
Step 3 - Data Sources
Primary Research
- Web Analytics
- Survey Reports
- Research Institute
- Latest Research Reports
- Opinion Leaders
Secondary Research
- Annual Reports
- White Paper
- Latest Press Release
- Industry Association
- Paid Database
- Investor Presentations

Step 4 - Data Triangulation
Involves using different sources of information in order to increase the validity of a study
These sources are likely to be stakeholders in a program - participants, other researchers, program staff, other community members, and so on.
Then we put all data in single framework & apply various statistical tools to find out the dynamic on the market.
During the analysis stage, feedback from the stakeholder groups would be compared to determine areas of agreement as well as areas of divergence