

Key Insights
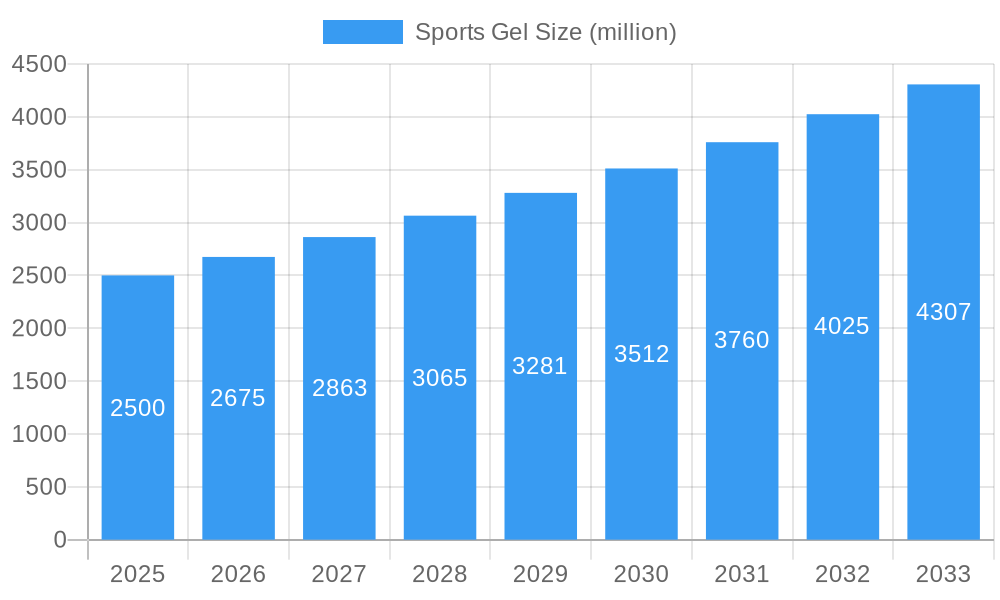
The global sports gel market is experiencing robust growth, driven by the increasing participation in endurance sports like marathons and triathlons, and a rising awareness of the importance of convenient and effective energy supplementation during intense physical activity. The market, estimated at $2.5 billion in 2025, is projected to exhibit a Compound Annual Growth Rate (CAGR) of 7% from 2025 to 2033, reaching approximately $4.2 billion by 2033. Key drivers include the growing popularity of fitness and wellness lifestyles, the proliferation of online retail channels expanding access to these products, and continuous product innovation focusing on improved taste, texture, and functionality (e.g., inclusion of electrolytes and added vitamins). Major players like GU Energy Labs, Clif Bar, and PowerBar dominate the market, leveraging strong brand recognition and extensive distribution networks. However, the emergence of smaller, specialized brands focusing on niche formulations (e.g., plant-based, allergen-free) presents a significant challenge and opportunity for market expansion.
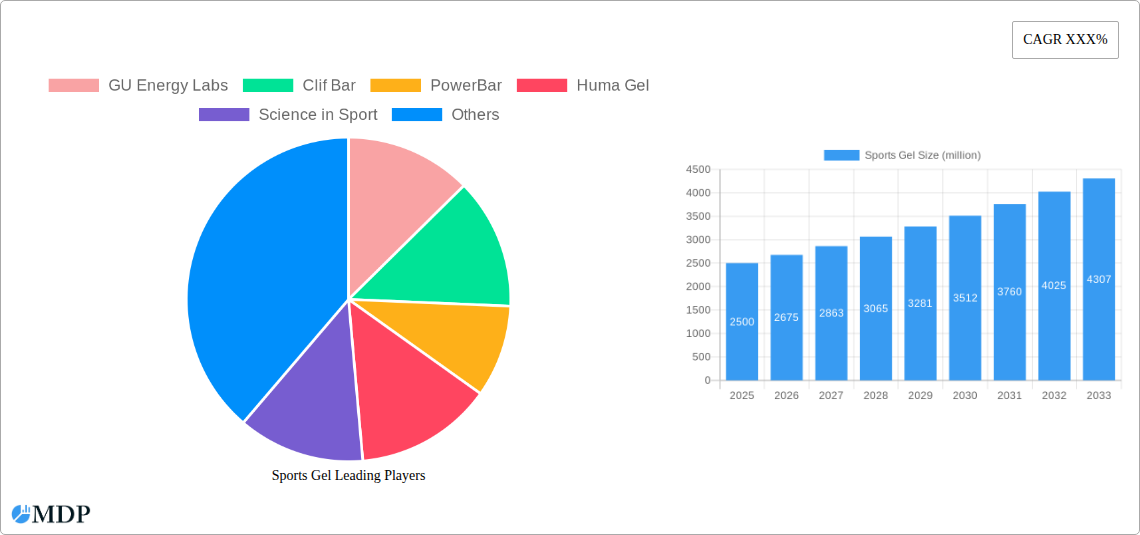
Sports Gel Market Size (In Billion)
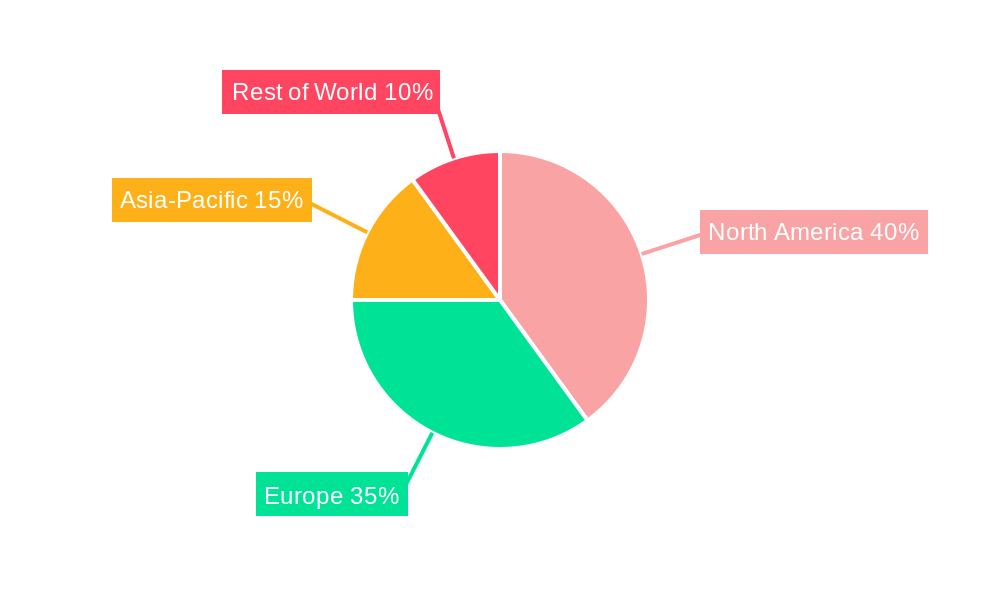
Market restraints include the potential for negative consumer perceptions regarding high sugar content and artificial ingredients in some products. The industry is responding to this by introducing healthier, more natural alternatives, emphasizing clean label ingredients, and highlighting the benefits of key ingredients such as natural carbohydrates and electrolytes. Market segmentation reveals strong demand for gels designed for specific athletic activities (e.g., running, cycling) and for various consumer needs, such as gels tailored to specific dietary restrictions. Geographic analysis shows that North America and Europe currently hold the largest market shares, reflecting higher levels of sports participation and consumer spending in these regions. However, Asia-Pacific is poised for significant growth due to the expanding middle class and increased adoption of Western fitness trends.
Sports Gel Company Market Share
Sports Gel Market Report: A Comprehensive Analysis (2019-2033)
This comprehensive report provides an in-depth analysis of the global sports gel market, projecting a market value exceeding $XX million by 2033. The study covers the period 2019-2033, with a focus on the forecast period 2025-2033, using 2025 as the base and estimated year. This report is essential for industry stakeholders, investors, and anyone seeking a detailed understanding of this dynamic market. It leverages extensive data analysis and expert insights to offer actionable strategies for success.
Sports Gel Market Dynamics & Concentration
The global sports gel market, valued at $XX million in 2025, demonstrates a moderately concentrated landscape. Key players such as GU Energy Labs, Clif Bar, PowerBar, Huma Gel, Science in Sport, Maurten, Hammer Nutrition, ProBar, Tailwind Nutrition, and Spring Energy collectively hold a significant market share, estimated at XX%. However, the presence of several smaller, niche players indicates opportunities for market expansion and increased competition. Innovation is a crucial driver, with companies constantly introducing new formulations focusing on enhanced absorption rates, natural ingredients, and customized nutritional profiles. Regulatory frameworks concerning food safety and labeling vary across regions, impacting product development and market access. The market also faces competition from substitute products, such as energy bars and drinks, leading to the need for continuous product differentiation and marketing strategies. Mergers and acquisitions (M&A) activity in the sector has been moderate in the historical period (2019-2024) with approximately XX deals recorded, largely focused on enhancing product portfolios and expanding market reach. End-user trends reveal a growing preference for natural and organic ingredients, influencing product development.
- Market Concentration: XX% held by top 10 players.
- M&A Activity (2019-2024): Approximately XX deals.
- Key Innovation Drivers: Enhanced absorption, natural ingredients, customized nutrition.
- Regulatory Landscape: Varies across regions, impacting product development and market access.
Sports Gel Industry Trends & Analysis
The sports gel market is experiencing robust growth, driven by several factors. The rising popularity of fitness and endurance sports, coupled with increasing health consciousness among consumers, fuels demand for convenient and effective energy sources. The market exhibited a Compound Annual Growth Rate (CAGR) of XX% during the historical period (2019-2024) and is projected to maintain a CAGR of XX% from 2025 to 2033. Technological advancements, such as improved manufacturing processes and novel ingredient formulations, have further propelled market growth. Consumer preferences are shifting towards natural, organic, and plant-based options, impacting product development. Competitive dynamics are characterized by both intense competition among established players and the emergence of innovative startups, leading to continuous product diversification and aggressive marketing strategies. Market penetration remains relatively high in developed regions but presents significant growth opportunities in emerging markets.
Leading Markets & Segments in Sports Gel
The North American region currently dominates the global sports gel market, representing XX% of the total market value in 2025. This dominance is attributed to several factors.
- Key Drivers in North America:
- High participation rates in endurance sports and fitness activities.
- Strong consumer awareness of health and nutrition.
- Well-established distribution networks.
- Favorable economic conditions.
The detailed dominance analysis reveals that the high disposable incomes, coupled with a strong fitness culture and widespread acceptance of sports nutrition products, contribute significantly to the region's leading position. While other regions, like Europe and Asia-Pacific, are witnessing growth, North America maintains its leading position due to established market penetration and strong consumer demand.
Sports Gel Product Developments
Recent product innovations in the sports gel market focus on enhanced functionality and improved consumer experience. New formulations include the use of advanced carbohydrates for optimized energy delivery, inclusion of electrolytes for hydration, and incorporation of natural flavors and sweeteners to enhance taste and appeal. Technological trends such as improved packaging for longer shelf-life and easy portability are driving innovation, and there's a growing market for gels targeting specific sports and performance goals, such as running, cycling, and triathlon.
Key Drivers of Sports Gel Growth
Several factors drive the growth of the sports gel market. The rising prevalence of health and fitness awareness among consumers is a major catalyst. Technological advancements in formulation and manufacturing lead to higher-quality, more efficient products. The increasing popularity of endurance sports and athletic events further fuels market demand. Government initiatives promoting healthy lifestyles and active participation in sports indirectly support market expansion.
Challenges in the Sports Gel Market
The sports gel market faces several challenges. Fluctuations in raw material prices and supply chain disruptions impact production costs and profitability. Stringent regulatory requirements concerning food safety and labeling add complexity and expense to product development and market entry. Intense competition among established brands and the entry of new players create price pressure and necessitate continuous innovation.
Emerging Opportunities in Sports Gel
Emerging opportunities in the sports gel market include expansion into untapped markets, particularly in developing economies with growing middle-class populations. Strategic partnerships between sports gel manufacturers and fitness brands or athletic organizations can enhance market reach and brand visibility. Technological breakthroughs, such as personalized nutrition strategies based on individual needs and performance goals, unlock new market segments and offer significant growth potential.
Leading Players in the Sports Gel Sector
- GU Energy Labs
- Clif Bar
- PowerBar
- Huma Gel
- Science in Sport
- Maurten
- Hammer Nutrition
- ProBar
- Tailwind Nutrition
- Spring Energy
Key Milestones in Sports Gel Industry
- 2020: Increased focus on plant-based and organic ingredients.
- 2021: Several key players launched gels with enhanced electrolyte profiles.
- 2022: XX – Significant investment in R&D for improved absorption technologies.
- 2023: XX – Introduction of personalized nutrition sports gels.
- 2024: XX – Increased focus on sustainable packaging solutions.
Strategic Outlook for Sports Gel Market
The sports gel market is poised for continued growth, fueled by several key factors. Expanding into new geographical markets and exploring innovative product formats presents substantial opportunities. Strategic partnerships and collaborations with fitness and wellness companies can further strengthen market penetration. Investments in research and development of personalized nutrition products are essential for long-term success. A focus on sustainability and eco-friendly packaging can also enhance brand appeal and cater to growing consumer preferences.
Sports Gel Segmentation
-
1. Application
- 1.1. Professional Game
- 1.2. Amateur Training
- 1.3. Others
-
2. Type
- 2.1. Carbohydrate Gel
- 2.2. Electrolyte Gel
- 2.3. Collagen Gel
- 2.4. Caffeine Gel
- 2.5. Natural Food Gel
Sports Gel Segmentation By Geography
-
1. North America
- 1.1. United States
- 1.2. Canada
- 1.3. Mexico
-
2. South America
- 2.1. Brazil
- 2.2. Argentina
- 2.3. Rest of South America
-
3. Europe
- 3.1. United Kingdom
- 3.2. Germany
- 3.3. France
- 3.4. Italy
- 3.5. Spain
- 3.6. Russia
- 3.7. Benelux
- 3.8. Nordics
- 3.9. Rest of Europe
-
4. Middle East & Africa
- 4.1. Turkey
- 4.2. Israel
- 4.3. GCC
- 4.4. North Africa
- 4.5. South Africa
- 4.6. Rest of Middle East & Africa
-
5. Asia Pacific
- 5.1. China
- 5.2. India
- 5.3. Japan
- 5.4. South Korea
- 5.5. ASEAN
- 5.6. Oceania
- 5.7. Rest of Asia Pacific
Sports Gel Regional Market Share
Geographic Coverage of Sports Gel
Sports Gel REPORT HIGHLIGHTS
| Aspects | Details |
|---|---|
| Study Period | 2020-2034 |
| Base Year | 2025 |
| Estimated Year | 2026 |
| Forecast Period | 2026-2034 |
| Historical Period | 2020-2025 |
| Growth Rate | CAGR of 7.6% from 2020-2034 |
| Segmentation |
|
Table of Contents
- 1. Introduction
- 1.1. Research Scope
- 1.2. Market Segmentation
- 1.3. Research Methodology
- 1.4. Definitions and Assumptions
- 2. Executive Summary
- 2.1. Introduction
- 3. Market Dynamics
- 3.1. Introduction
- 3.2. Market Drivers
- 3.3. Market Restrains
- 3.4. Market Trends
- 4. Market Factor Analysis
- 4.1. Porters Five Forces
- 4.2. Supply/Value Chain
- 4.3. PESTEL analysis
- 4.4. Market Entropy
- 4.5. Patent/Trademark Analysis
- 5. Global Sports Gel Analysis, Insights and Forecast, 2020-2032
- 5.1. Market Analysis, Insights and Forecast - by Application
- 5.1.1. Professional Game
- 5.1.2. Amateur Training
- 5.1.3. Others
- 5.2. Market Analysis, Insights and Forecast - by Type
- 5.2.1. Carbohydrate Gel
- 5.2.2. Electrolyte Gel
- 5.2.3. Collagen Gel
- 5.2.4. Caffeine Gel
- 5.2.5. Natural Food Gel
- 5.3. Market Analysis, Insights and Forecast - by Region
- 5.3.1. North America
- 5.3.2. South America
- 5.3.3. Europe
- 5.3.4. Middle East & Africa
- 5.3.5. Asia Pacific
- 5.1. Market Analysis, Insights and Forecast - by Application
- 6. North America Sports Gel Analysis, Insights and Forecast, 2020-2032
- 6.1. Market Analysis, Insights and Forecast - by Application
- 6.1.1. Professional Game
- 6.1.2. Amateur Training
- 6.1.3. Others
- 6.2. Market Analysis, Insights and Forecast - by Type
- 6.2.1. Carbohydrate Gel
- 6.2.2. Electrolyte Gel
- 6.2.3. Collagen Gel
- 6.2.4. Caffeine Gel
- 6.2.5. Natural Food Gel
- 6.1. Market Analysis, Insights and Forecast - by Application
- 7. South America Sports Gel Analysis, Insights and Forecast, 2020-2032
- 7.1. Market Analysis, Insights and Forecast - by Application
- 7.1.1. Professional Game
- 7.1.2. Amateur Training
- 7.1.3. Others
- 7.2. Market Analysis, Insights and Forecast - by Type
- 7.2.1. Carbohydrate Gel
- 7.2.2. Electrolyte Gel
- 7.2.3. Collagen Gel
- 7.2.4. Caffeine Gel
- 7.2.5. Natural Food Gel
- 7.1. Market Analysis, Insights and Forecast - by Application
- 8. Europe Sports Gel Analysis, Insights and Forecast, 2020-2032
- 8.1. Market Analysis, Insights and Forecast - by Application
- 8.1.1. Professional Game
- 8.1.2. Amateur Training
- 8.1.3. Others
- 8.2. Market Analysis, Insights and Forecast - by Type
- 8.2.1. Carbohydrate Gel
- 8.2.2. Electrolyte Gel
- 8.2.3. Collagen Gel
- 8.2.4. Caffeine Gel
- 8.2.5. Natural Food Gel
- 8.1. Market Analysis, Insights and Forecast - by Application
- 9. Middle East & Africa Sports Gel Analysis, Insights and Forecast, 2020-2032
- 9.1. Market Analysis, Insights and Forecast - by Application
- 9.1.1. Professional Game
- 9.1.2. Amateur Training
- 9.1.3. Others
- 9.2. Market Analysis, Insights and Forecast - by Type
- 9.2.1. Carbohydrate Gel
- 9.2.2. Electrolyte Gel
- 9.2.3. Collagen Gel
- 9.2.4. Caffeine Gel
- 9.2.5. Natural Food Gel
- 9.1. Market Analysis, Insights and Forecast - by Application
- 10. Asia Pacific Sports Gel Analysis, Insights and Forecast, 2020-2032
- 10.1. Market Analysis, Insights and Forecast - by Application
- 10.1.1. Professional Game
- 10.1.2. Amateur Training
- 10.1.3. Others
- 10.2. Market Analysis, Insights and Forecast - by Type
- 10.2.1. Carbohydrate Gel
- 10.2.2. Electrolyte Gel
- 10.2.3. Collagen Gel
- 10.2.4. Caffeine Gel
- 10.2.5. Natural Food Gel
- 10.1. Market Analysis, Insights and Forecast - by Application
- 11. Competitive Analysis
- 11.1. Global Market Share Analysis 2025
- 11.2. Company Profiles
- 11.2.1 GU Energy Labs
- 11.2.1.1. Overview
- 11.2.1.2. Products
- 11.2.1.3. SWOT Analysis
- 11.2.1.4. Recent Developments
- 11.2.1.5. Financials (Based on Availability)
- 11.2.2 Clif Bar
- 11.2.2.1. Overview
- 11.2.2.2. Products
- 11.2.2.3. SWOT Analysis
- 11.2.2.4. Recent Developments
- 11.2.2.5. Financials (Based on Availability)
- 11.2.3 PowerBar
- 11.2.3.1. Overview
- 11.2.3.2. Products
- 11.2.3.3. SWOT Analysis
- 11.2.3.4. Recent Developments
- 11.2.3.5. Financials (Based on Availability)
- 11.2.4 Huma Gel
- 11.2.4.1. Overview
- 11.2.4.2. Products
- 11.2.4.3. SWOT Analysis
- 11.2.4.4. Recent Developments
- 11.2.4.5. Financials (Based on Availability)
- 11.2.5 Science in Sport
- 11.2.5.1. Overview
- 11.2.5.2. Products
- 11.2.5.3. SWOT Analysis
- 11.2.5.4. Recent Developments
- 11.2.5.5. Financials (Based on Availability)
- 11.2.6 Maurten
- 11.2.6.1. Overview
- 11.2.6.2. Products
- 11.2.6.3. SWOT Analysis
- 11.2.6.4. Recent Developments
- 11.2.6.5. Financials (Based on Availability)
- 11.2.7 Hammer Nutrition
- 11.2.7.1. Overview
- 11.2.7.2. Products
- 11.2.7.3. SWOT Analysis
- 11.2.7.4. Recent Developments
- 11.2.7.5. Financials (Based on Availability)
- 11.2.8 ProBar
- 11.2.8.1. Overview
- 11.2.8.2. Products
- 11.2.8.3. SWOT Analysis
- 11.2.8.4. Recent Developments
- 11.2.8.5. Financials (Based on Availability)
- 11.2.9 Tailwind Nutrition
- 11.2.9.1. Overview
- 11.2.9.2. Products
- 11.2.9.3. SWOT Analysis
- 11.2.9.4. Recent Developments
- 11.2.9.5. Financials (Based on Availability)
- 11.2.10 Spring Energy
- 11.2.10.1. Overview
- 11.2.10.2. Products
- 11.2.10.3. SWOT Analysis
- 11.2.10.4. Recent Developments
- 11.2.10.5. Financials (Based on Availability)
- 11.2.1 GU Energy Labs
List of Figures
- Figure 1: Global Sports Gel Revenue Breakdown (undefined, %) by Region 2025 & 2033
- Figure 2: Global Sports Gel Volume Breakdown (K, %) by Region 2025 & 2033
- Figure 3: North America Sports Gel Revenue (undefined), by Application 2025 & 2033
- Figure 4: North America Sports Gel Volume (K), by Application 2025 & 2033
- Figure 5: North America Sports Gel Revenue Share (%), by Application 2025 & 2033
- Figure 6: North America Sports Gel Volume Share (%), by Application 2025 & 2033
- Figure 7: North America Sports Gel Revenue (undefined), by Type 2025 & 2033
- Figure 8: North America Sports Gel Volume (K), by Type 2025 & 2033
- Figure 9: North America Sports Gel Revenue Share (%), by Type 2025 & 2033
- Figure 10: North America Sports Gel Volume Share (%), by Type 2025 & 2033
- Figure 11: North America Sports Gel Revenue (undefined), by Country 2025 & 2033
- Figure 12: North America Sports Gel Volume (K), by Country 2025 & 2033
- Figure 13: North America Sports Gel Revenue Share (%), by Country 2025 & 2033
- Figure 14: North America Sports Gel Volume Share (%), by Country 2025 & 2033
- Figure 15: South America Sports Gel Revenue (undefined), by Application 2025 & 2033
- Figure 16: South America Sports Gel Volume (K), by Application 2025 & 2033
- Figure 17: South America Sports Gel Revenue Share (%), by Application 2025 & 2033
- Figure 18: South America Sports Gel Volume Share (%), by Application 2025 & 2033
- Figure 19: South America Sports Gel Revenue (undefined), by Type 2025 & 2033
- Figure 20: South America Sports Gel Volume (K), by Type 2025 & 2033
- Figure 21: South America Sports Gel Revenue Share (%), by Type 2025 & 2033
- Figure 22: South America Sports Gel Volume Share (%), by Type 2025 & 2033
- Figure 23: South America Sports Gel Revenue (undefined), by Country 2025 & 2033
- Figure 24: South America Sports Gel Volume (K), by Country 2025 & 2033
- Figure 25: South America Sports Gel Revenue Share (%), by Country 2025 & 2033
- Figure 26: South America Sports Gel Volume Share (%), by Country 2025 & 2033
- Figure 27: Europe Sports Gel Revenue (undefined), by Application 2025 & 2033
- Figure 28: Europe Sports Gel Volume (K), by Application 2025 & 2033
- Figure 29: Europe Sports Gel Revenue Share (%), by Application 2025 & 2033
- Figure 30: Europe Sports Gel Volume Share (%), by Application 2025 & 2033
- Figure 31: Europe Sports Gel Revenue (undefined), by Type 2025 & 2033
- Figure 32: Europe Sports Gel Volume (K), by Type 2025 & 2033
- Figure 33: Europe Sports Gel Revenue Share (%), by Type 2025 & 2033
- Figure 34: Europe Sports Gel Volume Share (%), by Type 2025 & 2033
- Figure 35: Europe Sports Gel Revenue (undefined), by Country 2025 & 2033
- Figure 36: Europe Sports Gel Volume (K), by Country 2025 & 2033
- Figure 37: Europe Sports Gel Revenue Share (%), by Country 2025 & 2033
- Figure 38: Europe Sports Gel Volume Share (%), by Country 2025 & 2033
- Figure 39: Middle East & Africa Sports Gel Revenue (undefined), by Application 2025 & 2033
- Figure 40: Middle East & Africa Sports Gel Volume (K), by Application 2025 & 2033
- Figure 41: Middle East & Africa Sports Gel Revenue Share (%), by Application 2025 & 2033
- Figure 42: Middle East & Africa Sports Gel Volume Share (%), by Application 2025 & 2033
- Figure 43: Middle East & Africa Sports Gel Revenue (undefined), by Type 2025 & 2033
- Figure 44: Middle East & Africa Sports Gel Volume (K), by Type 2025 & 2033
- Figure 45: Middle East & Africa Sports Gel Revenue Share (%), by Type 2025 & 2033
- Figure 46: Middle East & Africa Sports Gel Volume Share (%), by Type 2025 & 2033
- Figure 47: Middle East & Africa Sports Gel Revenue (undefined), by Country 2025 & 2033
- Figure 48: Middle East & Africa Sports Gel Volume (K), by Country 2025 & 2033
- Figure 49: Middle East & Africa Sports Gel Revenue Share (%), by Country 2025 & 2033
- Figure 50: Middle East & Africa Sports Gel Volume Share (%), by Country 2025 & 2033
- Figure 51: Asia Pacific Sports Gel Revenue (undefined), by Application 2025 & 2033
- Figure 52: Asia Pacific Sports Gel Volume (K), by Application 2025 & 2033
- Figure 53: Asia Pacific Sports Gel Revenue Share (%), by Application 2025 & 2033
- Figure 54: Asia Pacific Sports Gel Volume Share (%), by Application 2025 & 2033
- Figure 55: Asia Pacific Sports Gel Revenue (undefined), by Type 2025 & 2033
- Figure 56: Asia Pacific Sports Gel Volume (K), by Type 2025 & 2033
- Figure 57: Asia Pacific Sports Gel Revenue Share (%), by Type 2025 & 2033
- Figure 58: Asia Pacific Sports Gel Volume Share (%), by Type 2025 & 2033
- Figure 59: Asia Pacific Sports Gel Revenue (undefined), by Country 2025 & 2033
- Figure 60: Asia Pacific Sports Gel Volume (K), by Country 2025 & 2033
- Figure 61: Asia Pacific Sports Gel Revenue Share (%), by Country 2025 & 2033
- Figure 62: Asia Pacific Sports Gel Volume Share (%), by Country 2025 & 2033
List of Tables
- Table 1: Global Sports Gel Revenue undefined Forecast, by Application 2020 & 2033
- Table 2: Global Sports Gel Volume K Forecast, by Application 2020 & 2033
- Table 3: Global Sports Gel Revenue undefined Forecast, by Type 2020 & 2033
- Table 4: Global Sports Gel Volume K Forecast, by Type 2020 & 2033
- Table 5: Global Sports Gel Revenue undefined Forecast, by Region 2020 & 2033
- Table 6: Global Sports Gel Volume K Forecast, by Region 2020 & 2033
- Table 7: Global Sports Gel Revenue undefined Forecast, by Application 2020 & 2033
- Table 8: Global Sports Gel Volume K Forecast, by Application 2020 & 2033
- Table 9: Global Sports Gel Revenue undefined Forecast, by Type 2020 & 2033
- Table 10: Global Sports Gel Volume K Forecast, by Type 2020 & 2033
- Table 11: Global Sports Gel Revenue undefined Forecast, by Country 2020 & 2033
- Table 12: Global Sports Gel Volume K Forecast, by Country 2020 & 2033
- Table 13: United States Sports Gel Revenue (undefined) Forecast, by Application 2020 & 2033
- Table 14: United States Sports Gel Volume (K) Forecast, by Application 2020 & 2033
- Table 15: Canada Sports Gel Revenue (undefined) Forecast, by Application 2020 & 2033
- Table 16: Canada Sports Gel Volume (K) Forecast, by Application 2020 & 2033
- Table 17: Mexico Sports Gel Revenue (undefined) Forecast, by Application 2020 & 2033
- Table 18: Mexico Sports Gel Volume (K) Forecast, by Application 2020 & 2033
- Table 19: Global Sports Gel Revenue undefined Forecast, by Application 2020 & 2033
- Table 20: Global Sports Gel Volume K Forecast, by Application 2020 & 2033
- Table 21: Global Sports Gel Revenue undefined Forecast, by Type 2020 & 2033
- Table 22: Global Sports Gel Volume K Forecast, by Type 2020 & 2033
- Table 23: Global Sports Gel Revenue undefined Forecast, by Country 2020 & 2033
- Table 24: Global Sports Gel Volume K Forecast, by Country 2020 & 2033
- Table 25: Brazil Sports Gel Revenue (undefined) Forecast, by Application 2020 & 2033
- Table 26: Brazil Sports Gel Volume (K) Forecast, by Application 2020 & 2033
- Table 27: Argentina Sports Gel Revenue (undefined) Forecast, by Application 2020 & 2033
- Table 28: Argentina Sports Gel Volume (K) Forecast, by Application 2020 & 2033
- Table 29: Rest of South America Sports Gel Revenue (undefined) Forecast, by Application 2020 & 2033
- Table 30: Rest of South America Sports Gel Volume (K) Forecast, by Application 2020 & 2033
- Table 31: Global Sports Gel Revenue undefined Forecast, by Application 2020 & 2033
- Table 32: Global Sports Gel Volume K Forecast, by Application 2020 & 2033
- Table 33: Global Sports Gel Revenue undefined Forecast, by Type 2020 & 2033
- Table 34: Global Sports Gel Volume K Forecast, by Type 2020 & 2033
- Table 35: Global Sports Gel Revenue undefined Forecast, by Country 2020 & 2033
- Table 36: Global Sports Gel Volume K Forecast, by Country 2020 & 2033
- Table 37: United Kingdom Sports Gel Revenue (undefined) Forecast, by Application 2020 & 2033
- Table 38: United Kingdom Sports Gel Volume (K) Forecast, by Application 2020 & 2033
- Table 39: Germany Sports Gel Revenue (undefined) Forecast, by Application 2020 & 2033
- Table 40: Germany Sports Gel Volume (K) Forecast, by Application 2020 & 2033
- Table 41: France Sports Gel Revenue (undefined) Forecast, by Application 2020 & 2033
- Table 42: France Sports Gel Volume (K) Forecast, by Application 2020 & 2033
- Table 43: Italy Sports Gel Revenue (undefined) Forecast, by Application 2020 & 2033
- Table 44: Italy Sports Gel Volume (K) Forecast, by Application 2020 & 2033
- Table 45: Spain Sports Gel Revenue (undefined) Forecast, by Application 2020 & 2033
- Table 46: Spain Sports Gel Volume (K) Forecast, by Application 2020 & 2033
- Table 47: Russia Sports Gel Revenue (undefined) Forecast, by Application 2020 & 2033
- Table 48: Russia Sports Gel Volume (K) Forecast, by Application 2020 & 2033
- Table 49: Benelux Sports Gel Revenue (undefined) Forecast, by Application 2020 & 2033
- Table 50: Benelux Sports Gel Volume (K) Forecast, by Application 2020 & 2033
- Table 51: Nordics Sports Gel Revenue (undefined) Forecast, by Application 2020 & 2033
- Table 52: Nordics Sports Gel Volume (K) Forecast, by Application 2020 & 2033
- Table 53: Rest of Europe Sports Gel Revenue (undefined) Forecast, by Application 2020 & 2033
- Table 54: Rest of Europe Sports Gel Volume (K) Forecast, by Application 2020 & 2033
- Table 55: Global Sports Gel Revenue undefined Forecast, by Application 2020 & 2033
- Table 56: Global Sports Gel Volume K Forecast, by Application 2020 & 2033
- Table 57: Global Sports Gel Revenue undefined Forecast, by Type 2020 & 2033
- Table 58: Global Sports Gel Volume K Forecast, by Type 2020 & 2033
- Table 59: Global Sports Gel Revenue undefined Forecast, by Country 2020 & 2033
- Table 60: Global Sports Gel Volume K Forecast, by Country 2020 & 2033
- Table 61: Turkey Sports Gel Revenue (undefined) Forecast, by Application 2020 & 2033
- Table 62: Turkey Sports Gel Volume (K) Forecast, by Application 2020 & 2033
- Table 63: Israel Sports Gel Revenue (undefined) Forecast, by Application 2020 & 2033
- Table 64: Israel Sports Gel Volume (K) Forecast, by Application 2020 & 2033
- Table 65: GCC Sports Gel Revenue (undefined) Forecast, by Application 2020 & 2033
- Table 66: GCC Sports Gel Volume (K) Forecast, by Application 2020 & 2033
- Table 67: North Africa Sports Gel Revenue (undefined) Forecast, by Application 2020 & 2033
- Table 68: North Africa Sports Gel Volume (K) Forecast, by Application 2020 & 2033
- Table 69: South Africa Sports Gel Revenue (undefined) Forecast, by Application 2020 & 2033
- Table 70: South Africa Sports Gel Volume (K) Forecast, by Application 2020 & 2033
- Table 71: Rest of Middle East & Africa Sports Gel Revenue (undefined) Forecast, by Application 2020 & 2033
- Table 72: Rest of Middle East & Africa Sports Gel Volume (K) Forecast, by Application 2020 & 2033
- Table 73: Global Sports Gel Revenue undefined Forecast, by Application 2020 & 2033
- Table 74: Global Sports Gel Volume K Forecast, by Application 2020 & 2033
- Table 75: Global Sports Gel Revenue undefined Forecast, by Type 2020 & 2033
- Table 76: Global Sports Gel Volume K Forecast, by Type 2020 & 2033
- Table 77: Global Sports Gel Revenue undefined Forecast, by Country 2020 & 2033
- Table 78: Global Sports Gel Volume K Forecast, by Country 2020 & 2033
- Table 79: China Sports Gel Revenue (undefined) Forecast, by Application 2020 & 2033
- Table 80: China Sports Gel Volume (K) Forecast, by Application 2020 & 2033
- Table 81: India Sports Gel Revenue (undefined) Forecast, by Application 2020 & 2033
- Table 82: India Sports Gel Volume (K) Forecast, by Application 2020 & 2033
- Table 83: Japan Sports Gel Revenue (undefined) Forecast, by Application 2020 & 2033
- Table 84: Japan Sports Gel Volume (K) Forecast, by Application 2020 & 2033
- Table 85: South Korea Sports Gel Revenue (undefined) Forecast, by Application 2020 & 2033
- Table 86: South Korea Sports Gel Volume (K) Forecast, by Application 2020 & 2033
- Table 87: ASEAN Sports Gel Revenue (undefined) Forecast, by Application 2020 & 2033
- Table 88: ASEAN Sports Gel Volume (K) Forecast, by Application 2020 & 2033
- Table 89: Oceania Sports Gel Revenue (undefined) Forecast, by Application 2020 & 2033
- Table 90: Oceania Sports Gel Volume (K) Forecast, by Application 2020 & 2033
- Table 91: Rest of Asia Pacific Sports Gel Revenue (undefined) Forecast, by Application 2020 & 2033
- Table 92: Rest of Asia Pacific Sports Gel Volume (K) Forecast, by Application 2020 & 2033
Frequently Asked Questions
1. What is the projected Compound Annual Growth Rate (CAGR) of the Sports Gel?
The projected CAGR is approximately 7.6%.
2. Which companies are prominent players in the Sports Gel?
Key companies in the market include GU Energy Labs, Clif Bar, PowerBar, Huma Gel, Science in Sport, Maurten, Hammer Nutrition, ProBar, Tailwind Nutrition, Spring Energy.
3. What are the main segments of the Sports Gel?
The market segments include Application, Type.
4. Can you provide details about the market size?
The market size is estimated to be USD XXX N/A as of 2022.
5. What are some drivers contributing to market growth?
N/A
6. What are the notable trends driving market growth?
N/A
7. Are there any restraints impacting market growth?
N/A
8. Can you provide examples of recent developments in the market?
N/A
9. What pricing options are available for accessing the report?
Pricing options include single-user, multi-user, and enterprise licenses priced at USD 3950.00, USD 5925.00, and USD 7900.00 respectively.
10. Is the market size provided in terms of value or volume?
The market size is provided in terms of value, measured in N/A and volume, measured in K.
11. Are there any specific market keywords associated with the report?
Yes, the market keyword associated with the report is "Sports Gel," which aids in identifying and referencing the specific market segment covered.
12. How do I determine which pricing option suits my needs best?
The pricing options vary based on user requirements and access needs. Individual users may opt for single-user licenses, while businesses requiring broader access may choose multi-user or enterprise licenses for cost-effective access to the report.
13. Are there any additional resources or data provided in the Sports Gel report?
While the report offers comprehensive insights, it's advisable to review the specific contents or supplementary materials provided to ascertain if additional resources or data are available.
14. How can I stay updated on further developments or reports in the Sports Gel?
To stay informed about further developments, trends, and reports in the Sports Gel, consider subscribing to industry newsletters, following relevant companies and organizations, or regularly checking reputable industry news sources and publications.
Methodology
Step 1 - Identification of Relevant Samples Size from Population Database


Step 2 - Approaches for Defining Global Market Size (Value, Volume* & Price*)

Note*: In applicable scenarios
Step 3 - Data Sources
Primary Research
- Web Analytics
- Survey Reports
- Research Institute
- Latest Research Reports
- Opinion Leaders
Secondary Research
- Annual Reports
- White Paper
- Latest Press Release
- Industry Association
- Paid Database
- Investor Presentations

Step 4 - Data Triangulation
Involves using different sources of information in order to increase the validity of a study
These sources are likely to be stakeholders in a program - participants, other researchers, program staff, other community members, and so on.
Then we put all data in single framework & apply various statistical tools to find out the dynamic on the market.
During the analysis stage, feedback from the stakeholder groups would be compared to determine areas of agreement as well as areas of divergence