

Key Insights
The spatial genomics and transcriptomics market is experiencing robust growth, driven by the increasing need for high-resolution analysis of gene expression and genomic alterations within tissue samples. This technology offers unprecedented insights into cellular heterogeneity and spatial organization, proving invaluable in various applications across drug discovery, diagnostics, and basic research. The market's expansion is fueled by advancements in imaging technologies, bioinformatics tools, and the development of more sophisticated and user-friendly instruments and software. The pharmaceutical industry is a key driver, leveraging spatial genomics to understand drug mechanisms, identify biomarkers, and accelerate the drug development pipeline. Diagnostic applications are also growing rapidly, offering the potential for more precise and personalized diagnoses based on the spatial context of disease. While high initial investment costs for instrumentation and specialized expertise can present barriers to entry, the growing availability of cloud-based analysis platforms and service providers is mitigating this constraint. Further market growth will be supported by ongoing technological innovations, including improved sensitivity and throughput of spatial profiling techniques, as well as the development of novel applications in areas like oncology, neurology, and immunology.
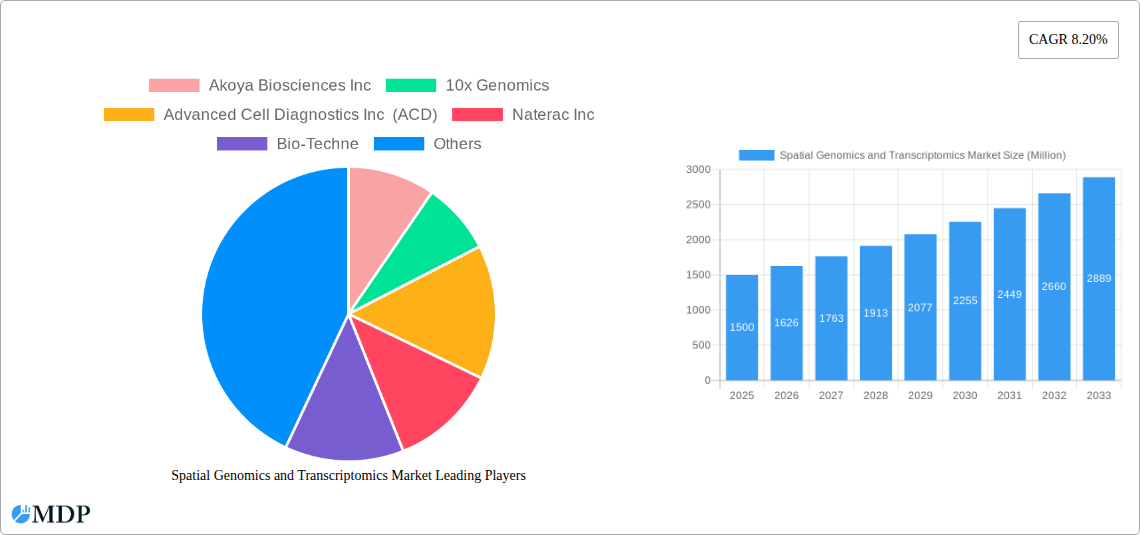
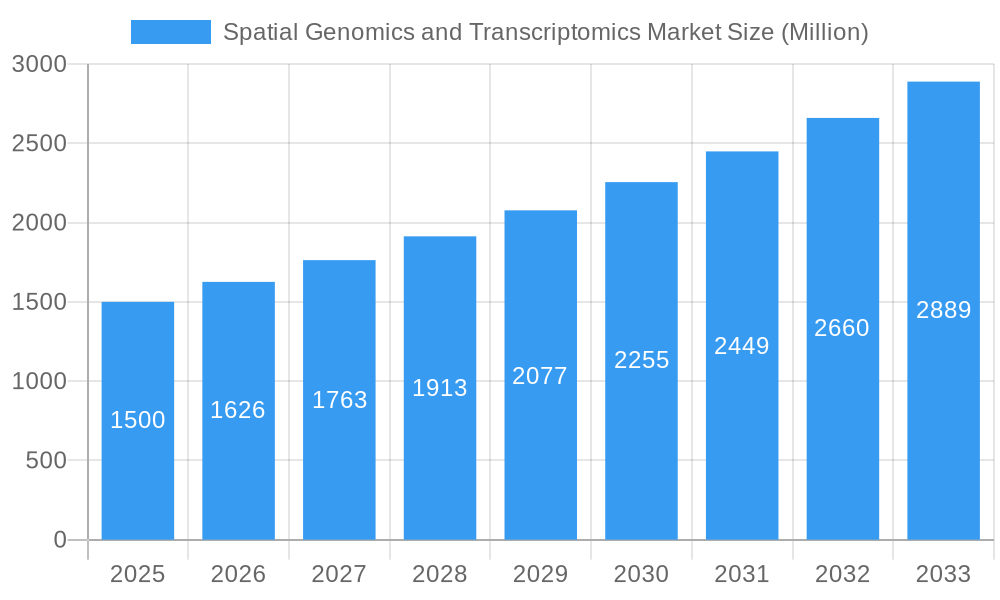
Spatial Genomics and Transcriptomics Market Market Size (In Billion)
The market segmentation reveals significant opportunities across different technological platforms, products, and end-users. Spatial transcriptomics, allowing the study of RNA expression in situ, and spatial genomics, focusing on DNA analysis, both contribute significantly. The instruments segment holds the largest market share due to the capital expenditure required for high-throughput analysis. However, the consumables and software segments are also exhibiting strong growth, mirroring the increasing adoption of these technologies. North America currently dominates the market due to robust research infrastructure and early adoption, but the Asia-Pacific region is expected to witness rapid growth in the coming years fueled by rising healthcare expenditure and increasing research investments. Europe also holds a significant market share driven by well-established research institutions and pharmaceutical companies. The competitive landscape is dynamic, with established players like Illumina, 10x Genomics, and Akoya Biosciences leading the market alongside emerging companies pushing technological boundaries and offering innovative solutions. The forecast period suggests continued strong growth, supported by continuous technological advancement and expanding applications across diverse fields.
Spatial Genomics and Transcriptomics Market Company Market Share
Spatial Genomics and Transcriptomics Market: A Comprehensive Report (2019-2033)
This in-depth report provides a comprehensive analysis of the Spatial Genomics and Transcriptomics market, offering invaluable insights for stakeholders across the industry. With a study period spanning 2019-2033, a base year of 2025, and a forecast period of 2025-2033, this report unveils the market's dynamics, trends, and future potential. The market is segmented by technology (Spatial Transcriptomics, Spatial Genomics), product (Instruments, Software, Consumables), and end-user (Pharmaceutical Manufacturer, Diagnostic Customers, Others). Key players analyzed include Akoya Biosciences Inc, 10x Genomics, Advanced Cell Diagnostics Inc (ACD), Naterac Inc, Bio-Techne, Illumina Inc, Fluidigm, S2 Genomics Inc, Seven Bridges Genomics, Dovetail Genomics, NanoString Technologies Inc, and Horizon Discovery Group plc. This report is essential for strategic decision-making and navigating the rapidly evolving landscape of spatial biology.
Spatial Genomics and Transcriptomics Market Market Dynamics & Concentration
The Spatial Genomics and Transcriptomics market is experiencing robust growth, driven by technological advancements and increasing demand for high-resolution biological data. Market concentration is moderate, with a few key players holding significant market share, but a diverse landscape of smaller companies contributing to innovation. The market is characterized by substantial R&D investment, fueling the development of novel technologies and applications. Regulatory frameworks, while evolving, generally support the adoption of spatial genomics and transcriptomics techniques, particularly in the pharmaceutical and diagnostic sectors. The existence of substitute technologies, such as traditional microscopy techniques, presents some competitive pressure, though the unique advantages of spatial omics are increasingly driving adoption.
- Market Concentration: The top 5 players hold approximately xx% of the market share in 2025, with a projected xx% by 2033.
- Innovation Drivers: High demand for improved spatial resolution and sensitivity, coupled with technological advancements in sequencing and imaging.
- Regulatory Frameworks: Varied across regions, generally supportive of medical applications but subject to ongoing changes.
- Product Substitutes: Traditional microscopy and other non-spatial omics techniques offer alternatives, but are often less informative.
- End-User Trends: Increased adoption by pharmaceutical companies for drug discovery and diagnostics companies for improved disease understanding.
- M&A Activities: The number of M&A deals in this sector increased from xx in 2019 to xx in 2024, suggesting a trend of consolidation and expansion.
Spatial Genomics and Transcriptomics Market Industry Trends & Analysis
The Spatial Genomics and Transcriptomics market is projected to exhibit a Compound Annual Growth Rate (CAGR) of xx% during the forecast period (2025-2033). Key growth drivers include the increasing adoption of advanced technologies, such as next-generation sequencing (NGS), and the growing need for spatially resolved biological information in diverse research and clinical applications. Technological disruptions, particularly in imaging and data analysis techniques, are continuously refining the capabilities and accessibility of spatial omics. Consumer preferences are shifting towards higher throughput, lower cost, and more user-friendly platforms. Competitive dynamics are marked by innovation and strategic partnerships, with companies vying to offer comprehensive solutions that integrate instruments, software, and consumables. Market penetration in key end-user segments, such as pharmaceutical manufacturers and diagnostic customers, is growing rapidly, indicating the increasing recognition of the value proposition of spatial omics. The market value is expected to reach xx Million by 2033.
Leading Markets & Segments in Spatial Genomics and Transcriptomics Market
The North American market currently holds the largest share of the Spatial Genomics and Transcriptomics market, driven by strong R&D investment, robust healthcare infrastructure, and early adoption of innovative technologies. Within the market segments, the instruments segment accounts for a significant share, followed by consumables and software. Pharmaceutical manufacturers are the dominant end-users, driven by the potential to accelerate drug discovery and development.
- Key Drivers in North America: Strong research funding, advanced healthcare infrastructure, early adoption of new technologies, and a large pool of skilled researchers.
- Spatial Transcriptomics: High growth driven by its ease of use and integration with existing workflows.
- Spatial Genomics: Growing demand driven by its ability to provide higher-resolution data and broader application in various research areas.
- Instruments Segment: Dominated by leading players offering advanced platforms and cutting-edge technologies.
- Consumables Segment: High demand driven by ongoing research and clinical applications.
- Software Segment: Growing importance due to the need for sophisticated data analysis and visualization tools.
- Pharmaceutical Manufacturers: Strong drivers include faster drug development timelines and increased R&D investment.
- Diagnostic Customers: Growing adoption for improved disease diagnosis and prognosis.
Spatial Genomics and Transcriptomics Market Product Developments
Recent product innovations have focused on improving throughput, reducing costs, and enhancing the ease of use of spatial omics platforms. New instruments offer improved resolution, sensitivity, and multiplexing capabilities. Sophisticated software packages facilitate data analysis and visualization, enabling researchers to extract meaningful insights from complex datasets. Companies are increasingly developing integrated solutions that streamline the entire workflow, from sample preparation to data analysis. This addresses the need for a user-friendly and comprehensive solution.
Key Drivers of Spatial Genomics and Transcriptomics Market Growth
Several factors are fueling the growth of the Spatial Genomics and Transcriptomics market. Technological advancements in both the hardware and software domains are making the technology more accessible and affordable. The growing recognition of spatial omics' value in biomedical research, coupled with increasing investments in research and development, are significant contributors. Favorable regulatory frameworks in several countries, promoting the adoption of innovative technologies in healthcare, also support growth. Finally, strategic collaborations between technology providers and research institutions have accelerated the deployment and application of spatial genomics and transcriptomics tools.
Challenges in the Spatial Genomics and Transcriptomics Market Market
The Spatial Genomics and Transcriptomics market faces several challenges. High equipment and consumables costs can limit accessibility, especially for smaller research groups. The complexity of data analysis and interpretation requires specialized expertise, potentially hindering widespread adoption. Regulatory hurdles for the clinical applications of spatial omics technologies remain. The availability of trained personnel is also a factor limiting growth. Furthermore, competitive pressures from other molecular biology and imaging techniques pose a challenge.
Emerging Opportunities in Spatial Genomics and Transcriptomics Market
Significant opportunities exist for long-term growth in the Spatial Genomics and Transcriptomics market. Advances in imaging technologies, such as single-cell resolution imaging and high-throughput automation, promise to enhance the capabilities of spatial omics platforms. The increasing demand for personalized medicine creates the need for data rich spatial context, driving the adoption of spatial omics. Strategic partnerships between research institutions and technology companies facilitate the development and application of novel spatial omics techniques. The expansion of spatial omics applications into new areas, such as environmental science and materials science, presents additional growth opportunities.
Leading Players in the Spatial Genomics and Transcriptomics Market Sector
- Akoya Biosciences Inc
- 10x Genomics
- Advanced Cell Diagnostics Inc (ACD)
- Naterac Inc
- Bio-Techne
- Illumina Inc
- Fluidigm
- S2 Genomics Inc
- Seven Bridges Genomics
- Dovetail Genomics
- NanoString Technologies Inc
- Horizon Discovery Group plc
Key Milestones in Spatial Genomics and Transcriptomics Market Industry
- May 2022: NanoString announced a seamless, cloud-based workflow improving spatial data analysis for customers using Illumina NextSeq 1000/2000 and the GeoMx Digital Spatial Profiler, boosting next-generation sequencing in spatial biology research.
- January 2022: Illumina Inc. and Nashville Biosciences LLC partnered to use Illumina's NGS platforms, creating a clinical genomic resource and accelerating new medicine development.
Strategic Outlook for Spatial Genomics and Transcriptomics Market Market
The Spatial Genomics and Transcriptomics market exhibits significant long-term growth potential, driven by continuous technological innovations, expanding applications, and growing adoption across various sectors. Strategic partnerships, strategic acquisitions, and collaborations are expected to play a crucial role in shaping the market landscape. Companies focusing on developing user-friendly, cost-effective, and high-throughput spatial omics platforms are likely to gain a competitive edge. The market's future growth will be driven by continued investment in R&D, the development of novel applications in diverse research fields, and increased accessibility of spatial omics technologies.
Spatial Genomics and Transcriptomics Market Segmentation
-
1. Technology
- 1.1. Spatial Transcriptomics
- 1.2. Spatial Genomics
-
2. Product
- 2.1. Instruments
- 2.2. Software
- 2.3. Consumables
-
3. End-User
- 3.1. Pharmaceutical Manufacturer
- 3.2. Diagnostic Customers
- 3.3. Others
Spatial Genomics and Transcriptomics Market Segmentation By Geography
-
1. North America
- 1.1. United States
- 1.2. Canada
- 1.3. Mexico
-
2. Europe
- 2.1. Germany
- 2.2. United Kingdom
- 2.3. France
- 2.4. Italy
- 2.5. Spain
- 2.6. Rest of Europe
-
3. Asia Pacific
- 3.1. China
- 3.2. Japan
- 3.3. India
- 3.4. Australia
- 3.5. South Korea
- 3.6. Rest of Asia Pacific
-
4. Middle East and Africa
- 4.1. GCC
- 4.2. South Africa
- 4.3. Rest of Middle East and Africa
-
5. South America
- 5.1. Brazil
- 5.2. Argentina
- 5.3. Rest of South America
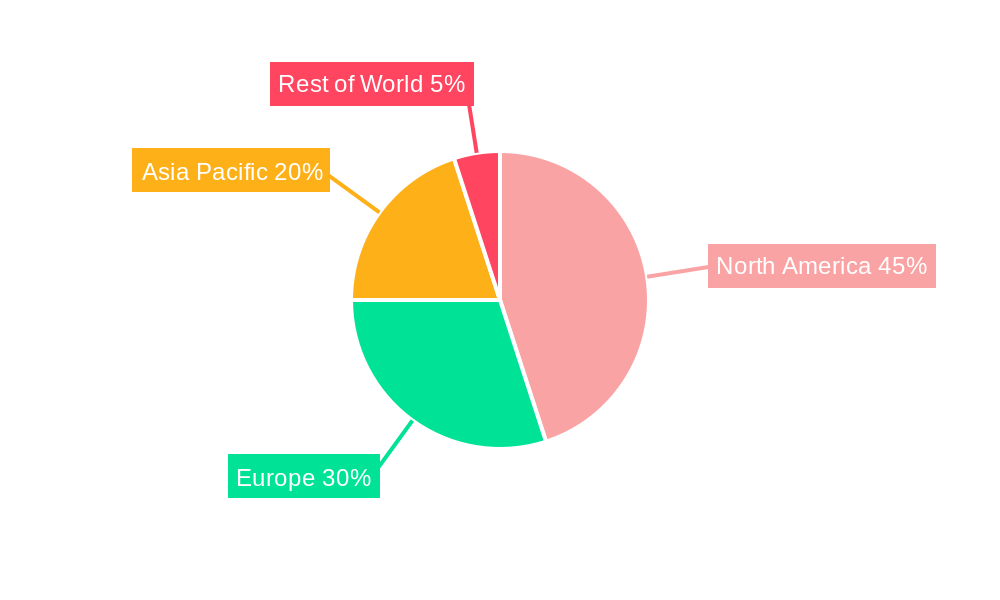
Spatial Genomics and Transcriptomics Market Regional Market Share
Geographic Coverage of Spatial Genomics and Transcriptomics Market
Spatial Genomics and Transcriptomics Market REPORT HIGHLIGHTS
| Aspects | Details |
|---|---|
| Study Period | 2020-2034 |
| Base Year | 2025 |
| Estimated Year | 2026 |
| Forecast Period | 2026-2034 |
| Historical Period | 2020-2025 |
| Growth Rate | CAGR of 14.69% from 2020-2034 |
| Segmentation |
|
Table of Contents
- 1. Introduction
- 1.1. Research Scope
- 1.2. Market Segmentation
- 1.3. Research Methodology
- 1.4. Definitions and Assumptions
- 2. Executive Summary
- 2.1. Introduction
- 3. Market Dynamics
- 3.1. Introduction
- 3.2. Market Drivers
- 3.2.1. Emerging Potential of Spatial Genomic Analysis as Cancer Diagnostic Tool; Increasing Advanced Technologies of Spatial Genomics and Transcriptomics; Advent of Fourth Generation of Sequencing
- 3.3. Market Restrains
- 3.3.1. Slow Implementation of Technology; Well-Established Workflows for Conventional Genomics and Transcriptomics Analysis
- 3.4. Market Trends
- 3.4.1. Consumables Segment is Expected to Witness Healthy Growth During the Forecast Period
- 4. Market Factor Analysis
- 4.1. Porters Five Forces
- 4.2. Supply/Value Chain
- 4.3. PESTEL analysis
- 4.4. Market Entropy
- 4.5. Patent/Trademark Analysis
- 5. Global Spatial Genomics and Transcriptomics Market Analysis, Insights and Forecast, 2020-2032
- 5.1. Market Analysis, Insights and Forecast - by Technology
- 5.1.1. Spatial Transcriptomics
- 5.1.2. Spatial Genomics
- 5.2. Market Analysis, Insights and Forecast - by Product
- 5.2.1. Instruments
- 5.2.2. Software
- 5.2.3. Consumables
- 5.3. Market Analysis, Insights and Forecast - by End-User
- 5.3.1. Pharmaceutical Manufacturer
- 5.3.2. Diagnostic Customers
- 5.3.3. Others
- 5.4. Market Analysis, Insights and Forecast - by Region
- 5.4.1. North America
- 5.4.2. Europe
- 5.4.3. Asia Pacific
- 5.4.4. Middle East and Africa
- 5.4.5. South America
- 5.1. Market Analysis, Insights and Forecast - by Technology
- 6. North America Spatial Genomics and Transcriptomics Market Analysis, Insights and Forecast, 2020-2032
- 6.1. Market Analysis, Insights and Forecast - by Technology
- 6.1.1. Spatial Transcriptomics
- 6.1.2. Spatial Genomics
- 6.2. Market Analysis, Insights and Forecast - by Product
- 6.2.1. Instruments
- 6.2.2. Software
- 6.2.3. Consumables
- 6.3. Market Analysis, Insights and Forecast - by End-User
- 6.3.1. Pharmaceutical Manufacturer
- 6.3.2. Diagnostic Customers
- 6.3.3. Others
- 6.1. Market Analysis, Insights and Forecast - by Technology
- 7. Europe Spatial Genomics and Transcriptomics Market Analysis, Insights and Forecast, 2020-2032
- 7.1. Market Analysis, Insights and Forecast - by Technology
- 7.1.1. Spatial Transcriptomics
- 7.1.2. Spatial Genomics
- 7.2. Market Analysis, Insights and Forecast - by Product
- 7.2.1. Instruments
- 7.2.2. Software
- 7.2.3. Consumables
- 7.3. Market Analysis, Insights and Forecast - by End-User
- 7.3.1. Pharmaceutical Manufacturer
- 7.3.2. Diagnostic Customers
- 7.3.3. Others
- 7.1. Market Analysis, Insights and Forecast - by Technology
- 8. Asia Pacific Spatial Genomics and Transcriptomics Market Analysis, Insights and Forecast, 2020-2032
- 8.1. Market Analysis, Insights and Forecast - by Technology
- 8.1.1. Spatial Transcriptomics
- 8.1.2. Spatial Genomics
- 8.2. Market Analysis, Insights and Forecast - by Product
- 8.2.1. Instruments
- 8.2.2. Software
- 8.2.3. Consumables
- 8.3. Market Analysis, Insights and Forecast - by End-User
- 8.3.1. Pharmaceutical Manufacturer
- 8.3.2. Diagnostic Customers
- 8.3.3. Others
- 8.1. Market Analysis, Insights and Forecast - by Technology
- 9. Middle East and Africa Spatial Genomics and Transcriptomics Market Analysis, Insights and Forecast, 2020-2032
- 9.1. Market Analysis, Insights and Forecast - by Technology
- 9.1.1. Spatial Transcriptomics
- 9.1.2. Spatial Genomics
- 9.2. Market Analysis, Insights and Forecast - by Product
- 9.2.1. Instruments
- 9.2.2. Software
- 9.2.3. Consumables
- 9.3. Market Analysis, Insights and Forecast - by End-User
- 9.3.1. Pharmaceutical Manufacturer
- 9.3.2. Diagnostic Customers
- 9.3.3. Others
- 9.1. Market Analysis, Insights and Forecast - by Technology
- 10. South America Spatial Genomics and Transcriptomics Market Analysis, Insights and Forecast, 2020-2032
- 10.1. Market Analysis, Insights and Forecast - by Technology
- 10.1.1. Spatial Transcriptomics
- 10.1.2. Spatial Genomics
- 10.2. Market Analysis, Insights and Forecast - by Product
- 10.2.1. Instruments
- 10.2.2. Software
- 10.2.3. Consumables
- 10.3. Market Analysis, Insights and Forecast - by End-User
- 10.3.1. Pharmaceutical Manufacturer
- 10.3.2. Diagnostic Customers
- 10.3.3. Others
- 10.1. Market Analysis, Insights and Forecast - by Technology
- 11. Competitive Analysis
- 11.1. Global Market Share Analysis 2025
- 11.2. Company Profiles
- 11.2.1 Akoya Biosciences Inc
- 11.2.1.1. Overview
- 11.2.1.2. Products
- 11.2.1.3. SWOT Analysis
- 11.2.1.4. Recent Developments
- 11.2.1.5. Financials (Based on Availability)
- 11.2.2 10x Genomics
- 11.2.2.1. Overview
- 11.2.2.2. Products
- 11.2.2.3. SWOT Analysis
- 11.2.2.4. Recent Developments
- 11.2.2.5. Financials (Based on Availability)
- 11.2.3 Advanced Cell Diagnostics Inc (ACD)
- 11.2.3.1. Overview
- 11.2.3.2. Products
- 11.2.3.3. SWOT Analysis
- 11.2.3.4. Recent Developments
- 11.2.3.5. Financials (Based on Availability)
- 11.2.4 Naterac Inc
- 11.2.4.1. Overview
- 11.2.4.2. Products
- 11.2.4.3. SWOT Analysis
- 11.2.4.4. Recent Developments
- 11.2.4.5. Financials (Based on Availability)
- 11.2.5 Bio-Techne
- 11.2.5.1. Overview
- 11.2.5.2. Products
- 11.2.5.3. SWOT Analysis
- 11.2.5.4. Recent Developments
- 11.2.5.5. Financials (Based on Availability)
- 11.2.6 Illumina Inc
- 11.2.6.1. Overview
- 11.2.6.2. Products
- 11.2.6.3. SWOT Analysis
- 11.2.6.4. Recent Developments
- 11.2.6.5. Financials (Based on Availability)
- 11.2.7 Fluidigm
- 11.2.7.1. Overview
- 11.2.7.2. Products
- 11.2.7.3. SWOT Analysis
- 11.2.7.4. Recent Developments
- 11.2.7.5. Financials (Based on Availability)
- 11.2.8 S2 Genomics Inc
- 11.2.8.1. Overview
- 11.2.8.2. Products
- 11.2.8.3. SWOT Analysis
- 11.2.8.4. Recent Developments
- 11.2.8.5. Financials (Based on Availability)
- 11.2.9 Seven Bridges Genomics*List Not Exhaustive
- 11.2.9.1. Overview
- 11.2.9.2. Products
- 11.2.9.3. SWOT Analysis
- 11.2.9.4. Recent Developments
- 11.2.9.5. Financials (Based on Availability)
- 11.2.10 Dovetail Genomics
- 11.2.10.1. Overview
- 11.2.10.2. Products
- 11.2.10.3. SWOT Analysis
- 11.2.10.4. Recent Developments
- 11.2.10.5. Financials (Based on Availability)
- 11.2.11 NanoString Technologies Inc
- 11.2.11.1. Overview
- 11.2.11.2. Products
- 11.2.11.3. SWOT Analysis
- 11.2.11.4. Recent Developments
- 11.2.11.5. Financials (Based on Availability)
- 11.2.12 Horizon Discovery Group plc
- 11.2.12.1. Overview
- 11.2.12.2. Products
- 11.2.12.3. SWOT Analysis
- 11.2.12.4. Recent Developments
- 11.2.12.5. Financials (Based on Availability)
- 11.2.1 Akoya Biosciences Inc
List of Figures
- Figure 1: Global Spatial Genomics and Transcriptomics Market Revenue Breakdown (undefined, %) by Region 2025 & 2033
- Figure 2: North America Spatial Genomics and Transcriptomics Market Revenue (undefined), by Technology 2025 & 2033
- Figure 3: North America Spatial Genomics and Transcriptomics Market Revenue Share (%), by Technology 2025 & 2033
- Figure 4: North America Spatial Genomics and Transcriptomics Market Revenue (undefined), by Product 2025 & 2033
- Figure 5: North America Spatial Genomics and Transcriptomics Market Revenue Share (%), by Product 2025 & 2033
- Figure 6: North America Spatial Genomics and Transcriptomics Market Revenue (undefined), by End-User 2025 & 2033
- Figure 7: North America Spatial Genomics and Transcriptomics Market Revenue Share (%), by End-User 2025 & 2033
- Figure 8: North America Spatial Genomics and Transcriptomics Market Revenue (undefined), by Country 2025 & 2033
- Figure 9: North America Spatial Genomics and Transcriptomics Market Revenue Share (%), by Country 2025 & 2033
- Figure 10: Europe Spatial Genomics and Transcriptomics Market Revenue (undefined), by Technology 2025 & 2033
- Figure 11: Europe Spatial Genomics and Transcriptomics Market Revenue Share (%), by Technology 2025 & 2033
- Figure 12: Europe Spatial Genomics and Transcriptomics Market Revenue (undefined), by Product 2025 & 2033
- Figure 13: Europe Spatial Genomics and Transcriptomics Market Revenue Share (%), by Product 2025 & 2033
- Figure 14: Europe Spatial Genomics and Transcriptomics Market Revenue (undefined), by End-User 2025 & 2033
- Figure 15: Europe Spatial Genomics and Transcriptomics Market Revenue Share (%), by End-User 2025 & 2033
- Figure 16: Europe Spatial Genomics and Transcriptomics Market Revenue (undefined), by Country 2025 & 2033
- Figure 17: Europe Spatial Genomics and Transcriptomics Market Revenue Share (%), by Country 2025 & 2033
- Figure 18: Asia Pacific Spatial Genomics and Transcriptomics Market Revenue (undefined), by Technology 2025 & 2033
- Figure 19: Asia Pacific Spatial Genomics and Transcriptomics Market Revenue Share (%), by Technology 2025 & 2033
- Figure 20: Asia Pacific Spatial Genomics and Transcriptomics Market Revenue (undefined), by Product 2025 & 2033
- Figure 21: Asia Pacific Spatial Genomics and Transcriptomics Market Revenue Share (%), by Product 2025 & 2033
- Figure 22: Asia Pacific Spatial Genomics and Transcriptomics Market Revenue (undefined), by End-User 2025 & 2033
- Figure 23: Asia Pacific Spatial Genomics and Transcriptomics Market Revenue Share (%), by End-User 2025 & 2033
- Figure 24: Asia Pacific Spatial Genomics and Transcriptomics Market Revenue (undefined), by Country 2025 & 2033
- Figure 25: Asia Pacific Spatial Genomics and Transcriptomics Market Revenue Share (%), by Country 2025 & 2033
- Figure 26: Middle East and Africa Spatial Genomics and Transcriptomics Market Revenue (undefined), by Technology 2025 & 2033
- Figure 27: Middle East and Africa Spatial Genomics and Transcriptomics Market Revenue Share (%), by Technology 2025 & 2033
- Figure 28: Middle East and Africa Spatial Genomics and Transcriptomics Market Revenue (undefined), by Product 2025 & 2033
- Figure 29: Middle East and Africa Spatial Genomics and Transcriptomics Market Revenue Share (%), by Product 2025 & 2033
- Figure 30: Middle East and Africa Spatial Genomics and Transcriptomics Market Revenue (undefined), by End-User 2025 & 2033
- Figure 31: Middle East and Africa Spatial Genomics and Transcriptomics Market Revenue Share (%), by End-User 2025 & 2033
- Figure 32: Middle East and Africa Spatial Genomics and Transcriptomics Market Revenue (undefined), by Country 2025 & 2033
- Figure 33: Middle East and Africa Spatial Genomics and Transcriptomics Market Revenue Share (%), by Country 2025 & 2033
- Figure 34: South America Spatial Genomics and Transcriptomics Market Revenue (undefined), by Technology 2025 & 2033
- Figure 35: South America Spatial Genomics and Transcriptomics Market Revenue Share (%), by Technology 2025 & 2033
- Figure 36: South America Spatial Genomics and Transcriptomics Market Revenue (undefined), by Product 2025 & 2033
- Figure 37: South America Spatial Genomics and Transcriptomics Market Revenue Share (%), by Product 2025 & 2033
- Figure 38: South America Spatial Genomics and Transcriptomics Market Revenue (undefined), by End-User 2025 & 2033
- Figure 39: South America Spatial Genomics and Transcriptomics Market Revenue Share (%), by End-User 2025 & 2033
- Figure 40: South America Spatial Genomics and Transcriptomics Market Revenue (undefined), by Country 2025 & 2033
- Figure 41: South America Spatial Genomics and Transcriptomics Market Revenue Share (%), by Country 2025 & 2033
List of Tables
- Table 1: Global Spatial Genomics and Transcriptomics Market Revenue undefined Forecast, by Technology 2020 & 2033
- Table 2: Global Spatial Genomics and Transcriptomics Market Revenue undefined Forecast, by Product 2020 & 2033
- Table 3: Global Spatial Genomics and Transcriptomics Market Revenue undefined Forecast, by End-User 2020 & 2033
- Table 4: Global Spatial Genomics and Transcriptomics Market Revenue undefined Forecast, by Region 2020 & 2033
- Table 5: Global Spatial Genomics and Transcriptomics Market Revenue undefined Forecast, by Technology 2020 & 2033
- Table 6: Global Spatial Genomics and Transcriptomics Market Revenue undefined Forecast, by Product 2020 & 2033
- Table 7: Global Spatial Genomics and Transcriptomics Market Revenue undefined Forecast, by End-User 2020 & 2033
- Table 8: Global Spatial Genomics and Transcriptomics Market Revenue undefined Forecast, by Country 2020 & 2033
- Table 9: United States Spatial Genomics and Transcriptomics Market Revenue (undefined) Forecast, by Application 2020 & 2033
- Table 10: Canada Spatial Genomics and Transcriptomics Market Revenue (undefined) Forecast, by Application 2020 & 2033
- Table 11: Mexico Spatial Genomics and Transcriptomics Market Revenue (undefined) Forecast, by Application 2020 & 2033
- Table 12: Global Spatial Genomics and Transcriptomics Market Revenue undefined Forecast, by Technology 2020 & 2033
- Table 13: Global Spatial Genomics and Transcriptomics Market Revenue undefined Forecast, by Product 2020 & 2033
- Table 14: Global Spatial Genomics and Transcriptomics Market Revenue undefined Forecast, by End-User 2020 & 2033
- Table 15: Global Spatial Genomics and Transcriptomics Market Revenue undefined Forecast, by Country 2020 & 2033
- Table 16: Germany Spatial Genomics and Transcriptomics Market Revenue (undefined) Forecast, by Application 2020 & 2033
- Table 17: United Kingdom Spatial Genomics and Transcriptomics Market Revenue (undefined) Forecast, by Application 2020 & 2033
- Table 18: France Spatial Genomics and Transcriptomics Market Revenue (undefined) Forecast, by Application 2020 & 2033
- Table 19: Italy Spatial Genomics and Transcriptomics Market Revenue (undefined) Forecast, by Application 2020 & 2033
- Table 20: Spain Spatial Genomics and Transcriptomics Market Revenue (undefined) Forecast, by Application 2020 & 2033
- Table 21: Rest of Europe Spatial Genomics and Transcriptomics Market Revenue (undefined) Forecast, by Application 2020 & 2033
- Table 22: Global Spatial Genomics and Transcriptomics Market Revenue undefined Forecast, by Technology 2020 & 2033
- Table 23: Global Spatial Genomics and Transcriptomics Market Revenue undefined Forecast, by Product 2020 & 2033
- Table 24: Global Spatial Genomics and Transcriptomics Market Revenue undefined Forecast, by End-User 2020 & 2033
- Table 25: Global Spatial Genomics and Transcriptomics Market Revenue undefined Forecast, by Country 2020 & 2033
- Table 26: China Spatial Genomics and Transcriptomics Market Revenue (undefined) Forecast, by Application 2020 & 2033
- Table 27: Japan Spatial Genomics and Transcriptomics Market Revenue (undefined) Forecast, by Application 2020 & 2033
- Table 28: India Spatial Genomics and Transcriptomics Market Revenue (undefined) Forecast, by Application 2020 & 2033
- Table 29: Australia Spatial Genomics and Transcriptomics Market Revenue (undefined) Forecast, by Application 2020 & 2033
- Table 30: South Korea Spatial Genomics and Transcriptomics Market Revenue (undefined) Forecast, by Application 2020 & 2033
- Table 31: Rest of Asia Pacific Spatial Genomics and Transcriptomics Market Revenue (undefined) Forecast, by Application 2020 & 2033
- Table 32: Global Spatial Genomics and Transcriptomics Market Revenue undefined Forecast, by Technology 2020 & 2033
- Table 33: Global Spatial Genomics and Transcriptomics Market Revenue undefined Forecast, by Product 2020 & 2033
- Table 34: Global Spatial Genomics and Transcriptomics Market Revenue undefined Forecast, by End-User 2020 & 2033
- Table 35: Global Spatial Genomics and Transcriptomics Market Revenue undefined Forecast, by Country 2020 & 2033
- Table 36: GCC Spatial Genomics and Transcriptomics Market Revenue (undefined) Forecast, by Application 2020 & 2033
- Table 37: South Africa Spatial Genomics and Transcriptomics Market Revenue (undefined) Forecast, by Application 2020 & 2033
- Table 38: Rest of Middle East and Africa Spatial Genomics and Transcriptomics Market Revenue (undefined) Forecast, by Application 2020 & 2033
- Table 39: Global Spatial Genomics and Transcriptomics Market Revenue undefined Forecast, by Technology 2020 & 2033
- Table 40: Global Spatial Genomics and Transcriptomics Market Revenue undefined Forecast, by Product 2020 & 2033
- Table 41: Global Spatial Genomics and Transcriptomics Market Revenue undefined Forecast, by End-User 2020 & 2033
- Table 42: Global Spatial Genomics and Transcriptomics Market Revenue undefined Forecast, by Country 2020 & 2033
- Table 43: Brazil Spatial Genomics and Transcriptomics Market Revenue (undefined) Forecast, by Application 2020 & 2033
- Table 44: Argentina Spatial Genomics and Transcriptomics Market Revenue (undefined) Forecast, by Application 2020 & 2033
- Table 45: Rest of South America Spatial Genomics and Transcriptomics Market Revenue (undefined) Forecast, by Application 2020 & 2033
Frequently Asked Questions
1. What is the projected Compound Annual Growth Rate (CAGR) of the Spatial Genomics and Transcriptomics Market?
The projected CAGR is approximately 14.69%.
2. Which companies are prominent players in the Spatial Genomics and Transcriptomics Market?
Key companies in the market include Akoya Biosciences Inc, 10x Genomics, Advanced Cell Diagnostics Inc (ACD), Naterac Inc, Bio-Techne, Illumina Inc, Fluidigm, S2 Genomics Inc, Seven Bridges Genomics*List Not Exhaustive, Dovetail Genomics, NanoString Technologies Inc, Horizon Discovery Group plc.
3. What are the main segments of the Spatial Genomics and Transcriptomics Market?
The market segments include Technology, Product, End-User.
4. Can you provide details about the market size?
The market size is estimated to be USD XXX N/A as of 2022.
5. What are some drivers contributing to market growth?
Emerging Potential of Spatial Genomic Analysis as Cancer Diagnostic Tool; Increasing Advanced Technologies of Spatial Genomics and Transcriptomics; Advent of Fourth Generation of Sequencing.
6. What are the notable trends driving market growth?
Consumables Segment is Expected to Witness Healthy Growth During the Forecast Period.
7. Are there any restraints impacting market growth?
Slow Implementation of Technology; Well-Established Workflows for Conventional Genomics and Transcriptomics Analysis.
8. Can you provide examples of recent developments in the market?
May 2022: NanoString announced a seamless, cloud-based workflow that improves the spatial data analysis experience of customers using Illumina NextSeq 1000 and NextSeq 2000 sequencing systems and the GeoMx Digital Spatial Profiler to facilitate spatial biology research using next-generation sequencing.
9. What pricing options are available for accessing the report?
Pricing options include single-user, multi-user, and enterprise licenses priced at USD 4750, USD 5250, and USD 8750 respectively.
10. Is the market size provided in terms of value or volume?
The market size is provided in terms of value, measured in N/A.
11. Are there any specific market keywords associated with the report?
Yes, the market keyword associated with the report is "Spatial Genomics and Transcriptomics Market," which aids in identifying and referencing the specific market segment covered.
12. How do I determine which pricing option suits my needs best?
The pricing options vary based on user requirements and access needs. Individual users may opt for single-user licenses, while businesses requiring broader access may choose multi-user or enterprise licenses for cost-effective access to the report.
13. Are there any additional resources or data provided in the Spatial Genomics and Transcriptomics Market report?
While the report offers comprehensive insights, it's advisable to review the specific contents or supplementary materials provided to ascertain if additional resources or data are available.
14. How can I stay updated on further developments or reports in the Spatial Genomics and Transcriptomics Market?
To stay informed about further developments, trends, and reports in the Spatial Genomics and Transcriptomics Market, consider subscribing to industry newsletters, following relevant companies and organizations, or regularly checking reputable industry news sources and publications.
Methodology
Step 1 - Identification of Relevant Samples Size from Population Database


Step 2 - Approaches for Defining Global Market Size (Value, Volume* & Price*)

Note*: In applicable scenarios
Step 3 - Data Sources
Primary Research
- Web Analytics
- Survey Reports
- Research Institute
- Latest Research Reports
- Opinion Leaders
Secondary Research
- Annual Reports
- White Paper
- Latest Press Release
- Industry Association
- Paid Database
- Investor Presentations

Step 4 - Data Triangulation
Involves using different sources of information in order to increase the validity of a study
These sources are likely to be stakeholders in a program - participants, other researchers, program staff, other community members, and so on.
Then we put all data in single framework & apply various statistical tools to find out the dynamic on the market.
During the analysis stage, feedback from the stakeholder groups would be compared to determine areas of agreement as well as areas of divergence