

Key Insights
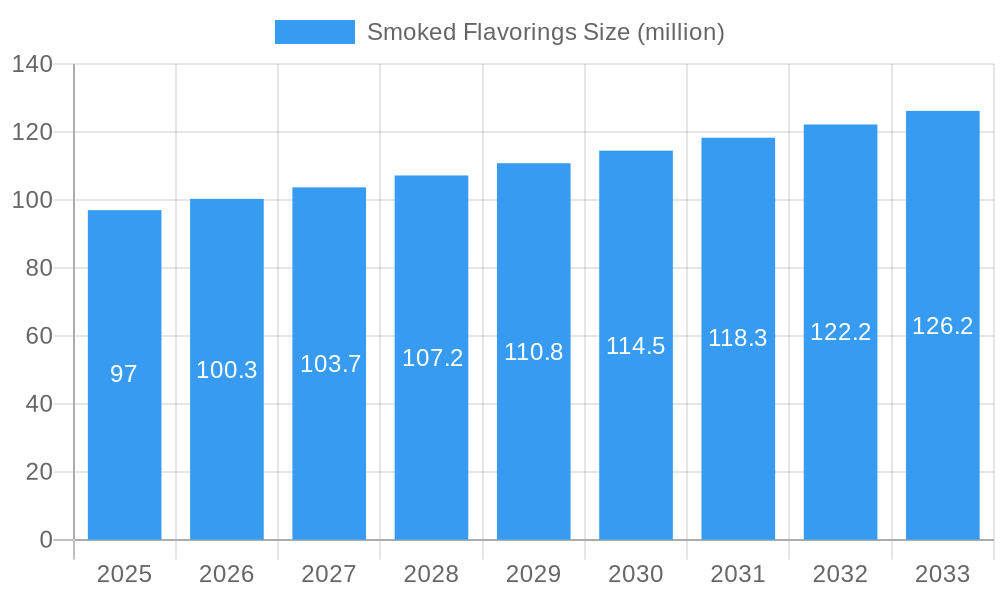
The smoked flavorings market, currently valued at approximately $97 million in 2025, is projected to experience steady growth, exhibiting a compound annual growth rate (CAGR) of 3.2% from 2025 to 2033. This growth is fueled by several key factors. The increasing demand for convenient and ready-to-eat foods, particularly in developing economies, is a major driver. Consumers are increasingly seeking authentic and intense flavor profiles in their meals, leading to a heightened demand for natural and high-quality smoked flavorings. Furthermore, the expanding food processing industry, coupled with the growing popularity of meat alternatives and plant-based products requiring sophisticated flavor enhancement, is contributing significantly to market expansion. Innovation in flavor delivery systems and the development of clean-label products are also driving market growth. However, the market faces challenges such as stringent regulations regarding food additives and the potential for volatility in raw material prices, which can impact profitability.
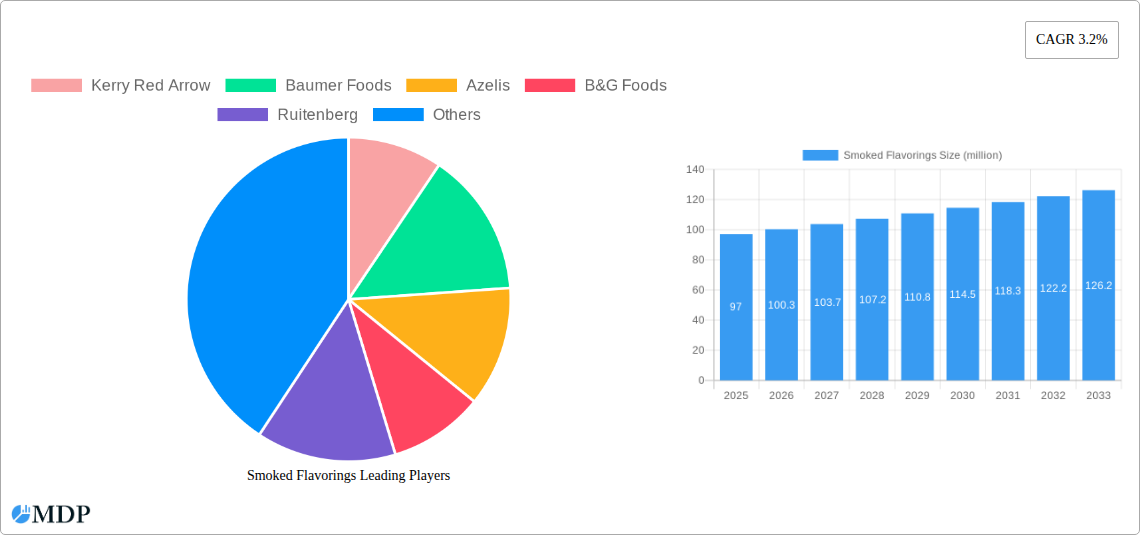
Smoked Flavorings Market Size (In Million)
The competitive landscape is characterized by a mix of large multinational companies and smaller specialized players. Key players such as Kerry, Red Arrow, Baumer Foods, and Azelis are leveraging their established distribution networks and R&D capabilities to maintain market share. Smaller companies, however, are focusing on niche applications and innovative product development to compete effectively. Regional variations in consumer preferences and regulatory frameworks present both opportunities and challenges for companies operating in this market. The North American and European markets are expected to continue their dominance, while the Asia-Pacific region is projected to witness significant growth driven by increasing disposable incomes and changing consumer tastes. Further market segmentation analysis (not provided in initial data) would offer a clearer understanding of growth potential within specific product categories and regional markets.
Smoked Flavorings Company Market Share
Smoked Flavorings Market Report: A Comprehensive Analysis (2019-2033)
This comprehensive report provides an in-depth analysis of the global smoked flavorings market, offering invaluable insights for industry stakeholders. With a study period spanning 2019-2033, a base year of 2025, and a forecast period of 2025-2033, this report unveils the market's dynamics, trends, and future potential. The report projects a market value exceeding $XX million by 2033, presenting significant growth opportunities for investors and businesses alike. Discover key trends, competitive landscapes, and strategic recommendations to capitalize on this expanding market.
Smoked Flavorings Market Dynamics & Concentration
The global smoked flavorings market exhibits a moderately concentrated structure, with several major players commanding significant market share. Kerry Red Arrow, Baumer Foods, and Azelis are among the leading companies, collectively holding an estimated xx% market share in 2025. Innovation plays a crucial role, driving the development of new flavor profiles and delivery systems. Stringent regulatory frameworks concerning food safety and labeling influence market operations. Competition from natural smoked flavor alternatives and increased demand for clean-label products contribute to the dynamic landscape. Mergers and acquisitions (M&A) activity has been moderate, with an estimated xx M&A deals in the historical period (2019-2024). End-user trends toward convenience, health consciousness, and diverse culinary experiences continue to shape product development.
- Market Concentration: Moderately concentrated, with top 3 players holding xx% market share (2025).
- Innovation Drivers: Development of novel flavor profiles, delivery systems, and clean-label solutions.
- Regulatory Landscape: Stringent food safety and labeling regulations impact market operations.
- Product Substitutes: Natural smoked flavor alternatives present competition.
- End-User Trends: Growing demand for convenient, healthy, and diverse food products.
- M&A Activity: Estimated xx M&A deals (2019-2024).
Smoked Flavorings Industry Trends & Analysis
The smoked flavorings market is experiencing robust growth, fueled by rising demand for processed foods, convenience foods, and meat alternatives. The Compound Annual Growth Rate (CAGR) during the forecast period (2025-2033) is projected to be xx%. Technological advancements, such as the use of advanced extraction techniques and bio-engineered processes, are enhancing flavor quality and efficiency. Consumer preference for authentic smoky flavors in diverse food products, from savory snacks to beverages, is driving market expansion. The competitive landscape is marked by intense rivalry, prompting players to constantly innovate and expand their product portfolios. Market penetration is increasing steadily in both developed and developing regions due to rising disposable incomes and evolving dietary habits.
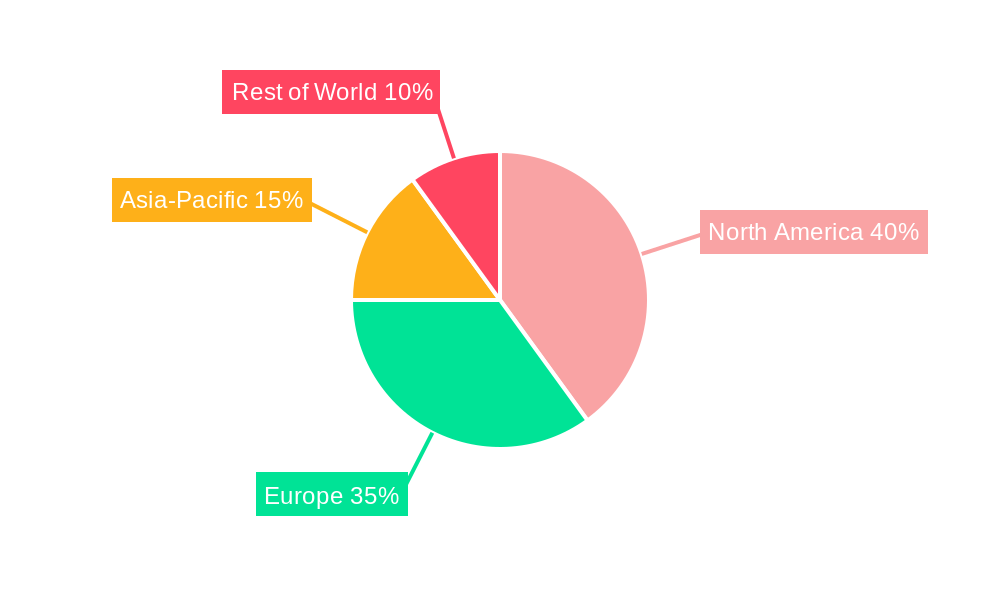
Leading Markets & Segments in Smoked Flavorings
The North American market currently holds the dominant position in the global smoked flavorings market. This dominance is primarily attributed to:
- High Consumption of Processed Foods: The region's high consumption of processed and convenience foods drives demand for smoked flavorings.
- Robust Food Processing Industry: A well-established and technologically advanced food processing industry facilitates the integration of smoked flavorings.
- Favorable Regulatory Environment: Relatively less stringent regulations compared to other regions encourage market expansion.
- Strong Consumer Demand: A diverse consumer base with a preference for unique flavors boosts demand.
Further breakdown by segment (specific segment details were not provided, therefore this analysis will be generalized) reveals that the meat and poultry segment holds the largest market share due to the widespread use of smoked flavorings to enhance the taste of processed meat products. The beverage industry is another significant segment, with increasing usage in both alcoholic and non-alcoholic beverages.
Smoked Flavorings Product Developments
Recent product developments in the smoked flavorings market focus on enhancing naturalness, clean labeling, and flavor stability. Companies are leveraging advanced extraction techniques and innovative processing methods to create more authentic and nuanced smoky flavor profiles. The increasing demand for clean-label ingredients is prompting manufacturers to develop smoked flavorings derived from natural sources and without artificial additives. These innovations are aimed at meeting evolving consumer preferences and stringent regulatory requirements.
Key Drivers of Smoked Flavorings Growth
The smoked flavorings market’s growth is primarily driven by several key factors:
- Increasing demand for processed foods: The rising consumption of processed foods worldwide fuels the demand for flavor enhancers like smoked flavorings.
- Technological advancements: Innovative extraction and processing methods improve flavor quality and efficiency.
- Expanding food and beverage industry: The continuous growth of the food and beverage industry creates vast opportunities for smoked flavorings.
- Health-conscious consumer trends: Demand for natural and clean-label smoked flavorings is on the rise.
Challenges in the Smoked Flavorings Market
The market faces certain challenges, including:
- Stringent regulations: Compliance with stringent food safety and labeling regulations can be costly and time-consuming.
- Fluctuating raw material prices: Variations in the cost of raw materials can impact profitability.
- Intense competition: The market is intensely competitive, with numerous players vying for market share. This limits profit margins.
- Consumer preference for natural alternatives: The growing consumer preference for natural alternatives can put pressure on synthetic smoked flavorings.
Emerging Opportunities in Smoked Flavorings
Significant long-term growth opportunities exist in the smoked flavorings market. Expansion into emerging economies with increasing consumer spending presents significant potential. The development of innovative flavor profiles and delivery systems offers further growth avenues. Strategic partnerships and collaborations between flavor manufacturers and food processing companies can unlock market synergies. The integration of sustainable and eco-friendly practices can provide a competitive edge.
Leading Players in the Smoked Flavorings Sector
- Kerry Red Arrow
- Baumer Foods
- Azelis
- B&G Foods
- Ruitenberg
- QST Smoke Flavors
- MSK
- Flavourstream
- Besmoke
- Frutarom Savory Solutions
- SOSA
- Colgin
- Create Flavors
- Jinan Hua Lu Food
Key Milestones in Smoked Flavorings Industry
- 2020: Launch of a new line of clean-label smoked flavorings by Kerry Red Arrow.
- 2021: Acquisition of a smaller flavor company by Azelis, expanding its product portfolio.
- 2022: Introduction of a novel smoked flavor extraction technology by QST Smoke Flavors.
- 2023: Increased focus on sustainability by several leading players in the industry, resulting in environmentally friendly production processes.
- 2024: Several key players expanding production facilities to cater to growing demand.
Strategic Outlook for Smoked Flavorings Market
The smoked flavorings market is poised for continued growth, driven by sustained demand from the food and beverage industry, coupled with ongoing innovation. Strategic investments in research and development, focusing on natural and clean-label solutions, will be critical for success. Expanding into new geographical markets and forging strategic alliances will further unlock market potential and ensure long-term growth.
Smoked Flavorings Segmentation
-
1. Application
- 1.1. Online Sales
- 1.2. Offline Sales
-
2. Type
- 2.1. Hickory Liquid Smoke
- 2.2. Mesquite Liquid Smoke
- 2.3. Applewood Liquid Smoke
- 2.4. Others
Smoked Flavorings Segmentation By Geography
-
1. North America
- 1.1. United States
- 1.2. Canada
- 1.3. Mexico
-
2. South America
- 2.1. Brazil
- 2.2. Argentina
- 2.3. Rest of South America
-
3. Europe
- 3.1. United Kingdom
- 3.2. Germany
- 3.3. France
- 3.4. Italy
- 3.5. Spain
- 3.6. Russia
- 3.7. Benelux
- 3.8. Nordics
- 3.9. Rest of Europe
-
4. Middle East & Africa
- 4.1. Turkey
- 4.2. Israel
- 4.3. GCC
- 4.4. North Africa
- 4.5. South Africa
- 4.6. Rest of Middle East & Africa
-
5. Asia Pacific
- 5.1. China
- 5.2. India
- 5.3. Japan
- 5.4. South Korea
- 5.5. ASEAN
- 5.6. Oceania
- 5.7. Rest of Asia Pacific
Smoked Flavorings Regional Market Share
Geographic Coverage of Smoked Flavorings
Smoked Flavorings REPORT HIGHLIGHTS
| Aspects | Details |
|---|---|
| Study Period | 2020-2034 |
| Base Year | 2025 |
| Estimated Year | 2026 |
| Forecast Period | 2026-2034 |
| Historical Period | 2020-2025 |
| Growth Rate | CAGR of 3.2% from 2020-2034 |
| Segmentation |
|
Table of Contents
- 1. Introduction
- 1.1. Research Scope
- 1.2. Market Segmentation
- 1.3. Research Methodology
- 1.4. Definitions and Assumptions
- 2. Executive Summary
- 2.1. Introduction
- 3. Market Dynamics
- 3.1. Introduction
- 3.2. Market Drivers
- 3.3. Market Restrains
- 3.4. Market Trends
- 4. Market Factor Analysis
- 4.1. Porters Five Forces
- 4.2. Supply/Value Chain
- 4.3. PESTEL analysis
- 4.4. Market Entropy
- 4.5. Patent/Trademark Analysis
- 5. Global Smoked Flavorings Analysis, Insights and Forecast, 2020-2032
- 5.1. Market Analysis, Insights and Forecast - by Application
- 5.1.1. Online Sales
- 5.1.2. Offline Sales
- 5.2. Market Analysis, Insights and Forecast - by Type
- 5.2.1. Hickory Liquid Smoke
- 5.2.2. Mesquite Liquid Smoke
- 5.2.3. Applewood Liquid Smoke
- 5.2.4. Others
- 5.3. Market Analysis, Insights and Forecast - by Region
- 5.3.1. North America
- 5.3.2. South America
- 5.3.3. Europe
- 5.3.4. Middle East & Africa
- 5.3.5. Asia Pacific
- 5.1. Market Analysis, Insights and Forecast - by Application
- 6. North America Smoked Flavorings Analysis, Insights and Forecast, 2020-2032
- 6.1. Market Analysis, Insights and Forecast - by Application
- 6.1.1. Online Sales
- 6.1.2. Offline Sales
- 6.2. Market Analysis, Insights and Forecast - by Type
- 6.2.1. Hickory Liquid Smoke
- 6.2.2. Mesquite Liquid Smoke
- 6.2.3. Applewood Liquid Smoke
- 6.2.4. Others
- 6.1. Market Analysis, Insights and Forecast - by Application
- 7. South America Smoked Flavorings Analysis, Insights and Forecast, 2020-2032
- 7.1. Market Analysis, Insights and Forecast - by Application
- 7.1.1. Online Sales
- 7.1.2. Offline Sales
- 7.2. Market Analysis, Insights and Forecast - by Type
- 7.2.1. Hickory Liquid Smoke
- 7.2.2. Mesquite Liquid Smoke
- 7.2.3. Applewood Liquid Smoke
- 7.2.4. Others
- 7.1. Market Analysis, Insights and Forecast - by Application
- 8. Europe Smoked Flavorings Analysis, Insights and Forecast, 2020-2032
- 8.1. Market Analysis, Insights and Forecast - by Application
- 8.1.1. Online Sales
- 8.1.2. Offline Sales
- 8.2. Market Analysis, Insights and Forecast - by Type
- 8.2.1. Hickory Liquid Smoke
- 8.2.2. Mesquite Liquid Smoke
- 8.2.3. Applewood Liquid Smoke
- 8.2.4. Others
- 8.1. Market Analysis, Insights and Forecast - by Application
- 9. Middle East & Africa Smoked Flavorings Analysis, Insights and Forecast, 2020-2032
- 9.1. Market Analysis, Insights and Forecast - by Application
- 9.1.1. Online Sales
- 9.1.2. Offline Sales
- 9.2. Market Analysis, Insights and Forecast - by Type
- 9.2.1. Hickory Liquid Smoke
- 9.2.2. Mesquite Liquid Smoke
- 9.2.3. Applewood Liquid Smoke
- 9.2.4. Others
- 9.1. Market Analysis, Insights and Forecast - by Application
- 10. Asia Pacific Smoked Flavorings Analysis, Insights and Forecast, 2020-2032
- 10.1. Market Analysis, Insights and Forecast - by Application
- 10.1.1. Online Sales
- 10.1.2. Offline Sales
- 10.2. Market Analysis, Insights and Forecast - by Type
- 10.2.1. Hickory Liquid Smoke
- 10.2.2. Mesquite Liquid Smoke
- 10.2.3. Applewood Liquid Smoke
- 10.2.4. Others
- 10.1. Market Analysis, Insights and Forecast - by Application
- 11. Competitive Analysis
- 11.1. Global Market Share Analysis 2025
- 11.2. Company Profiles
- 11.2.1 Kerry Red Arrow
- 11.2.1.1. Overview
- 11.2.1.2. Products
- 11.2.1.3. SWOT Analysis
- 11.2.1.4. Recent Developments
- 11.2.1.5. Financials (Based on Availability)
- 11.2.2 Baumer Foods
- 11.2.2.1. Overview
- 11.2.2.2. Products
- 11.2.2.3. SWOT Analysis
- 11.2.2.4. Recent Developments
- 11.2.2.5. Financials (Based on Availability)
- 11.2.3 Azelis
- 11.2.3.1. Overview
- 11.2.3.2. Products
- 11.2.3.3. SWOT Analysis
- 11.2.3.4. Recent Developments
- 11.2.3.5. Financials (Based on Availability)
- 11.2.4 B&G Foods
- 11.2.4.1. Overview
- 11.2.4.2. Products
- 11.2.4.3. SWOT Analysis
- 11.2.4.4. Recent Developments
- 11.2.4.5. Financials (Based on Availability)
- 11.2.5 Ruitenberg
- 11.2.5.1. Overview
- 11.2.5.2. Products
- 11.2.5.3. SWOT Analysis
- 11.2.5.4. Recent Developments
- 11.2.5.5. Financials (Based on Availability)
- 11.2.6 QST Smoke Flavors
- 11.2.6.1. Overview
- 11.2.6.2. Products
- 11.2.6.3. SWOT Analysis
- 11.2.6.4. Recent Developments
- 11.2.6.5. Financials (Based on Availability)
- 11.2.7 MSK
- 11.2.7.1. Overview
- 11.2.7.2. Products
- 11.2.7.3. SWOT Analysis
- 11.2.7.4. Recent Developments
- 11.2.7.5. Financials (Based on Availability)
- 11.2.8 Flavourstream
- 11.2.8.1. Overview
- 11.2.8.2. Products
- 11.2.8.3. SWOT Analysis
- 11.2.8.4. Recent Developments
- 11.2.8.5. Financials (Based on Availability)
- 11.2.9 Besmoke
- 11.2.9.1. Overview
- 11.2.9.2. Products
- 11.2.9.3. SWOT Analysis
- 11.2.9.4. Recent Developments
- 11.2.9.5. Financials (Based on Availability)
- 11.2.10 Frutarom Savory Solutions
- 11.2.10.1. Overview
- 11.2.10.2. Products
- 11.2.10.3. SWOT Analysis
- 11.2.10.4. Recent Developments
- 11.2.10.5. Financials (Based on Availability)
- 11.2.11 SOSA
- 11.2.11.1. Overview
- 11.2.11.2. Products
- 11.2.11.3. SWOT Analysis
- 11.2.11.4. Recent Developments
- 11.2.11.5. Financials (Based on Availability)
- 11.2.12 Colgin
- 11.2.12.1. Overview
- 11.2.12.2. Products
- 11.2.12.3. SWOT Analysis
- 11.2.12.4. Recent Developments
- 11.2.12.5. Financials (Based on Availability)
- 11.2.13 Create Flavors
- 11.2.13.1. Overview
- 11.2.13.2. Products
- 11.2.13.3. SWOT Analysis
- 11.2.13.4. Recent Developments
- 11.2.13.5. Financials (Based on Availability)
- 11.2.14 Jinan Hua Lu Food
- 11.2.14.1. Overview
- 11.2.14.2. Products
- 11.2.14.3. SWOT Analysis
- 11.2.14.4. Recent Developments
- 11.2.14.5. Financials (Based on Availability)
- 11.2.1 Kerry Red Arrow
List of Figures
- Figure 1: Global Smoked Flavorings Revenue Breakdown (million, %) by Region 2025 & 2033
- Figure 2: North America Smoked Flavorings Revenue (million), by Application 2025 & 2033
- Figure 3: North America Smoked Flavorings Revenue Share (%), by Application 2025 & 2033
- Figure 4: North America Smoked Flavorings Revenue (million), by Type 2025 & 2033
- Figure 5: North America Smoked Flavorings Revenue Share (%), by Type 2025 & 2033
- Figure 6: North America Smoked Flavorings Revenue (million), by Country 2025 & 2033
- Figure 7: North America Smoked Flavorings Revenue Share (%), by Country 2025 & 2033
- Figure 8: South America Smoked Flavorings Revenue (million), by Application 2025 & 2033
- Figure 9: South America Smoked Flavorings Revenue Share (%), by Application 2025 & 2033
- Figure 10: South America Smoked Flavorings Revenue (million), by Type 2025 & 2033
- Figure 11: South America Smoked Flavorings Revenue Share (%), by Type 2025 & 2033
- Figure 12: South America Smoked Flavorings Revenue (million), by Country 2025 & 2033
- Figure 13: South America Smoked Flavorings Revenue Share (%), by Country 2025 & 2033
- Figure 14: Europe Smoked Flavorings Revenue (million), by Application 2025 & 2033
- Figure 15: Europe Smoked Flavorings Revenue Share (%), by Application 2025 & 2033
- Figure 16: Europe Smoked Flavorings Revenue (million), by Type 2025 & 2033
- Figure 17: Europe Smoked Flavorings Revenue Share (%), by Type 2025 & 2033
- Figure 18: Europe Smoked Flavorings Revenue (million), by Country 2025 & 2033
- Figure 19: Europe Smoked Flavorings Revenue Share (%), by Country 2025 & 2033
- Figure 20: Middle East & Africa Smoked Flavorings Revenue (million), by Application 2025 & 2033
- Figure 21: Middle East & Africa Smoked Flavorings Revenue Share (%), by Application 2025 & 2033
- Figure 22: Middle East & Africa Smoked Flavorings Revenue (million), by Type 2025 & 2033
- Figure 23: Middle East & Africa Smoked Flavorings Revenue Share (%), by Type 2025 & 2033
- Figure 24: Middle East & Africa Smoked Flavorings Revenue (million), by Country 2025 & 2033
- Figure 25: Middle East & Africa Smoked Flavorings Revenue Share (%), by Country 2025 & 2033
- Figure 26: Asia Pacific Smoked Flavorings Revenue (million), by Application 2025 & 2033
- Figure 27: Asia Pacific Smoked Flavorings Revenue Share (%), by Application 2025 & 2033
- Figure 28: Asia Pacific Smoked Flavorings Revenue (million), by Type 2025 & 2033
- Figure 29: Asia Pacific Smoked Flavorings Revenue Share (%), by Type 2025 & 2033
- Figure 30: Asia Pacific Smoked Flavorings Revenue (million), by Country 2025 & 2033
- Figure 31: Asia Pacific Smoked Flavorings Revenue Share (%), by Country 2025 & 2033
List of Tables
- Table 1: Global Smoked Flavorings Revenue million Forecast, by Application 2020 & 2033
- Table 2: Global Smoked Flavorings Revenue million Forecast, by Type 2020 & 2033
- Table 3: Global Smoked Flavorings Revenue million Forecast, by Region 2020 & 2033
- Table 4: Global Smoked Flavorings Revenue million Forecast, by Application 2020 & 2033
- Table 5: Global Smoked Flavorings Revenue million Forecast, by Type 2020 & 2033
- Table 6: Global Smoked Flavorings Revenue million Forecast, by Country 2020 & 2033
- Table 7: United States Smoked Flavorings Revenue (million) Forecast, by Application 2020 & 2033
- Table 8: Canada Smoked Flavorings Revenue (million) Forecast, by Application 2020 & 2033
- Table 9: Mexico Smoked Flavorings Revenue (million) Forecast, by Application 2020 & 2033
- Table 10: Global Smoked Flavorings Revenue million Forecast, by Application 2020 & 2033
- Table 11: Global Smoked Flavorings Revenue million Forecast, by Type 2020 & 2033
- Table 12: Global Smoked Flavorings Revenue million Forecast, by Country 2020 & 2033
- Table 13: Brazil Smoked Flavorings Revenue (million) Forecast, by Application 2020 & 2033
- Table 14: Argentina Smoked Flavorings Revenue (million) Forecast, by Application 2020 & 2033
- Table 15: Rest of South America Smoked Flavorings Revenue (million) Forecast, by Application 2020 & 2033
- Table 16: Global Smoked Flavorings Revenue million Forecast, by Application 2020 & 2033
- Table 17: Global Smoked Flavorings Revenue million Forecast, by Type 2020 & 2033
- Table 18: Global Smoked Flavorings Revenue million Forecast, by Country 2020 & 2033
- Table 19: United Kingdom Smoked Flavorings Revenue (million) Forecast, by Application 2020 & 2033
- Table 20: Germany Smoked Flavorings Revenue (million) Forecast, by Application 2020 & 2033
- Table 21: France Smoked Flavorings Revenue (million) Forecast, by Application 2020 & 2033
- Table 22: Italy Smoked Flavorings Revenue (million) Forecast, by Application 2020 & 2033
- Table 23: Spain Smoked Flavorings Revenue (million) Forecast, by Application 2020 & 2033
- Table 24: Russia Smoked Flavorings Revenue (million) Forecast, by Application 2020 & 2033
- Table 25: Benelux Smoked Flavorings Revenue (million) Forecast, by Application 2020 & 2033
- Table 26: Nordics Smoked Flavorings Revenue (million) Forecast, by Application 2020 & 2033
- Table 27: Rest of Europe Smoked Flavorings Revenue (million) Forecast, by Application 2020 & 2033
- Table 28: Global Smoked Flavorings Revenue million Forecast, by Application 2020 & 2033
- Table 29: Global Smoked Flavorings Revenue million Forecast, by Type 2020 & 2033
- Table 30: Global Smoked Flavorings Revenue million Forecast, by Country 2020 & 2033
- Table 31: Turkey Smoked Flavorings Revenue (million) Forecast, by Application 2020 & 2033
- Table 32: Israel Smoked Flavorings Revenue (million) Forecast, by Application 2020 & 2033
- Table 33: GCC Smoked Flavorings Revenue (million) Forecast, by Application 2020 & 2033
- Table 34: North Africa Smoked Flavorings Revenue (million) Forecast, by Application 2020 & 2033
- Table 35: South Africa Smoked Flavorings Revenue (million) Forecast, by Application 2020 & 2033
- Table 36: Rest of Middle East & Africa Smoked Flavorings Revenue (million) Forecast, by Application 2020 & 2033
- Table 37: Global Smoked Flavorings Revenue million Forecast, by Application 2020 & 2033
- Table 38: Global Smoked Flavorings Revenue million Forecast, by Type 2020 & 2033
- Table 39: Global Smoked Flavorings Revenue million Forecast, by Country 2020 & 2033
- Table 40: China Smoked Flavorings Revenue (million) Forecast, by Application 2020 & 2033
- Table 41: India Smoked Flavorings Revenue (million) Forecast, by Application 2020 & 2033
- Table 42: Japan Smoked Flavorings Revenue (million) Forecast, by Application 2020 & 2033
- Table 43: South Korea Smoked Flavorings Revenue (million) Forecast, by Application 2020 & 2033
- Table 44: ASEAN Smoked Flavorings Revenue (million) Forecast, by Application 2020 & 2033
- Table 45: Oceania Smoked Flavorings Revenue (million) Forecast, by Application 2020 & 2033
- Table 46: Rest of Asia Pacific Smoked Flavorings Revenue (million) Forecast, by Application 2020 & 2033
Frequently Asked Questions
1. What is the projected Compound Annual Growth Rate (CAGR) of the Smoked Flavorings?
The projected CAGR is approximately 3.2%.
2. Which companies are prominent players in the Smoked Flavorings?
Key companies in the market include Kerry Red Arrow, Baumer Foods, Azelis, B&G Foods, Ruitenberg, QST Smoke Flavors, MSK, Flavourstream, Besmoke, Frutarom Savory Solutions, SOSA, Colgin, Create Flavors, Jinan Hua Lu Food.
3. What are the main segments of the Smoked Flavorings?
The market segments include Application, Type.
4. Can you provide details about the market size?
The market size is estimated to be USD 97 million as of 2022.
5. What are some drivers contributing to market growth?
N/A
6. What are the notable trends driving market growth?
N/A
7. Are there any restraints impacting market growth?
N/A
8. Can you provide examples of recent developments in the market?
N/A
9. What pricing options are available for accessing the report?
Pricing options include single-user, multi-user, and enterprise licenses priced at USD 2900.00, USD 4350.00, and USD 5800.00 respectively.
10. Is the market size provided in terms of value or volume?
The market size is provided in terms of value, measured in million.
11. Are there any specific market keywords associated with the report?
Yes, the market keyword associated with the report is "Smoked Flavorings," which aids in identifying and referencing the specific market segment covered.
12. How do I determine which pricing option suits my needs best?
The pricing options vary based on user requirements and access needs. Individual users may opt for single-user licenses, while businesses requiring broader access may choose multi-user or enterprise licenses for cost-effective access to the report.
13. Are there any additional resources or data provided in the Smoked Flavorings report?
While the report offers comprehensive insights, it's advisable to review the specific contents or supplementary materials provided to ascertain if additional resources or data are available.
14. How can I stay updated on further developments or reports in the Smoked Flavorings?
To stay informed about further developments, trends, and reports in the Smoked Flavorings, consider subscribing to industry newsletters, following relevant companies and organizations, or regularly checking reputable industry news sources and publications.
Methodology
Step 1 - Identification of Relevant Samples Size from Population Database


Step 2 - Approaches for Defining Global Market Size (Value, Volume* & Price*)

Note*: In applicable scenarios
Step 3 - Data Sources
Primary Research
- Web Analytics
- Survey Reports
- Research Institute
- Latest Research Reports
- Opinion Leaders
Secondary Research
- Annual Reports
- White Paper
- Latest Press Release
- Industry Association
- Paid Database
- Investor Presentations

Step 4 - Data Triangulation
Involves using different sources of information in order to increase the validity of a study
These sources are likely to be stakeholders in a program - participants, other researchers, program staff, other community members, and so on.
Then we put all data in single framework & apply various statistical tools to find out the dynamic on the market.
During the analysis stage, feedback from the stakeholder groups would be compared to determine areas of agreement as well as areas of divergence