

Key Insights
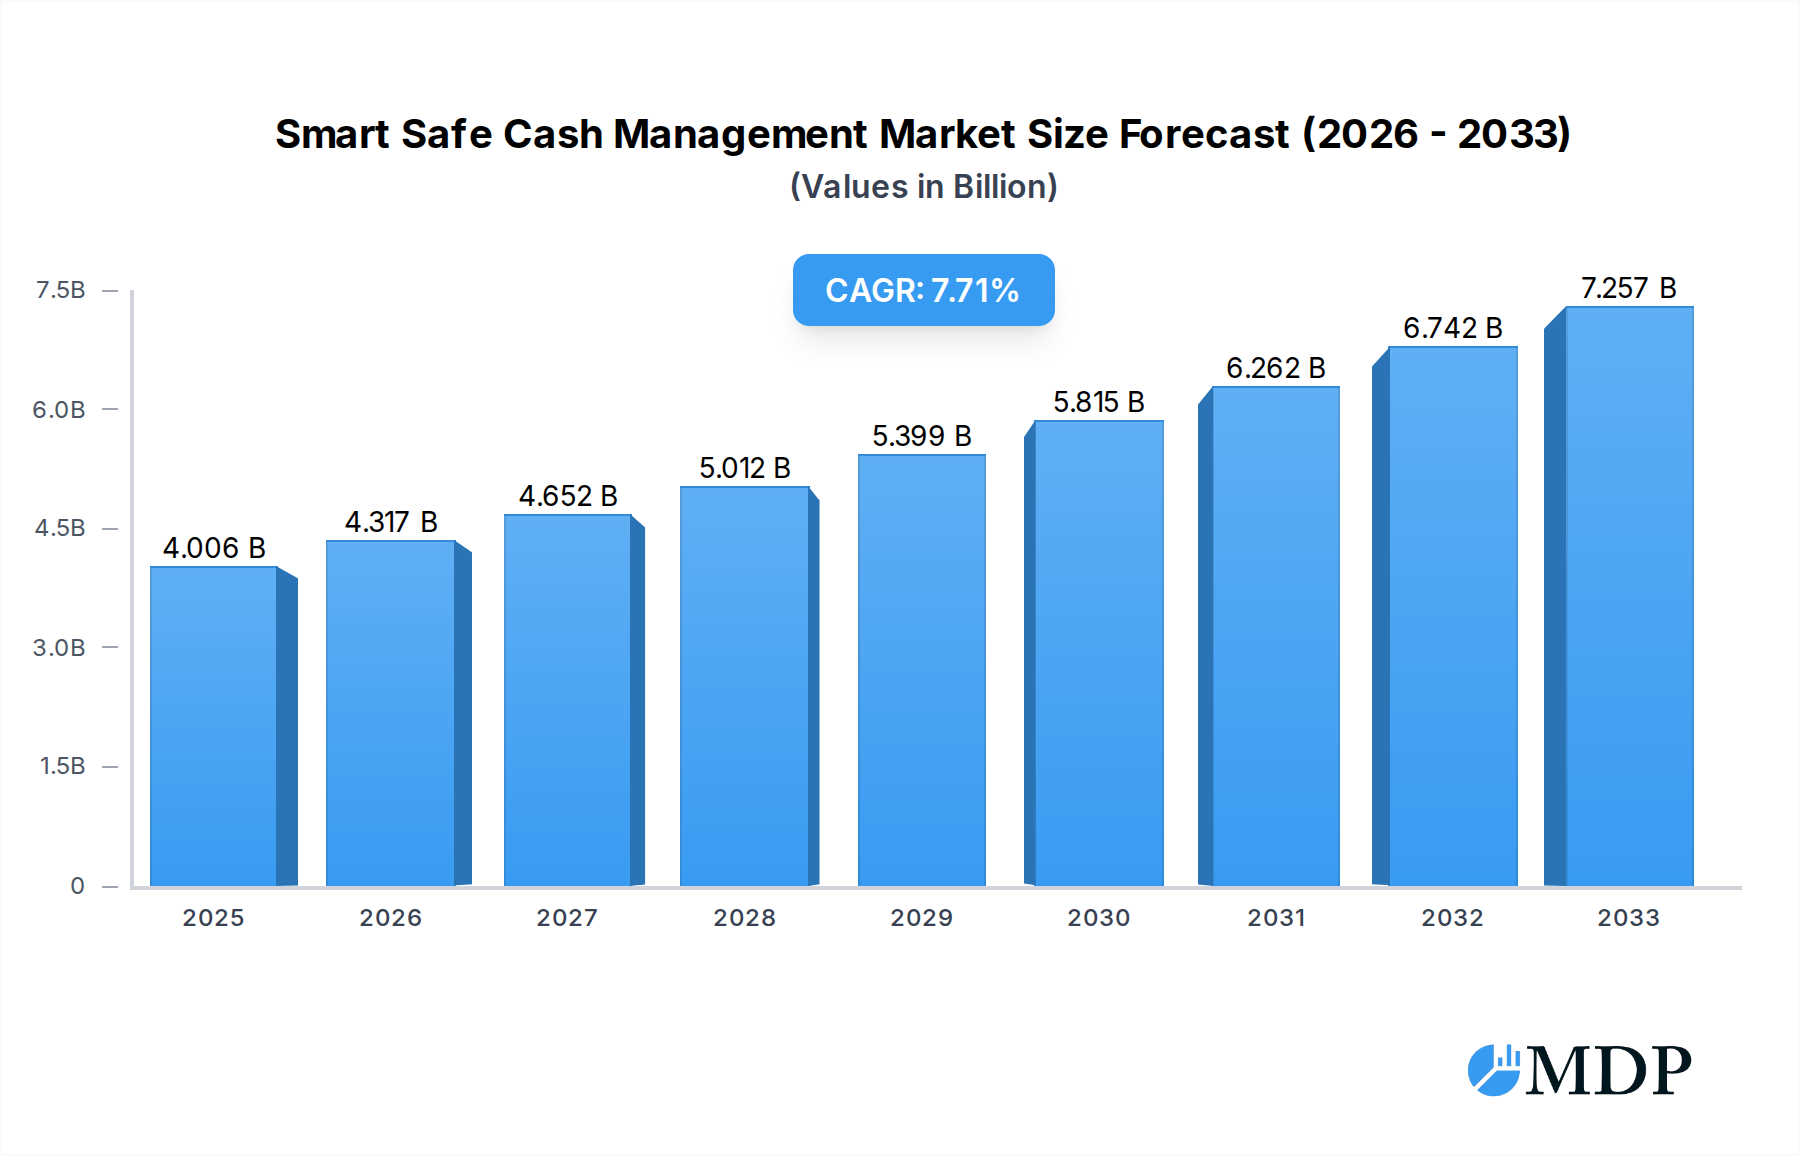
The global Smart Safe Cash Management market is poised for significant expansion, projected to reach $4006.07 million in 2025. This robust growth is fueled by an estimated Compound Annual Growth Rate (CAGR) of 7.69% over the forecast period of 2025-2033. The increasing need for enhanced security, operational efficiency, and reduced cash handling risks across various sectors, including financial institutions, retail, and government organizations, are the primary drivers. Technological advancements in smart safe hardware, such as enhanced sensor technology, real-time tracking, and remote management capabilities, alongside sophisticated software solutions for inventory tracking, reconciliation, and analytics, are further propelling market adoption. The growing adoption of cashless payment methods in some segments is a notable restraint, but the sheer volume of cash transactions, especially in emerging economies and specific sectors like hospitality and government, ensures continued demand for efficient cash management solutions.

Smart Safe Cash Management Market Size (In Billion)
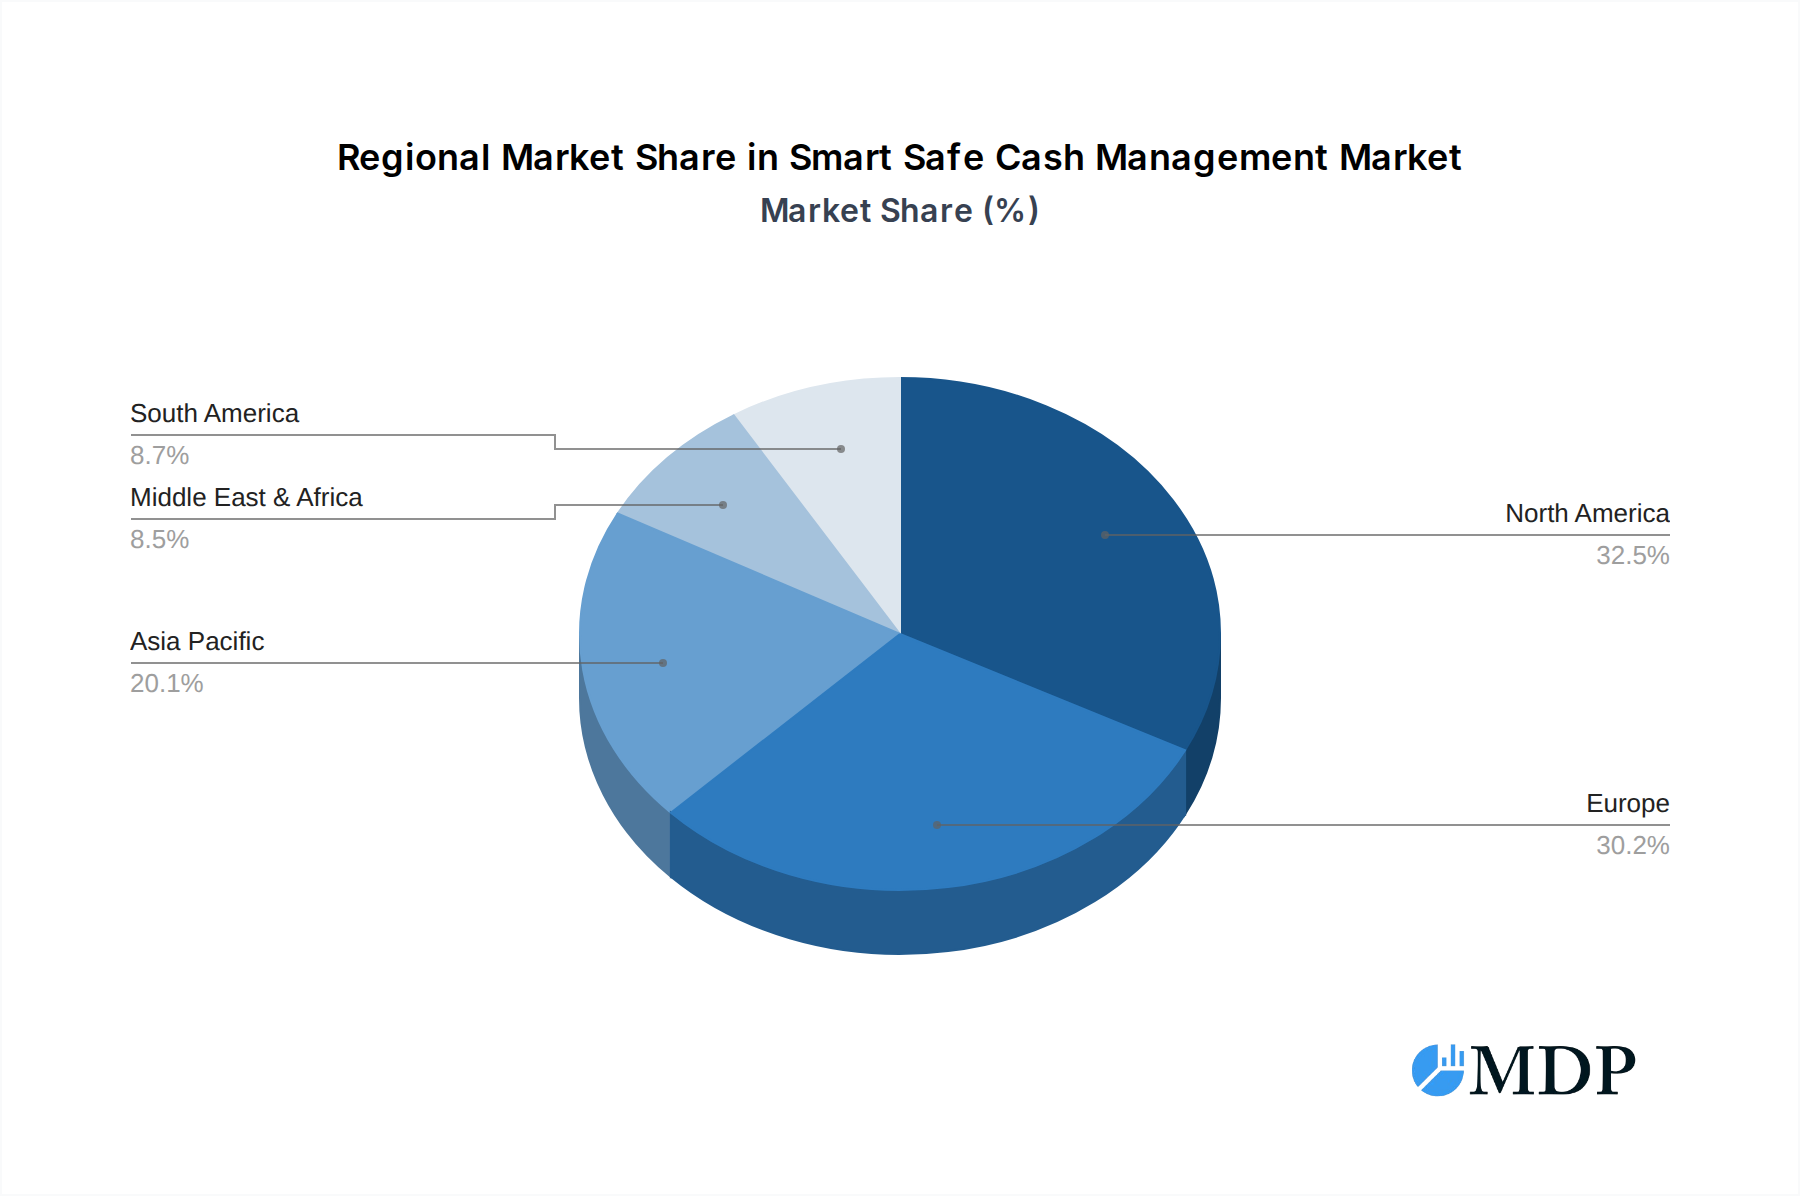
The market's segmentation highlights a strong demand for both hardware and software components, with applications spanning financial institutions, retail establishments, hotels, restaurants, and government organizations. Leading players like Fiserv, Glory, Brink's, and G4S are actively innovating and expanding their offerings to cater to these diverse needs. Geographically, North America and Europe currently dominate the market, driven by early adoption of advanced technologies and stringent regulatory environments. However, the Asia Pacific region is expected to witness the fastest growth due to rapid economic development, a burgeoning retail sector, and increasing adoption of modern cash management practices. The Middle East & Africa and South America also present substantial untapped potential. The market's trajectory indicates a shift towards integrated, intelligent cash management systems that offer end-to-end visibility and control.
Smart Safe Cash Management Company Market Share
Smart Safe Cash Management Market Report: In-Depth Analysis and Future Outlook (2019-2033)
This comprehensive report provides an exhaustive analysis of the global Smart Safe Cash Management market, covering its dynamics, trends, leading segments, product innovations, growth drivers, challenges, opportunities, key players, and future strategic outlook. Designed for industry stakeholders including financial institutions, retail businesses, hospitality providers, and government organizations, this report offers actionable insights based on extensive research and data analysis from 2019 to 2033, with a base year of 2025 and a forecast period of 2025-2033. The market is estimated to reach 15 million in 2025.
Smart Safe Cash Management Market Dynamics & Concentration
The Smart Safe Cash Management market is characterized by a moderate to high concentration, with a few key players holding significant market share. Innovation remains a primary driver, fueled by advancements in IoT, AI, and cloud computing, enabling enhanced security, real-time tracking, and automated reconciliation. Regulatory frameworks, particularly those concerning cash handling, data security, and anti-money laundering, play a crucial role in shaping market adoption and product development. Product substitutes, such as digital payment solutions, present a competitive challenge, though the inherent need for secure cash handling in certain sectors ensures continued demand for smart safes. End-user trends highlight a growing preference for integrated solutions that streamline cash operations, reduce operational costs, and minimize risk. Merger and acquisition (M&A) activities are present, as larger entities seek to expand their product portfolios and market reach. We anticipate 5 significant M&A deals over the forecast period, driven by consolidation and the pursuit of technological synergies.
Smart Safe Cash Management Industry Trends & Analysis
The global Smart Safe Cash Management market is poised for substantial growth, driven by an increasing need for enhanced security, operational efficiency, and reduced cash handling risks across various industries. The market is projected to experience a Compound Annual Growth Rate (CAGR) of 12% from 2025 to 2033. Technological disruptions, including the integration of advanced sensors, biometric authentication, AI-powered analytics for fraud detection, and seamless connectivity through IoT platforms, are transforming the capabilities of smart safes. Consumer preferences are shifting towards solutions that offer real-time inventory management, automated cash deposit and dispensing, and robust audit trails, thereby minimizing manual intervention and potential errors. Competitive dynamics are intensifying, with established hardware providers increasingly incorporating sophisticated software solutions and data analytics into their offerings, while software companies are exploring partnerships for hardware integration. The market penetration of smart safes is expected to rise significantly, particularly within the retail and financial sectors, as businesses recognize the tangible benefits in terms of cost savings and improved security. The estimated market size in 2025 is 15 million, projected to reach 35 million by the end of the forecast period in 2033.
Leading Markets & Segments in Smart Safe Cash Management
The Retail segment is anticipated to dominate the Smart Safe Cash Management market, driven by the high volume of cash transactions and the inherent need for secure and efficient cash handling. Within this segment, countries with robust economies and high retail penetration, such as the United States and major European nations, will represent the leading markets. The Hardware type segment currently holds the largest market share, owing to the foundational requirement of physical smart safe units. However, the Software segment is expected to witness the highest growth rate as advanced functionalities like remote monitoring, data analytics, and integration with POS systems become increasingly critical.
- Key Drivers for Retail Dominance:
- Increasing crime rates and the need for deterrence.
- Labor cost reduction through automation of cash handling.
- Improved inventory management and reconciliation accuracy.
- Growing adoption of cashless payment methods necessitates efficient management of residual cash.
- Dominance of Hardware Segment:
- Established infrastructure and a proven track record of reliability.
- Capital investment in physical security solutions.
- The ongoing need for secure physical storage of cash.
- Rapid Growth of Software Segment:
- Demand for value-added services beyond simple storage.
- Integration capabilities with existing business systems.
- Advanced analytics for business intelligence and fraud prevention.
- The estimated market size for hardware in 2025 is 10 million, while software is 5 million.
Smart Safe Cash Management Product Developments
Product innovations in Smart Safe Cash Management are rapidly evolving. Companies are integrating advanced features such as real-time inventory tracking, remote access and monitoring via mobile applications, sophisticated biometric security, and AI-driven anomaly detection for enhanced fraud prevention. The integration of IoT capabilities allows for seamless data flow and connectivity with broader business management systems. Competitive advantages are being built around user-friendly interfaces, robust data analytics for operational insights, and customizable solutions tailored to specific industry needs. For instance, Halma PLC (Volumatic) is focusing on intelligent cash management solutions that reduce manual handling and improve accuracy, while Hyosung and Triton are enhancing their ATM and cash recycler offerings with advanced security and data management features.
Key Drivers of Smart Safe Cash Management Growth
Several key drivers are propelling the growth of the Smart Safe Cash Management market. Technologically, the increasing adoption of IoT, AI, and cloud computing is enabling smarter, more connected, and data-rich cash management solutions. Economically, businesses are seeking to reduce operational costs associated with cash handling, minimize losses due to theft or errors, and improve overall efficiency. Regulatory factors, such as stringent compliance requirements for cash handling and data security, are also compelling organizations to invest in advanced smart safe systems. The growing trend of digitalization across industries, while promoting cashless payments, also necessitates more sophisticated management of the remaining cash flow. The market is expected to grow by 10 million in value from 2025 to 2033.
Challenges in the Smart Safe Cash Management Market
Despite robust growth, the Smart Safe Cash Management market faces several challenges. High initial investment costs for advanced smart safe systems can be a barrier for smaller businesses. Cybersecurity threats and the need for robust data protection are significant concerns, requiring continuous investment in security measures. Supply chain disruptions, as seen in recent global events, can impact the availability and cost of hardware components. Furthermore, the increasing popularity of cashless transactions, while not eliminating the need for cash management, can slow down the adoption rate in certain sectors. The competitive pressure among manufacturers also leads to pricing challenges. We estimate these challenges will collectively reduce potential growth by 5% annually.
Emerging Opportunities in Smart Safe Cash Management
Emerging opportunities in the Smart Safe Cash Management market are primarily driven by technological breakthroughs and strategic market expansion. The development of more affordable and scalable IoT-enabled smart safes is opening up new market segments. Strategic partnerships between hardware manufacturers, software developers, and financial institutions can lead to integrated end-to-end cash management solutions. Furthermore, the expansion into emerging economies with growing retail and financial sectors presents significant untapped potential. The increasing focus on data analytics and business intelligence derived from cash management data offers a lucrative avenue for service innovation and revenue generation, with an estimated 20% growth in data-driven services.
Leading Players in the Smart Safe Cash Management Sector
- Fiserv
- Glory
- Brink's
- Loomis
- G4S
- Gunnebo
- Cennox
- Tidel
- Halma PLC (Volumatic)
- AMSEC
- Tellermate
- Hyosung
- Triton
- Ellenby Technologies
- Socal Safe
- Intimus International
- Armor Safe Technologies
- CIMA
Key Milestones in Smart Safe Cash Management Industry
- 2019: Increased adoption of IoT connectivity in smart safes for remote monitoring.
- 2020: Heightened focus on enhanced security features due to global security concerns.
- 2021: Introduction of AI-powered fraud detection algorithms in smart safe software.
- 2022: Growing integration with cloud-based platforms for data analytics and management.
- 2023: Expansion of smart safe solutions into smaller retail businesses and hospitality sectors.
- 2024: Significant advancements in biometric authentication technologies for smart safes.
Strategic Outlook for Smart Safe Cash Management Market
The strategic outlook for the Smart Safe Cash Management market is highly positive, with continued growth driven by technological advancements and increasing demand for operational efficiency. Key growth accelerators include the deeper integration of AI and machine learning for predictive analytics and fraud prevention, the expansion of cloud-based solutions offering greater scalability and accessibility, and the development of more sophisticated software functionalities that provide valuable business intelligence. Strategic partnerships and collaborations will be crucial for market players to offer comprehensive solutions. The market is expected to see a substantial increase in the adoption of advanced functionalities, moving beyond basic cash storage to intelligent cash management ecosystems, potentially increasing the market value by an additional 10 million.
Smart Safe Cash Management Segmentation
-
1. Application
- 1.1. Financial Institutions
- 1.2. Retail
- 1.3. Hotels
- 1.4. Restaurants
- 1.5. Government Organizations
- 1.6. Other
-
2. Type
- 2.1. Hardware
- 2.2. Software
Smart Safe Cash Management Segmentation By Geography
-
1. North America
- 1.1. United States
- 1.2. Canada
- 1.3. Mexico
-
2. South America
- 2.1. Brazil
- 2.2. Argentina
- 2.3. Rest of South America
-
3. Europe
- 3.1. United Kingdom
- 3.2. Germany
- 3.3. France
- 3.4. Italy
- 3.5. Spain
- 3.6. Russia
- 3.7. Benelux
- 3.8. Nordics
- 3.9. Rest of Europe
-
4. Middle East & Africa
- 4.1. Turkey
- 4.2. Israel
- 4.3. GCC
- 4.4. North Africa
- 4.5. South Africa
- 4.6. Rest of Middle East & Africa
-
5. Asia Pacific
- 5.1. China
- 5.2. India
- 5.3. Japan
- 5.4. South Korea
- 5.5. ASEAN
- 5.6. Oceania
- 5.7. Rest of Asia Pacific
Smart Safe Cash Management Regional Market Share
Geographic Coverage of Smart Safe Cash Management
Smart Safe Cash Management REPORT HIGHLIGHTS
| Aspects | Details |
|---|---|
| Study Period | 2020-2034 |
| Base Year | 2025 |
| Estimated Year | 2026 |
| Forecast Period | 2026-2034 |
| Historical Period | 2020-2025 |
| Growth Rate | CAGR of 7.69% from 2020-2034 |
| Segmentation |
|
Table of Contents
- 1. Introduction
- 1.1. Research Scope
- 1.2. Market Segmentation
- 1.3. Research Methodology
- 1.4. Definitions and Assumptions
- 2. Executive Summary
- 2.1. Introduction
- 3. Market Dynamics
- 3.1. Introduction
- 3.2. Market Drivers
- 3.3. Market Restrains
- 3.4. Market Trends
- 4. Market Factor Analysis
- 4.1. Porters Five Forces
- 4.2. Supply/Value Chain
- 4.3. PESTEL analysis
- 4.4. Market Entropy
- 4.5. Patent/Trademark Analysis
- 5. Global Smart Safe Cash Management Analysis, Insights and Forecast, 2020-2032
- 5.1. Market Analysis, Insights and Forecast - by Application
- 5.1.1. Financial Institutions
- 5.1.2. Retail
- 5.1.3. Hotels
- 5.1.4. Restaurants
- 5.1.5. Government Organizations
- 5.1.6. Other
- 5.2. Market Analysis, Insights and Forecast - by Type
- 5.2.1. Hardware
- 5.2.2. Software
- 5.3. Market Analysis, Insights and Forecast - by Region
- 5.3.1. North America
- 5.3.2. South America
- 5.3.3. Europe
- 5.3.4. Middle East & Africa
- 5.3.5. Asia Pacific
- 5.1. Market Analysis, Insights and Forecast - by Application
- 6. North America Smart Safe Cash Management Analysis, Insights and Forecast, 2020-2032
- 6.1. Market Analysis, Insights and Forecast - by Application
- 6.1.1. Financial Institutions
- 6.1.2. Retail
- 6.1.3. Hotels
- 6.1.4. Restaurants
- 6.1.5. Government Organizations
- 6.1.6. Other
- 6.2. Market Analysis, Insights and Forecast - by Type
- 6.2.1. Hardware
- 6.2.2. Software
- 6.1. Market Analysis, Insights and Forecast - by Application
- 7. South America Smart Safe Cash Management Analysis, Insights and Forecast, 2020-2032
- 7.1. Market Analysis, Insights and Forecast - by Application
- 7.1.1. Financial Institutions
- 7.1.2. Retail
- 7.1.3. Hotels
- 7.1.4. Restaurants
- 7.1.5. Government Organizations
- 7.1.6. Other
- 7.2. Market Analysis, Insights and Forecast - by Type
- 7.2.1. Hardware
- 7.2.2. Software
- 7.1. Market Analysis, Insights and Forecast - by Application
- 8. Europe Smart Safe Cash Management Analysis, Insights and Forecast, 2020-2032
- 8.1. Market Analysis, Insights and Forecast - by Application
- 8.1.1. Financial Institutions
- 8.1.2. Retail
- 8.1.3. Hotels
- 8.1.4. Restaurants
- 8.1.5. Government Organizations
- 8.1.6. Other
- 8.2. Market Analysis, Insights and Forecast - by Type
- 8.2.1. Hardware
- 8.2.2. Software
- 8.1. Market Analysis, Insights and Forecast - by Application
- 9. Middle East & Africa Smart Safe Cash Management Analysis, Insights and Forecast, 2020-2032
- 9.1. Market Analysis, Insights and Forecast - by Application
- 9.1.1. Financial Institutions
- 9.1.2. Retail
- 9.1.3. Hotels
- 9.1.4. Restaurants
- 9.1.5. Government Organizations
- 9.1.6. Other
- 9.2. Market Analysis, Insights and Forecast - by Type
- 9.2.1. Hardware
- 9.2.2. Software
- 9.1. Market Analysis, Insights and Forecast - by Application
- 10. Asia Pacific Smart Safe Cash Management Analysis, Insights and Forecast, 2020-2032
- 10.1. Market Analysis, Insights and Forecast - by Application
- 10.1.1. Financial Institutions
- 10.1.2. Retail
- 10.1.3. Hotels
- 10.1.4. Restaurants
- 10.1.5. Government Organizations
- 10.1.6. Other
- 10.2. Market Analysis, Insights and Forecast - by Type
- 10.2.1. Hardware
- 10.2.2. Software
- 10.1. Market Analysis, Insights and Forecast - by Application
- 11. Competitive Analysis
- 11.1. Global Market Share Analysis 2025
- 11.2. Company Profiles
- 11.2.1 Fiserv
- 11.2.1.1. Overview
- 11.2.1.2. Products
- 11.2.1.3. SWOT Analysis
- 11.2.1.4. Recent Developments
- 11.2.1.5. Financials (Based on Availability)
- 11.2.2 Glory
- 11.2.2.1. Overview
- 11.2.2.2. Products
- 11.2.2.3. SWOT Analysis
- 11.2.2.4. Recent Developments
- 11.2.2.5. Financials (Based on Availability)
- 11.2.3 Brink's
- 11.2.3.1. Overview
- 11.2.3.2. Products
- 11.2.3.3. SWOT Analysis
- 11.2.3.4. Recent Developments
- 11.2.3.5. Financials (Based on Availability)
- 11.2.4 Loomis
- 11.2.4.1. Overview
- 11.2.4.2. Products
- 11.2.4.3. SWOT Analysis
- 11.2.4.4. Recent Developments
- 11.2.4.5. Financials (Based on Availability)
- 11.2.5 G4S
- 11.2.5.1. Overview
- 11.2.5.2. Products
- 11.2.5.3. SWOT Analysis
- 11.2.5.4. Recent Developments
- 11.2.5.5. Financials (Based on Availability)
- 11.2.6 Gunnebo
- 11.2.6.1. Overview
- 11.2.6.2. Products
- 11.2.6.3. SWOT Analysis
- 11.2.6.4. Recent Developments
- 11.2.6.5. Financials (Based on Availability)
- 11.2.7 Cennox
- 11.2.7.1. Overview
- 11.2.7.2. Products
- 11.2.7.3. SWOT Analysis
- 11.2.7.4. Recent Developments
- 11.2.7.5. Financials (Based on Availability)
- 11.2.8 Tidel
- 11.2.8.1. Overview
- 11.2.8.2. Products
- 11.2.8.3. SWOT Analysis
- 11.2.8.4. Recent Developments
- 11.2.8.5. Financials (Based on Availability)
- 11.2.9 Halma PLC (Volumatic)
- 11.2.9.1. Overview
- 11.2.9.2. Products
- 11.2.9.3. SWOT Analysis
- 11.2.9.4. Recent Developments
- 11.2.9.5. Financials (Based on Availability)
- 11.2.10 AMSEC
- 11.2.10.1. Overview
- 11.2.10.2. Products
- 11.2.10.3. SWOT Analysis
- 11.2.10.4. Recent Developments
- 11.2.10.5. Financials (Based on Availability)
- 11.2.11 Tellermate
- 11.2.11.1. Overview
- 11.2.11.2. Products
- 11.2.11.3. SWOT Analysis
- 11.2.11.4. Recent Developments
- 11.2.11.5. Financials (Based on Availability)
- 11.2.12 Hyosung
- 11.2.12.1. Overview
- 11.2.12.2. Products
- 11.2.12.3. SWOT Analysis
- 11.2.12.4. Recent Developments
- 11.2.12.5. Financials (Based on Availability)
- 11.2.13 Triton
- 11.2.13.1. Overview
- 11.2.13.2. Products
- 11.2.13.3. SWOT Analysis
- 11.2.13.4. Recent Developments
- 11.2.13.5. Financials (Based on Availability)
- 11.2.14 Ellenby Technologies
- 11.2.14.1. Overview
- 11.2.14.2. Products
- 11.2.14.3. SWOT Analysis
- 11.2.14.4. Recent Developments
- 11.2.14.5. Financials (Based on Availability)
- 11.2.15 Socal Safe
- 11.2.15.1. Overview
- 11.2.15.2. Products
- 11.2.15.3. SWOT Analysis
- 11.2.15.4. Recent Developments
- 11.2.15.5. Financials (Based on Availability)
- 11.2.16 Intimus International
- 11.2.16.1. Overview
- 11.2.16.2. Products
- 11.2.16.3. SWOT Analysis
- 11.2.16.4. Recent Developments
- 11.2.16.5. Financials (Based on Availability)
- 11.2.17 Armor Safe Technologies
- 11.2.17.1. Overview
- 11.2.17.2. Products
- 11.2.17.3. SWOT Analysis
- 11.2.17.4. Recent Developments
- 11.2.17.5. Financials (Based on Availability)
- 11.2.18 CIMA
- 11.2.18.1. Overview
- 11.2.18.2. Products
- 11.2.18.3. SWOT Analysis
- 11.2.18.4. Recent Developments
- 11.2.18.5. Financials (Based on Availability)
- 11.2.1 Fiserv
List of Figures
- Figure 1: Global Smart Safe Cash Management Revenue Breakdown (million, %) by Region 2025 & 2033
- Figure 2: North America Smart Safe Cash Management Revenue (million), by Application 2025 & 2033
- Figure 3: North America Smart Safe Cash Management Revenue Share (%), by Application 2025 & 2033
- Figure 4: North America Smart Safe Cash Management Revenue (million), by Type 2025 & 2033
- Figure 5: North America Smart Safe Cash Management Revenue Share (%), by Type 2025 & 2033
- Figure 6: North America Smart Safe Cash Management Revenue (million), by Country 2025 & 2033
- Figure 7: North America Smart Safe Cash Management Revenue Share (%), by Country 2025 & 2033
- Figure 8: South America Smart Safe Cash Management Revenue (million), by Application 2025 & 2033
- Figure 9: South America Smart Safe Cash Management Revenue Share (%), by Application 2025 & 2033
- Figure 10: South America Smart Safe Cash Management Revenue (million), by Type 2025 & 2033
- Figure 11: South America Smart Safe Cash Management Revenue Share (%), by Type 2025 & 2033
- Figure 12: South America Smart Safe Cash Management Revenue (million), by Country 2025 & 2033
- Figure 13: South America Smart Safe Cash Management Revenue Share (%), by Country 2025 & 2033
- Figure 14: Europe Smart Safe Cash Management Revenue (million), by Application 2025 & 2033
- Figure 15: Europe Smart Safe Cash Management Revenue Share (%), by Application 2025 & 2033
- Figure 16: Europe Smart Safe Cash Management Revenue (million), by Type 2025 & 2033
- Figure 17: Europe Smart Safe Cash Management Revenue Share (%), by Type 2025 & 2033
- Figure 18: Europe Smart Safe Cash Management Revenue (million), by Country 2025 & 2033
- Figure 19: Europe Smart Safe Cash Management Revenue Share (%), by Country 2025 & 2033
- Figure 20: Middle East & Africa Smart Safe Cash Management Revenue (million), by Application 2025 & 2033
- Figure 21: Middle East & Africa Smart Safe Cash Management Revenue Share (%), by Application 2025 & 2033
- Figure 22: Middle East & Africa Smart Safe Cash Management Revenue (million), by Type 2025 & 2033
- Figure 23: Middle East & Africa Smart Safe Cash Management Revenue Share (%), by Type 2025 & 2033
- Figure 24: Middle East & Africa Smart Safe Cash Management Revenue (million), by Country 2025 & 2033
- Figure 25: Middle East & Africa Smart Safe Cash Management Revenue Share (%), by Country 2025 & 2033
- Figure 26: Asia Pacific Smart Safe Cash Management Revenue (million), by Application 2025 & 2033
- Figure 27: Asia Pacific Smart Safe Cash Management Revenue Share (%), by Application 2025 & 2033
- Figure 28: Asia Pacific Smart Safe Cash Management Revenue (million), by Type 2025 & 2033
- Figure 29: Asia Pacific Smart Safe Cash Management Revenue Share (%), by Type 2025 & 2033
- Figure 30: Asia Pacific Smart Safe Cash Management Revenue (million), by Country 2025 & 2033
- Figure 31: Asia Pacific Smart Safe Cash Management Revenue Share (%), by Country 2025 & 2033
List of Tables
- Table 1: Global Smart Safe Cash Management Revenue million Forecast, by Application 2020 & 2033
- Table 2: Global Smart Safe Cash Management Revenue million Forecast, by Type 2020 & 2033
- Table 3: Global Smart Safe Cash Management Revenue million Forecast, by Region 2020 & 2033
- Table 4: Global Smart Safe Cash Management Revenue million Forecast, by Application 2020 & 2033
- Table 5: Global Smart Safe Cash Management Revenue million Forecast, by Type 2020 & 2033
- Table 6: Global Smart Safe Cash Management Revenue million Forecast, by Country 2020 & 2033
- Table 7: United States Smart Safe Cash Management Revenue (million) Forecast, by Application 2020 & 2033
- Table 8: Canada Smart Safe Cash Management Revenue (million) Forecast, by Application 2020 & 2033
- Table 9: Mexico Smart Safe Cash Management Revenue (million) Forecast, by Application 2020 & 2033
- Table 10: Global Smart Safe Cash Management Revenue million Forecast, by Application 2020 & 2033
- Table 11: Global Smart Safe Cash Management Revenue million Forecast, by Type 2020 & 2033
- Table 12: Global Smart Safe Cash Management Revenue million Forecast, by Country 2020 & 2033
- Table 13: Brazil Smart Safe Cash Management Revenue (million) Forecast, by Application 2020 & 2033
- Table 14: Argentina Smart Safe Cash Management Revenue (million) Forecast, by Application 2020 & 2033
- Table 15: Rest of South America Smart Safe Cash Management Revenue (million) Forecast, by Application 2020 & 2033
- Table 16: Global Smart Safe Cash Management Revenue million Forecast, by Application 2020 & 2033
- Table 17: Global Smart Safe Cash Management Revenue million Forecast, by Type 2020 & 2033
- Table 18: Global Smart Safe Cash Management Revenue million Forecast, by Country 2020 & 2033
- Table 19: United Kingdom Smart Safe Cash Management Revenue (million) Forecast, by Application 2020 & 2033
- Table 20: Germany Smart Safe Cash Management Revenue (million) Forecast, by Application 2020 & 2033
- Table 21: France Smart Safe Cash Management Revenue (million) Forecast, by Application 2020 & 2033
- Table 22: Italy Smart Safe Cash Management Revenue (million) Forecast, by Application 2020 & 2033
- Table 23: Spain Smart Safe Cash Management Revenue (million) Forecast, by Application 2020 & 2033
- Table 24: Russia Smart Safe Cash Management Revenue (million) Forecast, by Application 2020 & 2033
- Table 25: Benelux Smart Safe Cash Management Revenue (million) Forecast, by Application 2020 & 2033
- Table 26: Nordics Smart Safe Cash Management Revenue (million) Forecast, by Application 2020 & 2033
- Table 27: Rest of Europe Smart Safe Cash Management Revenue (million) Forecast, by Application 2020 & 2033
- Table 28: Global Smart Safe Cash Management Revenue million Forecast, by Application 2020 & 2033
- Table 29: Global Smart Safe Cash Management Revenue million Forecast, by Type 2020 & 2033
- Table 30: Global Smart Safe Cash Management Revenue million Forecast, by Country 2020 & 2033
- Table 31: Turkey Smart Safe Cash Management Revenue (million) Forecast, by Application 2020 & 2033
- Table 32: Israel Smart Safe Cash Management Revenue (million) Forecast, by Application 2020 & 2033
- Table 33: GCC Smart Safe Cash Management Revenue (million) Forecast, by Application 2020 & 2033
- Table 34: North Africa Smart Safe Cash Management Revenue (million) Forecast, by Application 2020 & 2033
- Table 35: South Africa Smart Safe Cash Management Revenue (million) Forecast, by Application 2020 & 2033
- Table 36: Rest of Middle East & Africa Smart Safe Cash Management Revenue (million) Forecast, by Application 2020 & 2033
- Table 37: Global Smart Safe Cash Management Revenue million Forecast, by Application 2020 & 2033
- Table 38: Global Smart Safe Cash Management Revenue million Forecast, by Type 2020 & 2033
- Table 39: Global Smart Safe Cash Management Revenue million Forecast, by Country 2020 & 2033
- Table 40: China Smart Safe Cash Management Revenue (million) Forecast, by Application 2020 & 2033
- Table 41: India Smart Safe Cash Management Revenue (million) Forecast, by Application 2020 & 2033
- Table 42: Japan Smart Safe Cash Management Revenue (million) Forecast, by Application 2020 & 2033
- Table 43: South Korea Smart Safe Cash Management Revenue (million) Forecast, by Application 2020 & 2033
- Table 44: ASEAN Smart Safe Cash Management Revenue (million) Forecast, by Application 2020 & 2033
- Table 45: Oceania Smart Safe Cash Management Revenue (million) Forecast, by Application 2020 & 2033
- Table 46: Rest of Asia Pacific Smart Safe Cash Management Revenue (million) Forecast, by Application 2020 & 2033
Frequently Asked Questions
1. What is the projected Compound Annual Growth Rate (CAGR) of the Smart Safe Cash Management?
The projected CAGR is approximately 7.69%.
2. Which companies are prominent players in the Smart Safe Cash Management?
Key companies in the market include Fiserv, Glory, Brink's, Loomis, G4S, Gunnebo, Cennox, Tidel, Halma PLC (Volumatic), AMSEC, Tellermate, Hyosung, Triton, Ellenby Technologies, Socal Safe, Intimus International, Armor Safe Technologies, CIMA.
3. What are the main segments of the Smart Safe Cash Management?
The market segments include Application, Type.
4. Can you provide details about the market size?
The market size is estimated to be USD 4006.07 million as of 2022.
5. What are some drivers contributing to market growth?
N/A
6. What are the notable trends driving market growth?
N/A
7. Are there any restraints impacting market growth?
N/A
8. Can you provide examples of recent developments in the market?
N/A
9. What pricing options are available for accessing the report?
Pricing options include single-user, multi-user, and enterprise licenses priced at USD 2900.00, USD 4350.00, and USD 5800.00 respectively.
10. Is the market size provided in terms of value or volume?
The market size is provided in terms of value, measured in million.
11. Are there any specific market keywords associated with the report?
Yes, the market keyword associated with the report is "Smart Safe Cash Management," which aids in identifying and referencing the specific market segment covered.
12. How do I determine which pricing option suits my needs best?
The pricing options vary based on user requirements and access needs. Individual users may opt for single-user licenses, while businesses requiring broader access may choose multi-user or enterprise licenses for cost-effective access to the report.
13. Are there any additional resources or data provided in the Smart Safe Cash Management report?
While the report offers comprehensive insights, it's advisable to review the specific contents or supplementary materials provided to ascertain if additional resources or data are available.
14. How can I stay updated on further developments or reports in the Smart Safe Cash Management?
To stay informed about further developments, trends, and reports in the Smart Safe Cash Management, consider subscribing to industry newsletters, following relevant companies and organizations, or regularly checking reputable industry news sources and publications.
Methodology
Step 1 - Identification of Relevant Samples Size from Population Database


Step 2 - Approaches for Defining Global Market Size (Value, Volume* & Price*)

Note*: In applicable scenarios
Step 3 - Data Sources
Primary Research
- Web Analytics
- Survey Reports
- Research Institute
- Latest Research Reports
- Opinion Leaders
Secondary Research
- Annual Reports
- White Paper
- Latest Press Release
- Industry Association
- Paid Database
- Investor Presentations

Step 4 - Data Triangulation
Involves using different sources of information in order to increase the validity of a study
These sources are likely to be stakeholders in a program - participants, other researchers, program staff, other community members, and so on.
Then we put all data in single framework & apply various statistical tools to find out the dynamic on the market.
During the analysis stage, feedback from the stakeholder groups would be compared to determine areas of agreement as well as areas of divergence