

Key Insights
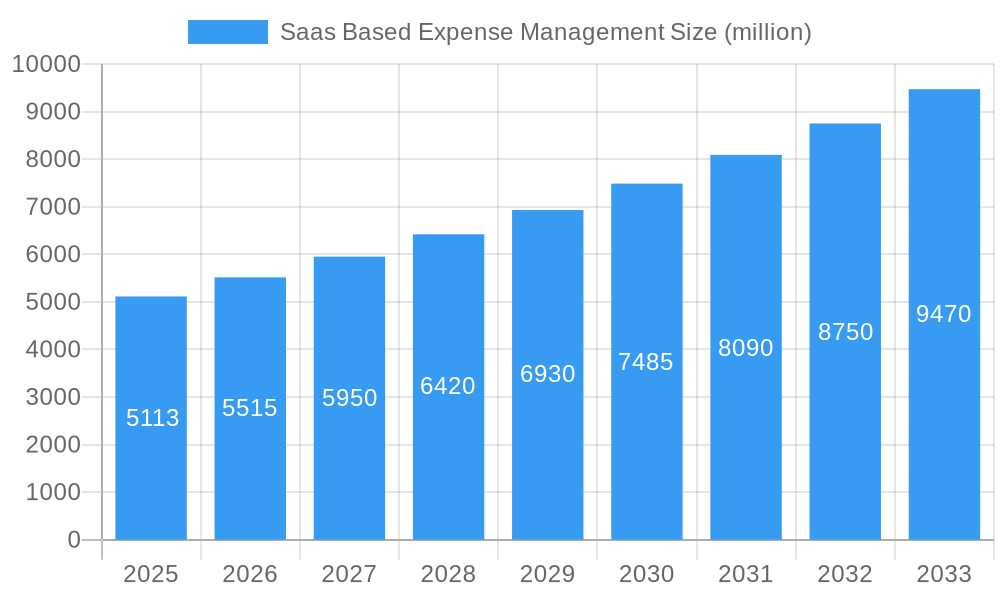
The SaaS-based expense management market is poised for significant expansion, projected to reach an estimated USD 5113 million by 2025, with a robust Compound Annual Growth Rate (CAGR) of 7.9% projected through 2033. This growth is fueled by the increasing need for businesses across all sizes to streamline financial operations, enhance transparency, and reduce manual effort in expense reporting and reimbursement processes. Small and medium businesses, in particular, are increasingly adopting SaaS solutions due to their scalability, affordability, and ease of implementation, allowing them to compete more effectively with larger enterprises. The shift towards remote and hybrid work models further intensifies the demand for cloud-based expense management tools that facilitate seamless expense tracking and approval, regardless of employee location. The integration of AI and machine learning for automated data extraction, policy enforcement, and fraud detection are emerging as key differentiators, driving innovation and value proposition for businesses seeking advanced financial control.
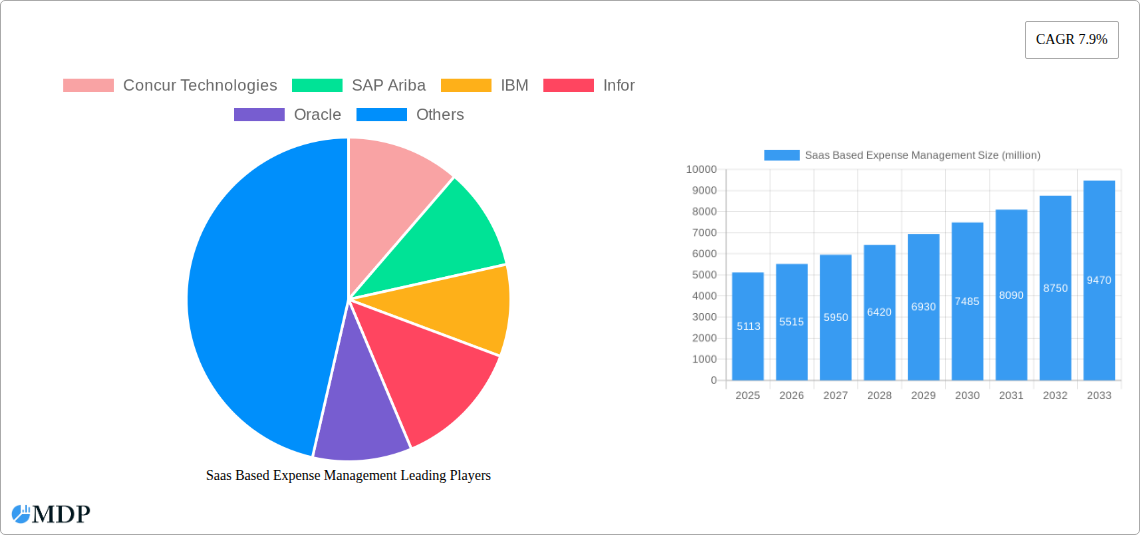
Saas Based Expense Management Market Size (In Billion)
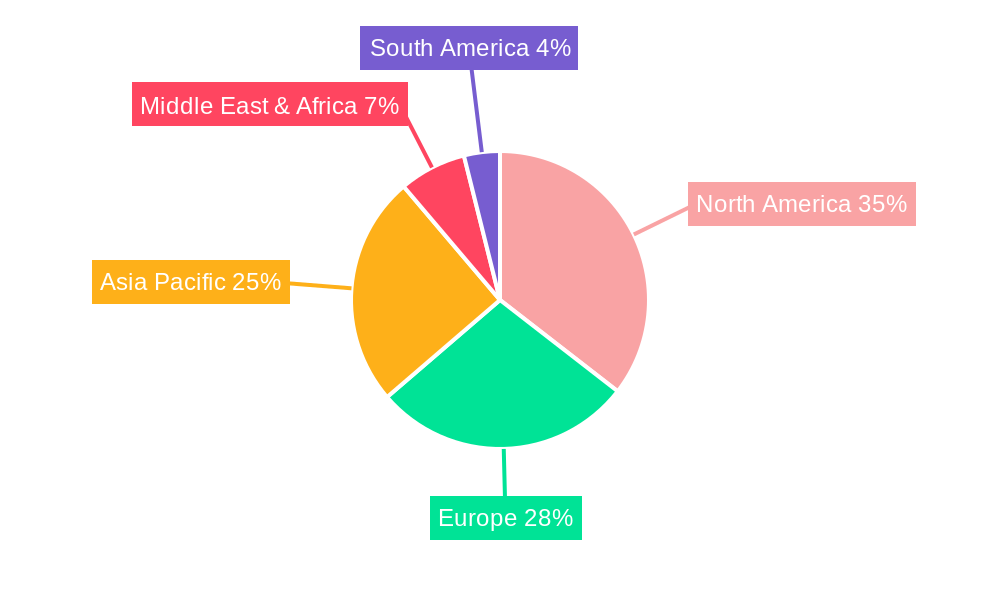
Key drivers for this market's surge include the persistent emphasis on cost optimization, the drive for enhanced compliance and audit trails, and the growing adoption of digital transformation initiatives within organizations. While the market benefits from a wide array of applications, including travel and expense management, and telecom expense management, the "Others" category is also expected to grow as businesses find novel ways to leverage SaaS for managing diverse expense types. Major industry players are investing heavily in research and development to offer comprehensive, user-friendly, and integrated solutions. Geographically, North America and Europe are expected to continue leading the market due to early adoption and a strong regulatory framework. However, the Asia Pacific region, driven by its rapidly growing economies and increasing digital penetration, presents a significant growth opportunity, with China and India at the forefront of this expansion. Challenges, such as data security concerns and the initial cost of integration for some complex ERP systems, are being addressed through continuous platform enhancements and cloud security advancements.
Saas Based Expense Management Company Market Share
SaaS Based Expense Management Market: Comprehensive Report and Analysis (2019-2033)
Gain an unparalleled understanding of the global SaaS Based Expense Management market with this in-depth report. Spanning a study period from 2019 to 2033, with a base year of 2025 and a forecast period from 2025 to 2033, this report provides actionable insights and data-driven analysis for industry stakeholders. Discover market dynamics, leading players, emerging trends, and strategic opportunities in this rapidly evolving sector.
SaaS Based Expense Management Market Dynamics & Concentration
The SaaS Based Expense Management market exhibits a moderate to high concentration, driven by a blend of established enterprise software giants and agile, specialized providers. Key players like SAP Concur Technologies, SAP Ariba, IBM, and Oracle hold significant market share, leveraging their extensive product portfolios and global reach. However, a growing number of innovative companies such as SuitSoft, Certify, and Expensify are disrupting the landscape with user-friendly interfaces and advanced functionalities, particularly within the Small and Medium Business (SMB) segment. Innovation drivers are primarily focused on AI-powered automation, real-time analytics, and enhanced user experience. Regulatory frameworks, while generally supportive of cloud adoption, introduce complexities around data privacy and security, necessitating compliance from all vendors. Product substitutes are evolving, with some businesses leveraging generic spreadsheet solutions or internal custom development, though the efficiency and scalability of dedicated SaaS solutions are increasingly apparent. End-user trends are leaning towards mobile-first accessibility, seamless integration with accounting systems, and robust reporting capabilities. Mergers and acquisitions (M&A) activities remain a significant factor in market consolidation. For instance, the historical period (2019-2024) saw numerous strategic acquisitions aimed at expanding feature sets or customer bases, with an estimated xx M&A deals recorded annually. The market share of top five players is estimated at over 60% in 2025, with continuous shifts due to technological advancements and market penetration strategies.
SaaS Based Expense Management Industry Trends & Analysis
The SaaS Based Expense Management industry is poised for robust growth, fueled by the escalating need for streamlined financial operations and enhanced compliance across organizations of all sizes. The market is projected to experience a Compound Annual Growth Rate (CAGR) of approximately 12-15% during the forecast period (2025-2033). This growth is primarily driven by the increasing adoption of cloud-based solutions, offering scalability, accessibility, and cost-effectiveness compared to traditional on-premise systems. Technological disruptions are at the forefront, with artificial intelligence (AI) and machine learning (ML) revolutionizing expense processing. AI algorithms are increasingly used for automated receipt scanning, categorization, policy enforcement, and fraud detection, significantly reducing manual effort and errors. Natural Language Processing (NLP) is enabling more intuitive user interactions and data extraction. Consumer preferences are shifting towards user-friendly, mobile-first applications that offer a seamless experience for employees submitting expenses and for approvers managing them. Demand for real-time visibility into spending patterns and predictive analytics for budget forecasting is also on the rise. Competitive dynamics are characterized by intense innovation and differentiation. While established players like Concur Technologies, SAP Ariba, IBM, and Oracle continue to dominate the enterprise segment with comprehensive suites, a vibrant ecosystem of specialized vendors is catering to niche markets and SMBs. Companies like Zoho Expense, Expensify, and SuitSoft are gaining traction by offering tailored solutions with competitive pricing and agile development cycles. Market penetration is expected to reach over 70% for Travel and Expense Management applications within large businesses by 2033, while the SMB segment is witnessing accelerated adoption due to the tangible ROI and operational efficiencies. The integration capabilities with other business software, such as ERP, CRM, and payroll systems, are becoming a critical competitive differentiator, fostering a more connected and efficient financial ecosystem.
Leading Markets & Segments in SaaS Based Expense Management
The global SaaS Based Expense Management market is characterized by dominant regions and highly segmented application and type categories. North America is projected to maintain its leading position throughout the forecast period (2025-2033), driven by strong economic policies, a high adoption rate of cloud technologies, and a mature business environment. Within North America, the United States represents the largest market, with an estimated market size of over $15,000 million in 2025. Key drivers for this dominance include the presence of a significant number of large enterprises and SMBs actively seeking digital transformation, coupled with robust IT infrastructure and a supportive regulatory landscape for SaaS adoption.
Application Segments Dominance:
- Large Business: This segment currently represents the largest share and is expected to continue its lead, accounting for an estimated 55% of the market in 2025. The complexity of expense policies, the need for robust compliance and audit trails, and the significant volume of transactions within large enterprises make dedicated SaaS solutions indispensable. Leading companies like SAP Concur Technologies, SAP Ariba, and Oracle cater extensively to this segment, offering comprehensive enterprise-grade features.
- Small and Medium Business (SMB): This segment is experiencing the fastest growth, with an estimated CAGR of 16% during the forecast period. The increasing awareness of operational inefficiencies and the availability of cost-effective, user-friendly SaaS solutions are accelerating adoption. Companies like Zoho Expense, Expensify, and SuitSoft are particularly strong in this segment, offering tailored solutions with competitive pricing and ease of implementation.
- Others: This segment, encompassing startups and micro-enterprises, is also growing, albeit from a smaller base. The simplicity and affordability of certain SaaS solutions are making them accessible to even the smallest businesses.
Type Segments Dominance:
- Travel and Expense Management: This remains the cornerstone of the SaaS Based Expense Management market, accounting for an estimated 70% of the total market value in 2025. The persistent need to manage employee travel bookings, per diems, and expense reimbursements efficiently, coupled with the complexities of global travel regulations, drives this segment's dominance.
- Telecom Expense Management (TEM): While a smaller segment, TEM is witnessing significant growth, particularly as businesses grapple with the proliferation of mobile devices and communication services. The need to control communication costs, manage mobile plans, and ensure compliance is making TEM solutions increasingly vital. This segment is expected to grow at a CAGR of 14%.
- Others: This includes specialized expense management needs, such as corporate card management, invoice processing, and project-based expense tracking. These niche areas are evolving with technological advancements and are expected to contribute to the overall market expansion.
SaaS Based Expense Management Product Developments
Product development in SaaS Based Expense Management is intensely focused on enhancing automation, user experience, and integration capabilities. Innovations include AI-powered receipt scanning with OCR technology, automated policy enforcement to reduce manual errors, and real-time spend analytics dashboards. Mobile-first design and intuitive interfaces are paramount, allowing employees to submit expenses on the go and managers to approve them seamlessly. Enhanced integration with accounting software, ERP systems, and HR platforms is a critical competitive advantage, creating a unified financial ecosystem. Advanced features like predictive analytics for budget forecasting and robust reporting tools are also gaining prominence, offering deeper insights into spending patterns.
Key Drivers of SaaS Based Expense Management Growth
The growth of the SaaS Based Expense Management market is propelled by several key factors. The overarching trend towards digital transformation across industries mandates efficient financial processes. Increased adoption of cloud computing offers scalability, flexibility, and cost savings, making SaaS solutions highly attractive. The growing need for enhanced compliance and corporate governance requires robust audit trails and policy enforcement capabilities, which SaaS platforms excel at providing. Furthermore, the demand for real-time visibility into spending patterns for better financial control and informed decision-making is a significant driver. The proliferation of mobile devices also fuels the growth, enabling employees to manage expenses anytime, anywhere.
Challenges in the SaaS Based Expense Management Market
Despite its strong growth trajectory, the SaaS Based Expense Management market faces several challenges. Data security and privacy concerns remain paramount, requiring vendors to invest heavily in robust cybersecurity measures and comply with evolving data protection regulations (e.g., GDPR, CCPA). Integration complexities with legacy systems and diverse third-party applications can pose implementation hurdles for some organizations. User adoption can also be a challenge, requiring effective change management strategies and comprehensive training programs to ensure employees embrace the new technology. Intense competition can lead to price pressures and necessitate continuous innovation to maintain market share, impacting profit margins for some providers.
Emerging Opportunities in SaaS Based Expense Management
Emerging opportunities in the SaaS Based Expense Management market are abundant, driven by technological advancements and evolving business needs. The integration of advanced AI and machine learning for predictive analytics and intelligent automation presents a significant opportunity for enhanced forecasting and fraud detection. The expansion into niche segments like project-based expense management and the growing demand for sustainable travel expense tracking offer new avenues for growth. Strategic partnerships with accounting software providers, travel management companies, and financial institutions can create synergistic offerings and expand market reach. Furthermore, the increasing globalization of businesses necessitates multi-currency and multi-language capabilities, opening up opportunities in emerging markets.
Leading Players in the SaaS Based Expense Management Sector
- Concur Technologies
- SAP Ariba
- IBM
- Infor
- Oracle
- Apptricity
- SumTotal Systems
- Insperity
- SuitSoft
- Certify
- Expensify
- Abacus
- Nexonia
- Unit4
- Zoho Expense
- Xpenditure
- AccountSight
- NetSuite
Key Milestones in SaaS Based Expense Management Industry
- 2019: Increased adoption of mobile expense reporting applications, enhancing user convenience.
- 2020: Growing emphasis on AI and ML for automated expense categorization and policy checks.
- 2021: Significant advancements in cloud infrastructure and security protocols, boosting enterprise confidence.
- 2022: Surge in integrations with ERP and accounting software for seamless financial workflows.
- 2023: Expansion of Travel and Expense Management features to include sustainability tracking.
- 2024: Increased focus on real-time spend analytics and predictive budgeting capabilities.
- 2025: Estimated market size exceeding $25,000 million globally.
- 2026-2030: Continued innovation in AI for fraud detection and intelligent policy enforcement.
- 2031-2033: Further integration with broader financial planning and analysis (FP&A) tools.
Strategic Outlook for SaaS Based Expense Management Market
The strategic outlook for the SaaS Based Expense Management market is overwhelmingly positive, characterized by continuous innovation and expanding adoption. Key growth accelerators include the deeper integration of AI for advanced automation and predictive insights, leading to greater efficiency and cost savings. The increasing demand for comprehensive spend visibility and control will drive the adoption of sophisticated analytics tools. Strategic partnerships and platform consolidation will continue to shape the competitive landscape, with a focus on delivering end-to-end financial management solutions. As businesses across all sectors prioritize digital transformation and operational agility, the demand for scalable, secure, and user-friendly SaaS Based Expense Management solutions will remain a pivotal element in their success.
Saas Based Expense Management Segmentation
-
1. Application
- 1.1. Small and Medium Business
- 1.2. Large Business
- 1.3. Others
-
2. Type
- 2.1. Travel and Expense Management
- 2.2. Telecom Expense management
- 2.3. Others
Saas Based Expense Management Segmentation By Geography
-
1. North America
- 1.1. United States
- 1.2. Canada
- 1.3. Mexico
-
2. South America
- 2.1. Brazil
- 2.2. Argentina
- 2.3. Rest of South America
-
3. Europe
- 3.1. United Kingdom
- 3.2. Germany
- 3.3. France
- 3.4. Italy
- 3.5. Spain
- 3.6. Russia
- 3.7. Benelux
- 3.8. Nordics
- 3.9. Rest of Europe
-
4. Middle East & Africa
- 4.1. Turkey
- 4.2. Israel
- 4.3. GCC
- 4.4. North Africa
- 4.5. South Africa
- 4.6. Rest of Middle East & Africa
-
5. Asia Pacific
- 5.1. China
- 5.2. India
- 5.3. Japan
- 5.4. South Korea
- 5.5. ASEAN
- 5.6. Oceania
- 5.7. Rest of Asia Pacific
Saas Based Expense Management Regional Market Share
Geographic Coverage of Saas Based Expense Management
Saas Based Expense Management REPORT HIGHLIGHTS
| Aspects | Details |
|---|---|
| Study Period | 2020-2034 |
| Base Year | 2025 |
| Estimated Year | 2026 |
| Forecast Period | 2026-2034 |
| Historical Period | 2020-2025 |
| Growth Rate | CAGR of 7.9% from 2020-2034 |
| Segmentation |
|
Table of Contents
- 1. Introduction
- 1.1. Research Scope
- 1.2. Market Segmentation
- 1.3. Research Objective
- 1.4. Definitions and Assumptions
- 2. Executive Summary
- 2.1. Market Snapshot
- 3. Market Dynamics
- 3.1. Market Drivers
- 3.2. Market Restrains
- 3.3. Market Trends
- 3.4. Market Opportunities
- 4. Market Factor Analysis
- 4.1. Porters Five Forces
- 4.1.1. Bargaining Power of Suppliers
- 4.1.2. Bargaining Power of Buyers
- 4.1.3. Threat of New Entrants
- 4.1.4. Threat of Substitutes
- 4.1.5. Competitive Rivalry
- 4.2. PESTEL analysis
- 4.3. BCG Analysis
- 4.3.1. Stars (High Growth, High Market Share)
- 4.3.2. Cash Cows (Low Growth, High Market Share)
- 4.3.3. Question Mark (High Growth, Low Market Share)
- 4.3.4. Dogs (Low Growth, Low Market Share)
- 4.4. Ansoff Matrix Analysis
- 4.5. Supply Chain Analysis
- 4.6. Regulatory Landscape
- 4.7. Current Market Potential and Opportunity Assessment (TAM–SAM–SOM Framework)
- 4.8. MDP Analyst Note
- 4.1. Porters Five Forces
- 5. Market Analysis, Insights and Forecast 2021-2033
- 5.1. Market Analysis, Insights and Forecast - by Application
- 5.1.1. Small and Medium Business
- 5.1.2. Large Business
- 5.1.3. Others
- 5.2. Market Analysis, Insights and Forecast - by Type
- 5.2.1. Travel and Expense Management
- 5.2.2. Telecom Expense management
- 5.2.3. Others
- 5.3. Market Analysis, Insights and Forecast - by Region
- 5.3.1. North America
- 5.3.2. South America
- 5.3.3. Europe
- 5.3.4. Middle East & Africa
- 5.3.5. Asia Pacific
- 5.1. Market Analysis, Insights and Forecast - by Application
- 6. Global Saas Based Expense Management Analysis, Insights and Forecast, 2021-2033
- 6.1. Market Analysis, Insights and Forecast - by Application
- 6.1.1. Small and Medium Business
- 6.1.2. Large Business
- 6.1.3. Others
- 6.2. Market Analysis, Insights and Forecast - by Type
- 6.2.1. Travel and Expense Management
- 6.2.2. Telecom Expense management
- 6.2.3. Others
- 6.1. Market Analysis, Insights and Forecast - by Application
- 7. North America Saas Based Expense Management Analysis, Insights and Forecast, 2020-2032
- 7.1. Market Analysis, Insights and Forecast - by Application
- 7.1.1. Small and Medium Business
- 7.1.2. Large Business
- 7.1.3. Others
- 7.2. Market Analysis, Insights and Forecast - by Type
- 7.2.1. Travel and Expense Management
- 7.2.2. Telecom Expense management
- 7.2.3. Others
- 7.1. Market Analysis, Insights and Forecast - by Application
- 8. South America Saas Based Expense Management Analysis, Insights and Forecast, 2020-2032
- 8.1. Market Analysis, Insights and Forecast - by Application
- 8.1.1. Small and Medium Business
- 8.1.2. Large Business
- 8.1.3. Others
- 8.2. Market Analysis, Insights and Forecast - by Type
- 8.2.1. Travel and Expense Management
- 8.2.2. Telecom Expense management
- 8.2.3. Others
- 8.1. Market Analysis, Insights and Forecast - by Application
- 9. Europe Saas Based Expense Management Analysis, Insights and Forecast, 2020-2032
- 9.1. Market Analysis, Insights and Forecast - by Application
- 9.1.1. Small and Medium Business
- 9.1.2. Large Business
- 9.1.3. Others
- 9.2. Market Analysis, Insights and Forecast - by Type
- 9.2.1. Travel and Expense Management
- 9.2.2. Telecom Expense management
- 9.2.3. Others
- 9.1. Market Analysis, Insights and Forecast - by Application
- 10. Middle East & Africa Saas Based Expense Management Analysis, Insights and Forecast, 2020-2032
- 10.1. Market Analysis, Insights and Forecast - by Application
- 10.1.1. Small and Medium Business
- 10.1.2. Large Business
- 10.1.3. Others
- 10.2. Market Analysis, Insights and Forecast - by Type
- 10.2.1. Travel and Expense Management
- 10.2.2. Telecom Expense management
- 10.2.3. Others
- 10.1. Market Analysis, Insights and Forecast - by Application
- 11. Asia Pacific Saas Based Expense Management Analysis, Insights and Forecast, 2020-2032
- 11.1. Market Analysis, Insights and Forecast - by Application
- 11.1.1. Small and Medium Business
- 11.1.2. Large Business
- 11.1.3. Others
- 11.2. Market Analysis, Insights and Forecast - by Type
- 11.2.1. Travel and Expense Management
- 11.2.2. Telecom Expense management
- 11.2.3. Others
- 11.1. Market Analysis, Insights and Forecast - by Application
- 12. Competitive Analysis
- 12.1. Company Profiles
- 12.1.1 Concur Technologies
- 12.1.1.1. Company Overview
- 12.1.1.2. Products
- 12.1.1.3. Company Financials
- 12.1.1.4. SWOT Analysis
- 12.1.2 SAP Ariba
- 12.1.2.1. Company Overview
- 12.1.2.2. Products
- 12.1.2.3. Company Financials
- 12.1.2.4. SWOT Analysis
- 12.1.3 IBM
- 12.1.3.1. Company Overview
- 12.1.3.2. Products
- 12.1.3.3. Company Financials
- 12.1.3.4. SWOT Analysis
- 12.1.4 Infor
- 12.1.4.1. Company Overview
- 12.1.4.2. Products
- 12.1.4.3. Company Financials
- 12.1.4.4. SWOT Analysis
- 12.1.5 Oracle
- 12.1.5.1. Company Overview
- 12.1.5.2. Products
- 12.1.5.3. Company Financials
- 12.1.5.4. SWOT Analysis
- 12.1.6 Apptricity
- 12.1.6.1. Company Overview
- 12.1.6.2. Products
- 12.1.6.3. Company Financials
- 12.1.6.4. SWOT Analysis
- 12.1.7 SumTotal Systems
- 12.1.7.1. Company Overview
- 12.1.7.2. Products
- 12.1.7.3. Company Financials
- 12.1.7.4. SWOT Analysis
- 12.1.8 Insperity
- 12.1.8.1. Company Overview
- 12.1.8.2. Products
- 12.1.8.3. Company Financials
- 12.1.8.4. SWOT Analysis
- 12.1.9 SuitSoft
- 12.1.9.1. Company Overview
- 12.1.9.2. Products
- 12.1.9.3. Company Financials
- 12.1.9.4. SWOT Analysis
- 12.1.10 Certify
- 12.1.10.1. Company Overview
- 12.1.10.2. Products
- 12.1.10.3. Company Financials
- 12.1.10.4. SWOT Analysis
- 12.1.11 Expensify
- 12.1.11.1. Company Overview
- 12.1.11.2. Products
- 12.1.11.3. Company Financials
- 12.1.11.4. SWOT Analysis
- 12.1.12 Abacus
- 12.1.12.1. Company Overview
- 12.1.12.2. Products
- 12.1.12.3. Company Financials
- 12.1.12.4. SWOT Analysis
- 12.1.13 Nexonia
- 12.1.13.1. Company Overview
- 12.1.13.2. Products
- 12.1.13.3. Company Financials
- 12.1.13.4. SWOT Analysis
- 12.1.14 Unit4
- 12.1.14.1. Company Overview
- 12.1.14.2. Products
- 12.1.14.3. Company Financials
- 12.1.14.4. SWOT Analysis
- 12.1.15 Zoho Expense
- 12.1.15.1. Company Overview
- 12.1.15.2. Products
- 12.1.15.3. Company Financials
- 12.1.15.4. SWOT Analysis
- 12.1.16 Xpenditure
- 12.1.16.1. Company Overview
- 12.1.16.2. Products
- 12.1.16.3. Company Financials
- 12.1.16.4. SWOT Analysis
- 12.1.17 AccountSight
- 12.1.17.1. Company Overview
- 12.1.17.2. Products
- 12.1.17.3. Company Financials
- 12.1.17.4. SWOT Analysis
- 12.1.18 NetSuite
- 12.1.18.1. Company Overview
- 12.1.18.2. Products
- 12.1.18.3. Company Financials
- 12.1.18.4. SWOT Analysis
- 12.1.1 Concur Technologies
- 12.2. Market Entropy
- 12.2.1 Company's Key Areas Served
- 12.2.2 Recent Developments
- 12.3. Company Market Share Analysis 2025
- 12.3.1 Top 5 Companies Market Share Analysis
- 12.3.2 Top 3 Companies Market Share Analysis
- 12.4. List of Potential Customers
- 13. Research Methodology
List of Figures
- Figure 1: Global Saas Based Expense Management Revenue Breakdown (million, %) by Region 2025 & 2033
- Figure 2: North America Saas Based Expense Management Revenue (million), by Application 2025 & 2033
- Figure 3: North America Saas Based Expense Management Revenue Share (%), by Application 2025 & 2033
- Figure 4: North America Saas Based Expense Management Revenue (million), by Type 2025 & 2033
- Figure 5: North America Saas Based Expense Management Revenue Share (%), by Type 2025 & 2033
- Figure 6: North America Saas Based Expense Management Revenue (million), by Country 2025 & 2033
- Figure 7: North America Saas Based Expense Management Revenue Share (%), by Country 2025 & 2033
- Figure 8: South America Saas Based Expense Management Revenue (million), by Application 2025 & 2033
- Figure 9: South America Saas Based Expense Management Revenue Share (%), by Application 2025 & 2033
- Figure 10: South America Saas Based Expense Management Revenue (million), by Type 2025 & 2033
- Figure 11: South America Saas Based Expense Management Revenue Share (%), by Type 2025 & 2033
- Figure 12: South America Saas Based Expense Management Revenue (million), by Country 2025 & 2033
- Figure 13: South America Saas Based Expense Management Revenue Share (%), by Country 2025 & 2033
- Figure 14: Europe Saas Based Expense Management Revenue (million), by Application 2025 & 2033
- Figure 15: Europe Saas Based Expense Management Revenue Share (%), by Application 2025 & 2033
- Figure 16: Europe Saas Based Expense Management Revenue (million), by Type 2025 & 2033
- Figure 17: Europe Saas Based Expense Management Revenue Share (%), by Type 2025 & 2033
- Figure 18: Europe Saas Based Expense Management Revenue (million), by Country 2025 & 2033
- Figure 19: Europe Saas Based Expense Management Revenue Share (%), by Country 2025 & 2033
- Figure 20: Middle East & Africa Saas Based Expense Management Revenue (million), by Application 2025 & 2033
- Figure 21: Middle East & Africa Saas Based Expense Management Revenue Share (%), by Application 2025 & 2033
- Figure 22: Middle East & Africa Saas Based Expense Management Revenue (million), by Type 2025 & 2033
- Figure 23: Middle East & Africa Saas Based Expense Management Revenue Share (%), by Type 2025 & 2033
- Figure 24: Middle East & Africa Saas Based Expense Management Revenue (million), by Country 2025 & 2033
- Figure 25: Middle East & Africa Saas Based Expense Management Revenue Share (%), by Country 2025 & 2033
- Figure 26: Asia Pacific Saas Based Expense Management Revenue (million), by Application 2025 & 2033
- Figure 27: Asia Pacific Saas Based Expense Management Revenue Share (%), by Application 2025 & 2033
- Figure 28: Asia Pacific Saas Based Expense Management Revenue (million), by Type 2025 & 2033
- Figure 29: Asia Pacific Saas Based Expense Management Revenue Share (%), by Type 2025 & 2033
- Figure 30: Asia Pacific Saas Based Expense Management Revenue (million), by Country 2025 & 2033
- Figure 31: Asia Pacific Saas Based Expense Management Revenue Share (%), by Country 2025 & 2033
List of Tables
- Table 1: Global Saas Based Expense Management Revenue million Forecast, by Application 2020 & 2033
- Table 2: Global Saas Based Expense Management Revenue million Forecast, by Type 2020 & 2033
- Table 3: Global Saas Based Expense Management Revenue million Forecast, by Region 2020 & 2033
- Table 4: Global Saas Based Expense Management Revenue million Forecast, by Application 2020 & 2033
- Table 5: Global Saas Based Expense Management Revenue million Forecast, by Type 2020 & 2033
- Table 6: Global Saas Based Expense Management Revenue million Forecast, by Country 2020 & 2033
- Table 7: United States Saas Based Expense Management Revenue (million) Forecast, by Application 2020 & 2033
- Table 8: Canada Saas Based Expense Management Revenue (million) Forecast, by Application 2020 & 2033
- Table 9: Mexico Saas Based Expense Management Revenue (million) Forecast, by Application 2020 & 2033
- Table 10: Global Saas Based Expense Management Revenue million Forecast, by Application 2020 & 2033
- Table 11: Global Saas Based Expense Management Revenue million Forecast, by Type 2020 & 2033
- Table 12: Global Saas Based Expense Management Revenue million Forecast, by Country 2020 & 2033
- Table 13: Brazil Saas Based Expense Management Revenue (million) Forecast, by Application 2020 & 2033
- Table 14: Argentina Saas Based Expense Management Revenue (million) Forecast, by Application 2020 & 2033
- Table 15: Rest of South America Saas Based Expense Management Revenue (million) Forecast, by Application 2020 & 2033
- Table 16: Global Saas Based Expense Management Revenue million Forecast, by Application 2020 & 2033
- Table 17: Global Saas Based Expense Management Revenue million Forecast, by Type 2020 & 2033
- Table 18: Global Saas Based Expense Management Revenue million Forecast, by Country 2020 & 2033
- Table 19: United Kingdom Saas Based Expense Management Revenue (million) Forecast, by Application 2020 & 2033
- Table 20: Germany Saas Based Expense Management Revenue (million) Forecast, by Application 2020 & 2033
- Table 21: France Saas Based Expense Management Revenue (million) Forecast, by Application 2020 & 2033
- Table 22: Italy Saas Based Expense Management Revenue (million) Forecast, by Application 2020 & 2033
- Table 23: Spain Saas Based Expense Management Revenue (million) Forecast, by Application 2020 & 2033
- Table 24: Russia Saas Based Expense Management Revenue (million) Forecast, by Application 2020 & 2033
- Table 25: Benelux Saas Based Expense Management Revenue (million) Forecast, by Application 2020 & 2033
- Table 26: Nordics Saas Based Expense Management Revenue (million) Forecast, by Application 2020 & 2033
- Table 27: Rest of Europe Saas Based Expense Management Revenue (million) Forecast, by Application 2020 & 2033
- Table 28: Global Saas Based Expense Management Revenue million Forecast, by Application 2020 & 2033
- Table 29: Global Saas Based Expense Management Revenue million Forecast, by Type 2020 & 2033
- Table 30: Global Saas Based Expense Management Revenue million Forecast, by Country 2020 & 2033
- Table 31: Turkey Saas Based Expense Management Revenue (million) Forecast, by Application 2020 & 2033
- Table 32: Israel Saas Based Expense Management Revenue (million) Forecast, by Application 2020 & 2033
- Table 33: GCC Saas Based Expense Management Revenue (million) Forecast, by Application 2020 & 2033
- Table 34: North Africa Saas Based Expense Management Revenue (million) Forecast, by Application 2020 & 2033
- Table 35: South Africa Saas Based Expense Management Revenue (million) Forecast, by Application 2020 & 2033
- Table 36: Rest of Middle East & Africa Saas Based Expense Management Revenue (million) Forecast, by Application 2020 & 2033
- Table 37: Global Saas Based Expense Management Revenue million Forecast, by Application 2020 & 2033
- Table 38: Global Saas Based Expense Management Revenue million Forecast, by Type 2020 & 2033
- Table 39: Global Saas Based Expense Management Revenue million Forecast, by Country 2020 & 2033
- Table 40: China Saas Based Expense Management Revenue (million) Forecast, by Application 2020 & 2033
- Table 41: India Saas Based Expense Management Revenue (million) Forecast, by Application 2020 & 2033
- Table 42: Japan Saas Based Expense Management Revenue (million) Forecast, by Application 2020 & 2033
- Table 43: South Korea Saas Based Expense Management Revenue (million) Forecast, by Application 2020 & 2033
- Table 44: ASEAN Saas Based Expense Management Revenue (million) Forecast, by Application 2020 & 2033
- Table 45: Oceania Saas Based Expense Management Revenue (million) Forecast, by Application 2020 & 2033
- Table 46: Rest of Asia Pacific Saas Based Expense Management Revenue (million) Forecast, by Application 2020 & 2033
Frequently Asked Questions
1. What is the projected Compound Annual Growth Rate (CAGR) of the Saas Based Expense Management?
The projected CAGR is approximately 7.9%.
2. Which companies are prominent players in the Saas Based Expense Management?
Key companies in the market include Concur Technologies, SAP Ariba, IBM, Infor, Oracle, Apptricity, SumTotal Systems, Insperity, SuitSoft, Certify, Expensify, Abacus, Nexonia, Unit4, Zoho Expense, Xpenditure, AccountSight, NetSuite.
3. What are the main segments of the Saas Based Expense Management?
The market segments include Application, Type.
4. Can you provide details about the market size?
The market size is estimated to be USD 5113 million as of 2022.
5. What are some drivers contributing to market growth?
N/A
6. What are the notable trends driving market growth?
N/A
7. Are there any restraints impacting market growth?
N/A
8. Can you provide examples of recent developments in the market?
N/A
9. What pricing options are available for accessing the report?
Pricing options include single-user, multi-user, and enterprise licenses priced at USD 4250.00, USD 6375.00, and USD 8500.00 respectively.
10. Is the market size provided in terms of value or volume?
The market size is provided in terms of value, measured in million.
11. Are there any specific market keywords associated with the report?
Yes, the market keyword associated with the report is "Saas Based Expense Management," which aids in identifying and referencing the specific market segment covered.
12. How do I determine which pricing option suits my needs best?
The pricing options vary based on user requirements and access needs. Individual users may opt for single-user licenses, while businesses requiring broader access may choose multi-user or enterprise licenses for cost-effective access to the report.
13. Are there any additional resources or data provided in the Saas Based Expense Management report?
While the report offers comprehensive insights, it's advisable to review the specific contents or supplementary materials provided to ascertain if additional resources or data are available.
14. How can I stay updated on further developments or reports in the Saas Based Expense Management?
To stay informed about further developments, trends, and reports in the Saas Based Expense Management, consider subscribing to industry newsletters, following relevant companies and organizations, or regularly checking reputable industry news sources and publications.
Methodology
Step 1 - Identification of Relevant Samples Size from Population Database


Step 2 - Approaches for Defining Global Market Size (Value, Volume* & Price*)

Note*: In applicable scenarios
Step 3 - Data Sources
Primary Research
- Web Analytics
- Survey Reports
- Research Institute
- Latest Research Reports
- Opinion Leaders
Secondary Research
- Annual Reports
- White Paper
- Latest Press Release
- Industry Association
- Paid Database
- Investor Presentations

Step 4 - Data Triangulation
Involves using different sources of information in order to increase the validity of a study
These sources are likely to be stakeholders in a program - participants, other researchers, program staff, other community members, and so on.
Then we put all data in single framework & apply various statistical tools to find out the dynamic on the market.
During the analysis stage, feedback from the stakeholder groups would be compared to determine areas of agreement as well as areas of divergence