

Key Insights
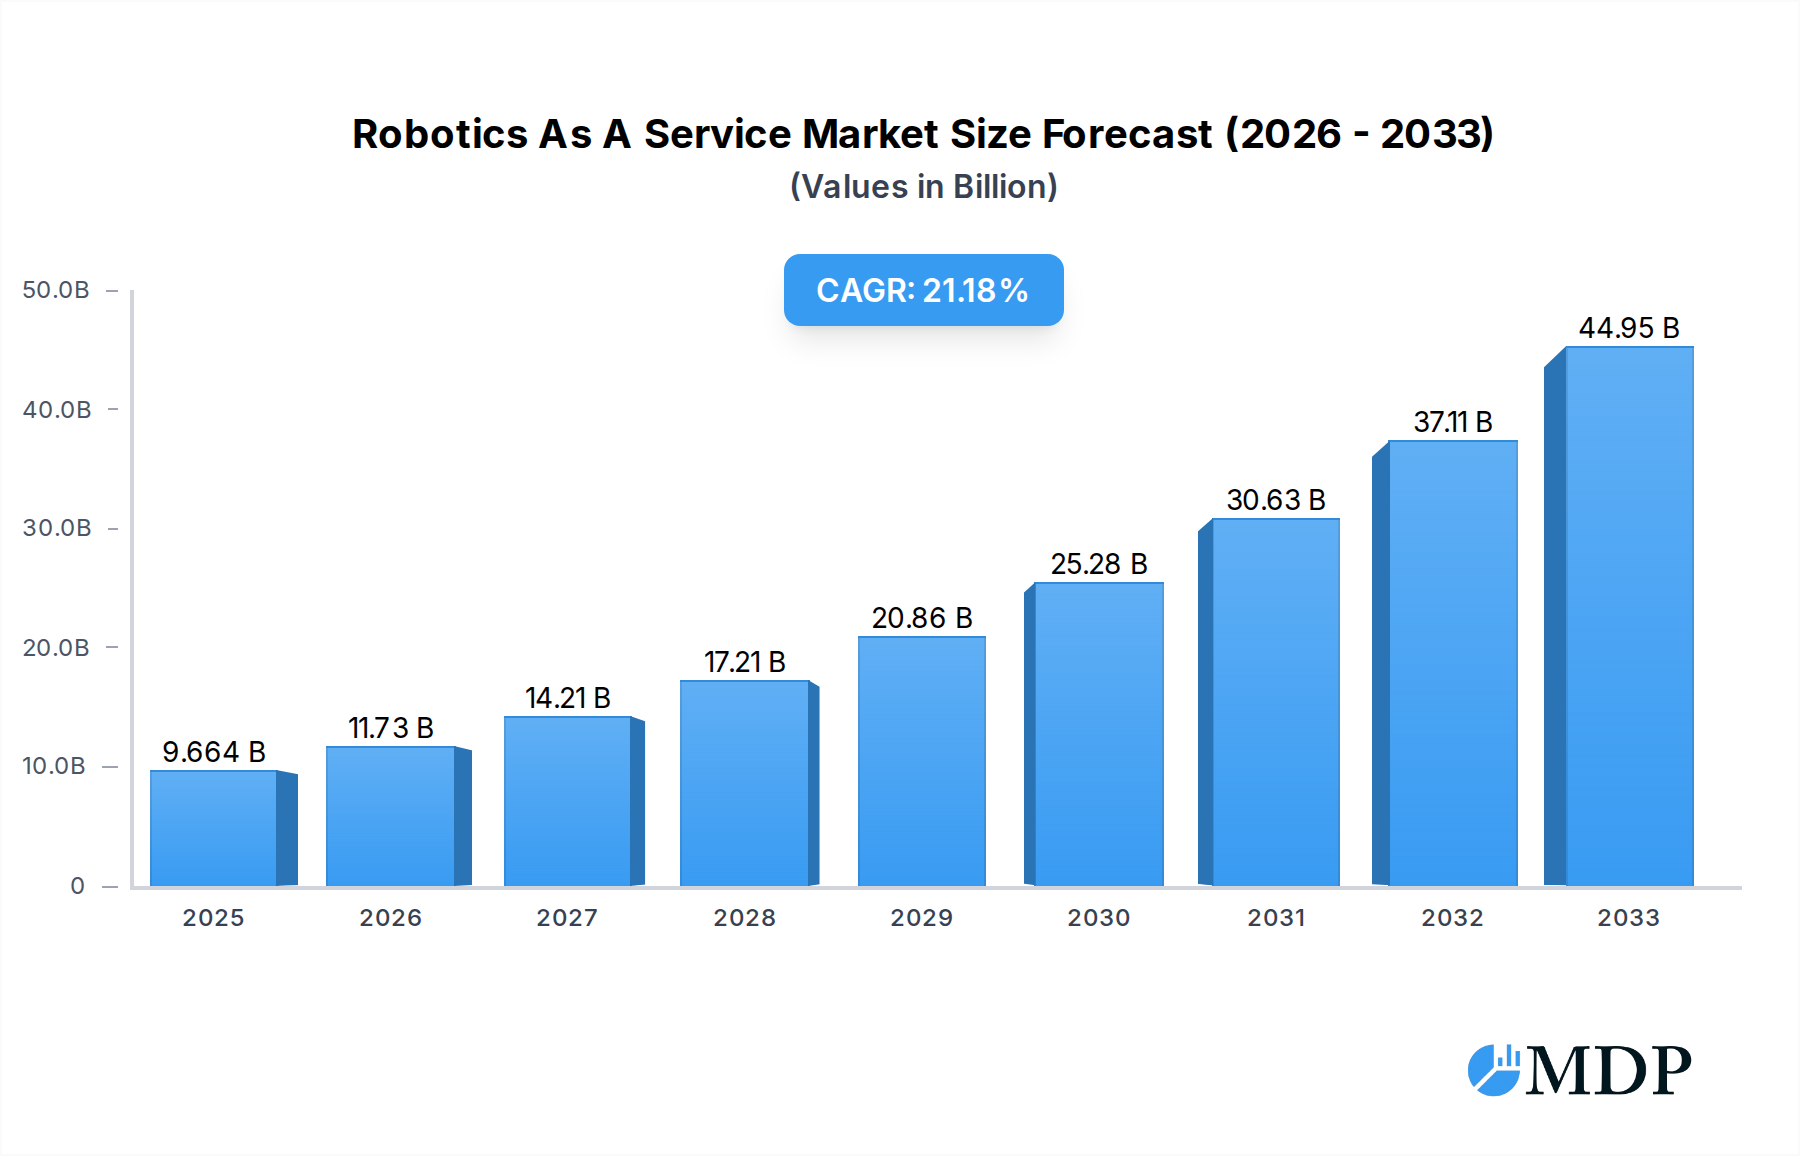
The Robotics as a Service (RaaS) market is poised for substantial growth, projected to reach a market size of 9664 million USD by 2025, with an impressive Compound Annual Growth Rate (CAGR) of 20.5% throughout the forecast period of 2025-2033. This robust expansion is fueled by several key drivers, including the increasing demand for automation across various industries to enhance efficiency, reduce operational costs, and improve safety. The inherent flexibility and scalability offered by RaaS models, which allow businesses to access advanced robotic technologies without significant upfront capital investment, are also major catalysts for market penetration. Furthermore, rapid advancements in AI, machine learning, and sensor technologies are continuously expanding the capabilities and applications of robots, making them more viable and attractive solutions for a wider range of tasks. The integration of robotics into diverse sectors such as IT & Telecom, BFSI, Defense, Logistics, Healthcare, and Retail signifies a broad adoption trend, highlighting the transformative potential of RaaS in modernizing business operations and driving innovation.

Robotics As A Service Market Size (In Billion)
The RaaS market is characterized by a dynamic landscape with emerging trends that are shaping its future trajectory. A significant trend is the increasing adoption of specialized robots, including Professional Service Robots for complex industrial and commercial applications, and Personal Service Robots for domestic and assistive purposes, indicating a growing demand for tailored robotic solutions. The market is also witnessing a rise in collaborative robots (cobots) designed to work alongside humans, augmenting human capabilities rather than replacing them entirely, which addresses workforce concerns and fosters greater acceptance. Geographically, North America and Europe are expected to lead the market due to their established industrial bases, technological sophistication, and supportive regulatory environments for automation. However, the Asia Pacific region is anticipated to exhibit the fastest growth, driven by rapid industrialization, a burgeoning manufacturing sector, and increasing government initiatives promoting advanced technology adoption. Despite the optimistic outlook, certain restraints, such as the initial high cost of integration for some advanced systems, the need for skilled personnel to operate and maintain robots, and concerns regarding data security and privacy in connected robotic systems, will require strategic mitigation by market players.
Robotics As A Service Company Market Share
Robotics As A Service Market Report: Unlocking Future Automation
Gain unparalleled insights into the rapidly evolving Robotics As A Service (RaaS) market with this comprehensive report. Covering the Study Period 2019–2033, including a Base Year of 2025, Estimated Year of 2025, and an extensive Forecast Period 2025–2033, this analysis delves deep into the drivers, trends, and future landscape of RaaS. We provide actionable intelligence for industry stakeholders, investors, and technology providers looking to capitalize on the immense growth potential of robotic solutions as a service. This report is your definitive guide to understanding market dynamics, key players, and strategic opportunities in the RaaS sector.
Robotics As A Service Market Dynamics & Concentration
The Robotics As A Service (RaaS) market is characterized by a dynamic interplay of technological innovation, evolving business models, and increasing end-user adoption. Market concentration is currently moderate, with a mix of established industrial automation giants and agile startups vying for market share. Innovation is primarily driven by advancements in AI, machine learning, and sensor technology, enabling robots to perform increasingly complex tasks with greater autonomy. Regulatory frameworks, while still developing in some regions, are becoming more conducive to RaaS adoption, particularly in sectors like logistics and healthcare. Product substitutes, such as traditional automation solutions and manual labor, are gradually being displaced by the flexibility and cost-effectiveness of RaaS. End-user trends indicate a strong preference for subscription-based models that offer lower upfront investment and scalable deployment. Mergers and acquisitions (M&A) are a significant indicator of market consolidation and strategic positioning. Over the historical period (2019-2024), we observed an estimated XXX M&A deals, with key players like KUKA AG and Dematic actively engaging in strategic acquisitions to expand their service offerings and technological capabilities. Market share distribution is fragmented, with leading companies like iRobot and Softbank holding significant, yet not dominant, positions across various RaaS segments.
Robotics As A Service Industry Trends & Analysis
The Robotics As A Service (RaaS) industry is on an unprecedented growth trajectory, fueled by a confluence of transformative trends and significant market drivers. The projected Compound Annual Growth Rate (CAGR) for the RaaS market is an impressive xx%, reflecting robust demand across diverse industrial and consumer applications. This growth is underpinned by the increasing need for automation to enhance operational efficiency, reduce labor costs, and improve workplace safety. Technological disruptions are at the forefront of this expansion. Advancements in artificial intelligence (AI), machine learning (ML), cloud computing, and the Internet of Things (IoT) are enabling robots to perform more sophisticated tasks, adapt to dynamic environments, and collaborate seamlessly with humans. This evolution from single-purpose machines to intelligent, interconnected systems is a defining characteristic of the current RaaS landscape.
Consumer preferences are shifting towards service-oriented models that offer greater flexibility and predictability. Businesses are increasingly opting for RaaS to avoid substantial capital expenditures associated with outright robot ownership, instead favoring operational expense (OpEx) models. This allows for easier scalability, access to the latest technology without frequent upgrades, and the benefit of expert maintenance and support. The competitive dynamics within the RaaS market are intensifying. Established players like iRobot, Softbank, and KUKA AG are leveraging their existing expertise and brand recognition to offer comprehensive RaaS solutions, while newer entrants are focusing on niche applications and innovative service models. The proliferation of specialized robots for sectors such as logistics (e.g., Daifuku Co., Dematic, Bastian Solutions), healthcare (e.g., Intuitive Surgical, CYBERDYNE INC.), and agriculture (e.g., DeLaval, ecoRobotix Ltd) highlights the increasing segmentation and specialization within the RaaS ecosystem. Market penetration is steadily increasing across various industries, driven by the demonstrable return on investment (ROI) and the ability of RaaS to address critical operational challenges. The integration of robots into everyday life, from delivery services (e.g., Starship Technologies) to personal assistance, further broadens the RaaS market's reach and potential. The global RaaS market is projected to reach over $XX million by 2033, a testament to its transformative impact on industries worldwide.
Leading Markets & Segments in Robotics As A Service
The Logistics segment stands out as a dominant force in the Robotics As A Service (RaaS) market, driven by the relentless pursuit of efficiency in warehousing, fulfillment, and last-mile delivery. Key drivers for its dominance include escalating e-commerce volumes, the need for faster order fulfillment, and the critical labor shortages plaguing the logistics workforce. The economic policies favoring automation and infrastructure development for smart logistics hubs further bolster this segment's growth. Countries with advanced manufacturing and robust supply chains, such as the United States, Germany, and China, are leading the charge in adopting RaaS solutions within logistics.
Within the Application segments, Professional Service Robots are currently capturing the largest market share, encompassing a wide array of industrial, medical, and commercial applications. The Healthcare sector, in particular, is experiencing significant RaaS adoption, with surgical robots like those from Intuitive Surgical and rehabilitative robots from CYBERDYNE INC. revolutionizing patient care. The BFSI (Banking, Financial Services, and Insurance) sector is also increasingly exploring RaaS for tasks like customer service automation and data analysis.
The Type of RaaS is predominantly characterized by Professional Service Robots, which are designed for commercial and industrial use. However, Personal Service Robots, exemplified by consumer cleaning robots from iRobot and Neato Robotics, are carving out a substantial niche, indicating a growing demand for robotic assistance in domestic environments.
Furthermore, the Defense sector is a significant growth area, with companies like Northrop Grumman and KONGSBERG developing advanced robotic systems for surveillance, reconnaissance, and logistical support, driven by national security imperatives and technological advancements in unmanned systems. The Food & Beverage industry is also seeing increased adoption of RaaS for automation in processing, packaging, and quality control, with companies like Lely implementing robotic milking solutions.
Robotics As A Service Product Developments
Product innovations in RaaS are rapidly expanding the capabilities and applications of robotic systems. Companies are focusing on developing robots with enhanced AI and machine learning for greater autonomy, predictive maintenance, and seamless human-robot collaboration. Key advancements include more dexterous manipulators, advanced sensor suites for environmental perception, and improved navigation algorithms. The integration of RaaS with cloud platforms is enabling remote management, data analytics, and software updates, offering a more comprehensive and flexible service. Competitive advantages are being forged through specialized robot designs tailored for specific industry needs, such as autonomous mobile robots (AMRs) for logistics, surgical robots for healthcare, and agricultural robots for precision farming.
Key Drivers of Robotics As A Service Growth
The growth of the Robotics As A Service (RaaS) market is propelled by several critical factors. Technologically, advancements in AI, machine learning, and IoT are enabling more capable and autonomous robots. Economically, the desire to reduce operational costs, increase productivity, and address labor shortages is a primary driver, making the OpEx model of RaaS highly attractive. Regulatory frameworks, particularly those promoting industrial automation and safety standards, are also facilitating adoption. Furthermore, the increasing demand for flexible, scalable automation solutions that bypass high upfront capital investment ensures a sustained demand for RaaS offerings.
Challenges in the Robotics As A Service Market
Despite its strong growth, the RaaS market faces several challenges. Regulatory hurdles in certain regions regarding the deployment and operation of autonomous robots can slow down adoption. Supply chain issues, particularly for specialized components, can impact the availability and cost of robotic hardware. High initial implementation costs for integration and training, even within an OpEx model, can be a barrier for smaller businesses. Furthermore, intense competition from both established players and emerging startups necessitates continuous innovation and differentiation to maintain market share.
Emerging Opportunities in Robotics As A Service
Emerging opportunities in the Robotics As A Service (RaaS) market are vast and driven by technological breakthroughs and evolving market needs. The increasing demand for robots in edge computing environments, enabling real-time data processing and decision-making, presents a significant avenue for growth. Strategic partnerships between RaaS providers and AI/ML specialists are fostering the development of more intelligent and adaptable robotic solutions. Market expansion into emerging economies and new application verticals, such as elderly care and environmental monitoring, offers substantial long-term growth potential.
Leading Players in the Robotics As A Service Sector
- iRobot
- Softbank
- Intuitive Surgical
- DeLaval
- Daifuku Co.
- CYBERDYNE INC.
- DJI
- KONGSBERG
- Northrop Grumman
- Neato Robotics
- ecoRobotix Ltd
- Starship Technologies
- KUKA AG
- Parrot
- Aethon
- Lely
- Dematic
- Bastian Solutions
- OMRON Corporation
Key Milestones in Robotics As A Service Industry
- 2019: Increased adoption of autonomous mobile robots (AMRs) in warehouses, driving RaaS adoption in logistics.
- 2020: Heightened demand for robotic solutions in healthcare for disinfection and patient care due to the pandemic.
- 2021: Expansion of RaaS offerings beyond industrial applications into sectors like retail and food service.
- 2022: Significant advancements in AI and machine learning enabling more sophisticated human-robot collaboration.
- 2023: Growth in the development and deployment of delivery robots for last-mile logistics.
- 2024: Increased investment in RaaS startups, signaling strong market confidence.
- 2025: Projected acceleration in the adoption of AI-powered professional service robots across multiple industries.
- 2026: Expected emergence of new regulatory frameworks to govern autonomous robot operations.
- 2027: Continued innovation in soft robotics and wearable robotic systems for diverse applications.
- 2028: Increased integration of RaaS with 5G technology for enhanced connectivity and real-time control.
- 2029: Growth in the utilization of drones as a service (DaaS) for inspection and delivery applications.
- 2030: Anticipated wider adoption of humanoid robots in service-oriented roles.
- 2031: Maturation of RaaS platforms, offering more comprehensive and integrated automation solutions.
- 2032: Further consolidation of the RaaS market through strategic mergers and acquisitions.
- 2033: Projected widespread integration of RaaS across a majority of industrial and service sectors.
Strategic Outlook for Robotics As A Service Market
The strategic outlook for the Robotics As A Service (RaaS) market remains exceptionally bright. Future growth will be accelerated by the continued integration of advanced AI and edge computing capabilities, leading to more intelligent and responsive robotic systems. Expansion into new geographic markets and untapped industry verticals presents significant strategic opportunities. Furthermore, fostering collaborative ecosystems through partnerships between technology providers, service integrators, and end-users will be crucial for driving widespread adoption and innovation in the RaaS landscape.
Robotics As A Service Segmentation
-
1. Application
- 1.1. IT & Telecom
- 1.2. BFSI
- 1.3. Defense
- 1.4. Logistics
- 1.5. Healthcare
- 1.6. Retail
- 1.7. Food & Beverage
- 1.8. Media & Entertainment
- 1.9. Others
-
2. Type
- 2.1. Professional Service Robots
- 2.2. Personal Service Robots
Robotics As A Service Segmentation By Geography
-
1. North America
- 1.1. United States
- 1.2. Canada
- 1.3. Mexico
-
2. South America
- 2.1. Brazil
- 2.2. Argentina
- 2.3. Rest of South America
-
3. Europe
- 3.1. United Kingdom
- 3.2. Germany
- 3.3. France
- 3.4. Italy
- 3.5. Spain
- 3.6. Russia
- 3.7. Benelux
- 3.8. Nordics
- 3.9. Rest of Europe
-
4. Middle East & Africa
- 4.1. Turkey
- 4.2. Israel
- 4.3. GCC
- 4.4. North Africa
- 4.5. South Africa
- 4.6. Rest of Middle East & Africa
-
5. Asia Pacific
- 5.1. China
- 5.2. India
- 5.3. Japan
- 5.4. South Korea
- 5.5. ASEAN
- 5.6. Oceania
- 5.7. Rest of Asia Pacific
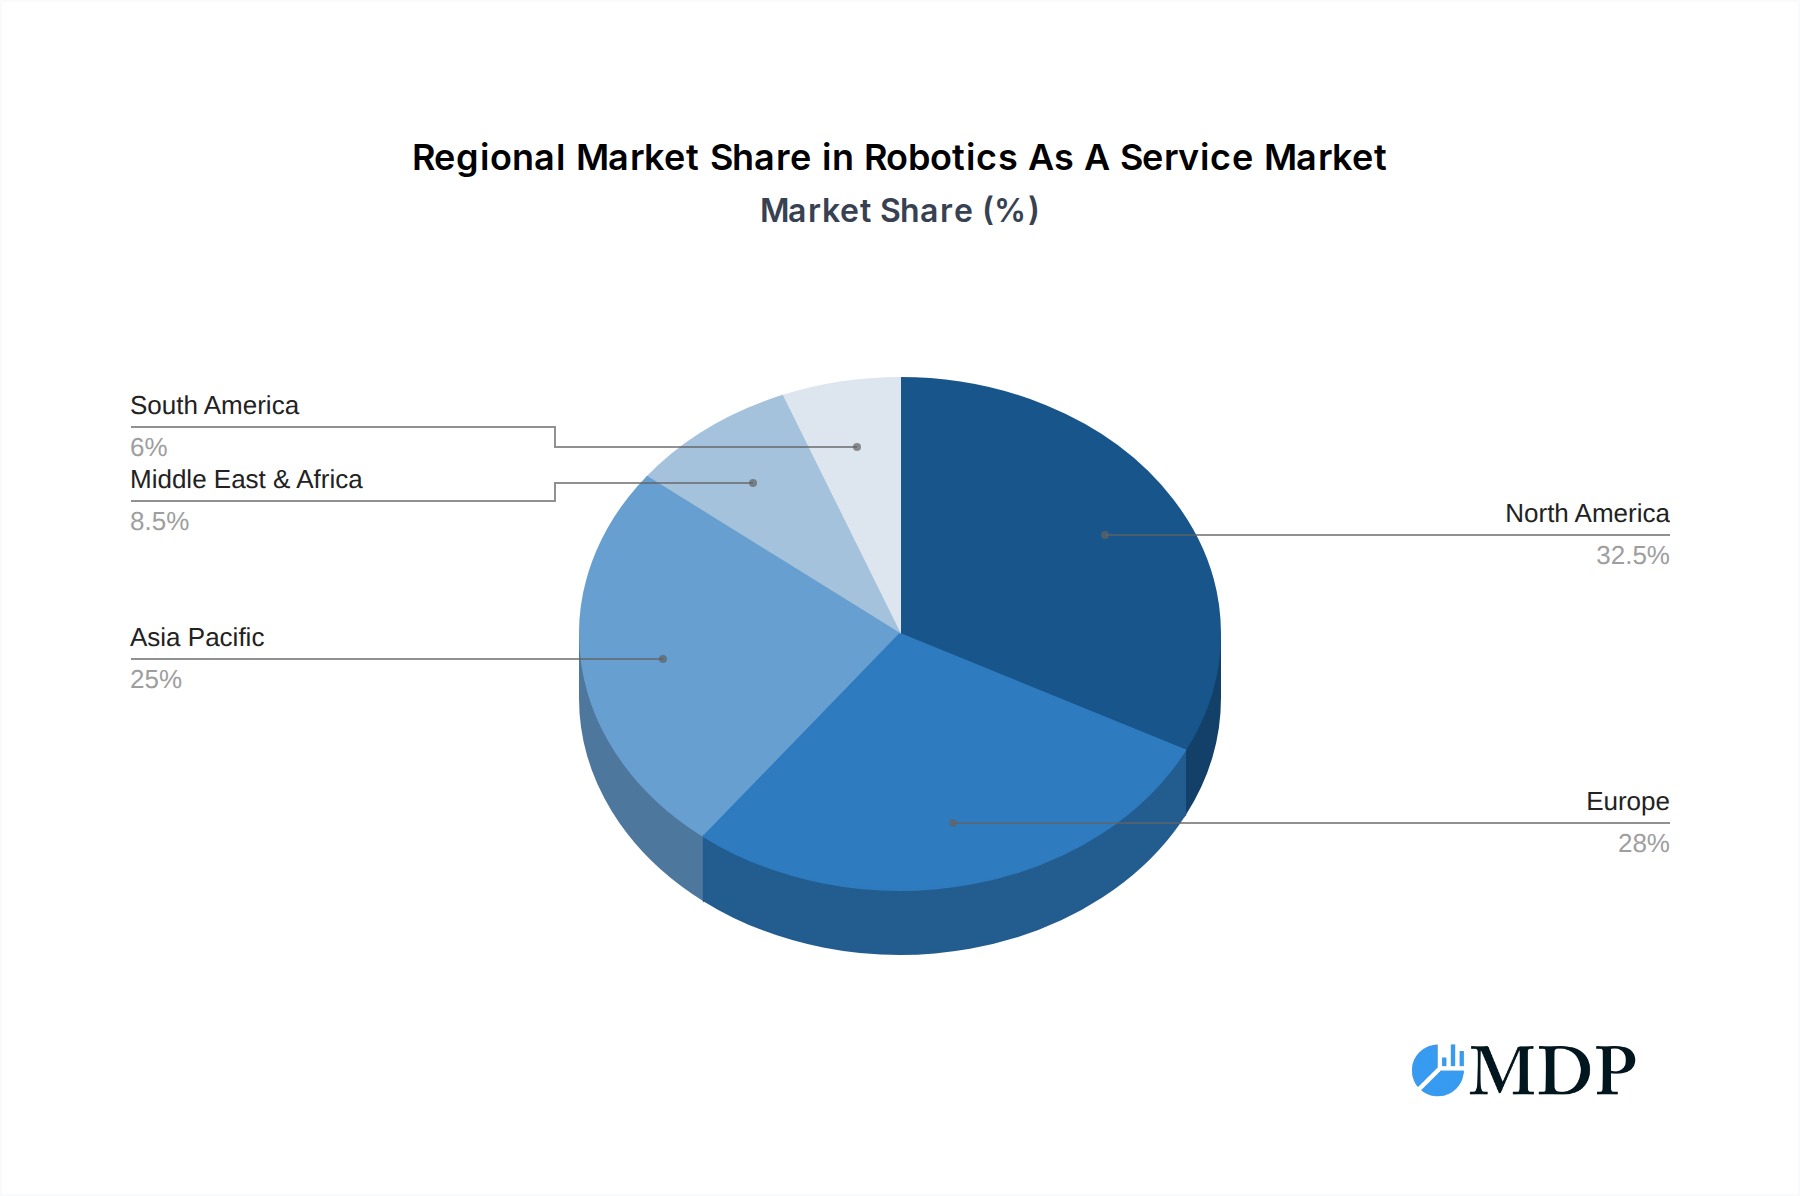
Robotics As A Service Regional Market Share
Geographic Coverage of Robotics As A Service
Robotics As A Service REPORT HIGHLIGHTS
| Aspects | Details |
|---|---|
| Study Period | 2020-2034 |
| Base Year | 2025 |
| Estimated Year | 2026 |
| Forecast Period | 2026-2034 |
| Historical Period | 2020-2025 |
| Growth Rate | CAGR of 20.5% from 2020-2034 |
| Segmentation |
|
Table of Contents
- 1. Introduction
- 1.1. Research Scope
- 1.2. Market Segmentation
- 1.3. Research Methodology
- 1.4. Definitions and Assumptions
- 2. Executive Summary
- 2.1. Introduction
- 3. Market Dynamics
- 3.1. Introduction
- 3.2. Market Drivers
- 3.3. Market Restrains
- 3.4. Market Trends
- 4. Market Factor Analysis
- 4.1. Porters Five Forces
- 4.2. Supply/Value Chain
- 4.3. PESTEL analysis
- 4.4. Market Entropy
- 4.5. Patent/Trademark Analysis
- 5. Global Robotics As A Service Analysis, Insights and Forecast, 2020-2032
- 5.1. Market Analysis, Insights and Forecast - by Application
- 5.1.1. IT & Telecom
- 5.1.2. BFSI
- 5.1.3. Defense
- 5.1.4. Logistics
- 5.1.5. Healthcare
- 5.1.6. Retail
- 5.1.7. Food & Beverage
- 5.1.8. Media & Entertainment
- 5.1.9. Others
- 5.2. Market Analysis, Insights and Forecast - by Type
- 5.2.1. Professional Service Robots
- 5.2.2. Personal Service Robots
- 5.3. Market Analysis, Insights and Forecast - by Region
- 5.3.1. North America
- 5.3.2. South America
- 5.3.3. Europe
- 5.3.4. Middle East & Africa
- 5.3.5. Asia Pacific
- 5.1. Market Analysis, Insights and Forecast - by Application
- 6. North America Robotics As A Service Analysis, Insights and Forecast, 2020-2032
- 6.1. Market Analysis, Insights and Forecast - by Application
- 6.1.1. IT & Telecom
- 6.1.2. BFSI
- 6.1.3. Defense
- 6.1.4. Logistics
- 6.1.5. Healthcare
- 6.1.6. Retail
- 6.1.7. Food & Beverage
- 6.1.8. Media & Entertainment
- 6.1.9. Others
- 6.2. Market Analysis, Insights and Forecast - by Type
- 6.2.1. Professional Service Robots
- 6.2.2. Personal Service Robots
- 6.1. Market Analysis, Insights and Forecast - by Application
- 7. South America Robotics As A Service Analysis, Insights and Forecast, 2020-2032
- 7.1. Market Analysis, Insights and Forecast - by Application
- 7.1.1. IT & Telecom
- 7.1.2. BFSI
- 7.1.3. Defense
- 7.1.4. Logistics
- 7.1.5. Healthcare
- 7.1.6. Retail
- 7.1.7. Food & Beverage
- 7.1.8. Media & Entertainment
- 7.1.9. Others
- 7.2. Market Analysis, Insights and Forecast - by Type
- 7.2.1. Professional Service Robots
- 7.2.2. Personal Service Robots
- 7.1. Market Analysis, Insights and Forecast - by Application
- 8. Europe Robotics As A Service Analysis, Insights and Forecast, 2020-2032
- 8.1. Market Analysis, Insights and Forecast - by Application
- 8.1.1. IT & Telecom
- 8.1.2. BFSI
- 8.1.3. Defense
- 8.1.4. Logistics
- 8.1.5. Healthcare
- 8.1.6. Retail
- 8.1.7. Food & Beverage
- 8.1.8. Media & Entertainment
- 8.1.9. Others
- 8.2. Market Analysis, Insights and Forecast - by Type
- 8.2.1. Professional Service Robots
- 8.2.2. Personal Service Robots
- 8.1. Market Analysis, Insights and Forecast - by Application
- 9. Middle East & Africa Robotics As A Service Analysis, Insights and Forecast, 2020-2032
- 9.1. Market Analysis, Insights and Forecast - by Application
- 9.1.1. IT & Telecom
- 9.1.2. BFSI
- 9.1.3. Defense
- 9.1.4. Logistics
- 9.1.5. Healthcare
- 9.1.6. Retail
- 9.1.7. Food & Beverage
- 9.1.8. Media & Entertainment
- 9.1.9. Others
- 9.2. Market Analysis, Insights and Forecast - by Type
- 9.2.1. Professional Service Robots
- 9.2.2. Personal Service Robots
- 9.1. Market Analysis, Insights and Forecast - by Application
- 10. Asia Pacific Robotics As A Service Analysis, Insights and Forecast, 2020-2032
- 10.1. Market Analysis, Insights and Forecast - by Application
- 10.1.1. IT & Telecom
- 10.1.2. BFSI
- 10.1.3. Defense
- 10.1.4. Logistics
- 10.1.5. Healthcare
- 10.1.6. Retail
- 10.1.7. Food & Beverage
- 10.1.8. Media & Entertainment
- 10.1.9. Others
- 10.2. Market Analysis, Insights and Forecast - by Type
- 10.2.1. Professional Service Robots
- 10.2.2. Personal Service Robots
- 10.1. Market Analysis, Insights and Forecast - by Application
- 11. Competitive Analysis
- 11.1. Global Market Share Analysis 2025
- 11.2. Company Profiles
- 11.2.1 iRobot
- 11.2.1.1. Overview
- 11.2.1.2. Products
- 11.2.1.3. SWOT Analysis
- 11.2.1.4. Recent Developments
- 11.2.1.5. Financials (Based on Availability)
- 11.2.2 Softbank
- 11.2.2.1. Overview
- 11.2.2.2. Products
- 11.2.2.3. SWOT Analysis
- 11.2.2.4. Recent Developments
- 11.2.2.5. Financials (Based on Availability)
- 11.2.3 Intuitive Surgical
- 11.2.3.1. Overview
- 11.2.3.2. Products
- 11.2.3.3. SWOT Analysis
- 11.2.3.4. Recent Developments
- 11.2.3.5. Financials (Based on Availability)
- 11.2.4 DeLaval
- 11.2.4.1. Overview
- 11.2.4.2. Products
- 11.2.4.3. SWOT Analysis
- 11.2.4.4. Recent Developments
- 11.2.4.5. Financials (Based on Availability)
- 11.2.5 Daifuku Co.
- 11.2.5.1. Overview
- 11.2.5.2. Products
- 11.2.5.3. SWOT Analysis
- 11.2.5.4. Recent Developments
- 11.2.5.5. Financials (Based on Availability)
- 11.2.6 CYBERDYNE INC.
- 11.2.6.1. Overview
- 11.2.6.2. Products
- 11.2.6.3. SWOT Analysis
- 11.2.6.4. Recent Developments
- 11.2.6.5. Financials (Based on Availability)
- 11.2.7 DJI
- 11.2.7.1. Overview
- 11.2.7.2. Products
- 11.2.7.3. SWOT Analysis
- 11.2.7.4. Recent Developments
- 11.2.7.5. Financials (Based on Availability)
- 11.2.8 KONGSBERG
- 11.2.8.1. Overview
- 11.2.8.2. Products
- 11.2.8.3. SWOT Analysis
- 11.2.8.4. Recent Developments
- 11.2.8.5. Financials (Based on Availability)
- 11.2.9 Northrop Grumman
- 11.2.9.1. Overview
- 11.2.9.2. Products
- 11.2.9.3. SWOT Analysis
- 11.2.9.4. Recent Developments
- 11.2.9.5. Financials (Based on Availability)
- 11.2.10 Neato Robotics
- 11.2.10.1. Overview
- 11.2.10.2. Products
- 11.2.10.3. SWOT Analysis
- 11.2.10.4. Recent Developments
- 11.2.10.5. Financials (Based on Availability)
- 11.2.11 ecoRobotix Ltd
- 11.2.11.1. Overview
- 11.2.11.2. Products
- 11.2.11.3. SWOT Analysis
- 11.2.11.4. Recent Developments
- 11.2.11.5. Financials (Based on Availability)
- 11.2.12 Starship Technologies
- 11.2.12.1. Overview
- 11.2.12.2. Products
- 11.2.12.3. SWOT Analysis
- 11.2.12.4. Recent Developments
- 11.2.12.5. Financials (Based on Availability)
- 11.2.13 KUKA AG
- 11.2.13.1. Overview
- 11.2.13.2. Products
- 11.2.13.3. SWOT Analysis
- 11.2.13.4. Recent Developments
- 11.2.13.5. Financials (Based on Availability)
- 11.2.14 Parrot
- 11.2.14.1. Overview
- 11.2.14.2. Products
- 11.2.14.3. SWOT Analysis
- 11.2.14.4. Recent Developments
- 11.2.14.5. Financials (Based on Availability)
- 11.2.15 Aethon
- 11.2.15.1. Overview
- 11.2.15.2. Products
- 11.2.15.3. SWOT Analysis
- 11.2.15.4. Recent Developments
- 11.2.15.5. Financials (Based on Availability)
- 11.2.16 Lely
- 11.2.16.1. Overview
- 11.2.16.2. Products
- 11.2.16.3. SWOT Analysis
- 11.2.16.4. Recent Developments
- 11.2.16.5. Financials (Based on Availability)
- 11.2.17 Dematic
- 11.2.17.1. Overview
- 11.2.17.2. Products
- 11.2.17.3. SWOT Analysis
- 11.2.17.4. Recent Developments
- 11.2.17.5. Financials (Based on Availability)
- 11.2.18 Bastian Solutions
- 11.2.18.1. Overview
- 11.2.18.2. Products
- 11.2.18.3. SWOT Analysis
- 11.2.18.4. Recent Developments
- 11.2.18.5. Financials (Based on Availability)
- 11.2.19 OMRON Corporation
- 11.2.19.1. Overview
- 11.2.19.2. Products
- 11.2.19.3. SWOT Analysis
- 11.2.19.4. Recent Developments
- 11.2.19.5. Financials (Based on Availability)
- 11.2.1 iRobot
List of Figures
- Figure 1: Global Robotics As A Service Revenue Breakdown (million, %) by Region 2025 & 2033
- Figure 2: North America Robotics As A Service Revenue (million), by Application 2025 & 2033
- Figure 3: North America Robotics As A Service Revenue Share (%), by Application 2025 & 2033
- Figure 4: North America Robotics As A Service Revenue (million), by Type 2025 & 2033
- Figure 5: North America Robotics As A Service Revenue Share (%), by Type 2025 & 2033
- Figure 6: North America Robotics As A Service Revenue (million), by Country 2025 & 2033
- Figure 7: North America Robotics As A Service Revenue Share (%), by Country 2025 & 2033
- Figure 8: South America Robotics As A Service Revenue (million), by Application 2025 & 2033
- Figure 9: South America Robotics As A Service Revenue Share (%), by Application 2025 & 2033
- Figure 10: South America Robotics As A Service Revenue (million), by Type 2025 & 2033
- Figure 11: South America Robotics As A Service Revenue Share (%), by Type 2025 & 2033
- Figure 12: South America Robotics As A Service Revenue (million), by Country 2025 & 2033
- Figure 13: South America Robotics As A Service Revenue Share (%), by Country 2025 & 2033
- Figure 14: Europe Robotics As A Service Revenue (million), by Application 2025 & 2033
- Figure 15: Europe Robotics As A Service Revenue Share (%), by Application 2025 & 2033
- Figure 16: Europe Robotics As A Service Revenue (million), by Type 2025 & 2033
- Figure 17: Europe Robotics As A Service Revenue Share (%), by Type 2025 & 2033
- Figure 18: Europe Robotics As A Service Revenue (million), by Country 2025 & 2033
- Figure 19: Europe Robotics As A Service Revenue Share (%), by Country 2025 & 2033
- Figure 20: Middle East & Africa Robotics As A Service Revenue (million), by Application 2025 & 2033
- Figure 21: Middle East & Africa Robotics As A Service Revenue Share (%), by Application 2025 & 2033
- Figure 22: Middle East & Africa Robotics As A Service Revenue (million), by Type 2025 & 2033
- Figure 23: Middle East & Africa Robotics As A Service Revenue Share (%), by Type 2025 & 2033
- Figure 24: Middle East & Africa Robotics As A Service Revenue (million), by Country 2025 & 2033
- Figure 25: Middle East & Africa Robotics As A Service Revenue Share (%), by Country 2025 & 2033
- Figure 26: Asia Pacific Robotics As A Service Revenue (million), by Application 2025 & 2033
- Figure 27: Asia Pacific Robotics As A Service Revenue Share (%), by Application 2025 & 2033
- Figure 28: Asia Pacific Robotics As A Service Revenue (million), by Type 2025 & 2033
- Figure 29: Asia Pacific Robotics As A Service Revenue Share (%), by Type 2025 & 2033
- Figure 30: Asia Pacific Robotics As A Service Revenue (million), by Country 2025 & 2033
- Figure 31: Asia Pacific Robotics As A Service Revenue Share (%), by Country 2025 & 2033
List of Tables
- Table 1: Global Robotics As A Service Revenue million Forecast, by Application 2020 & 2033
- Table 2: Global Robotics As A Service Revenue million Forecast, by Type 2020 & 2033
- Table 3: Global Robotics As A Service Revenue million Forecast, by Region 2020 & 2033
- Table 4: Global Robotics As A Service Revenue million Forecast, by Application 2020 & 2033
- Table 5: Global Robotics As A Service Revenue million Forecast, by Type 2020 & 2033
- Table 6: Global Robotics As A Service Revenue million Forecast, by Country 2020 & 2033
- Table 7: United States Robotics As A Service Revenue (million) Forecast, by Application 2020 & 2033
- Table 8: Canada Robotics As A Service Revenue (million) Forecast, by Application 2020 & 2033
- Table 9: Mexico Robotics As A Service Revenue (million) Forecast, by Application 2020 & 2033
- Table 10: Global Robotics As A Service Revenue million Forecast, by Application 2020 & 2033
- Table 11: Global Robotics As A Service Revenue million Forecast, by Type 2020 & 2033
- Table 12: Global Robotics As A Service Revenue million Forecast, by Country 2020 & 2033
- Table 13: Brazil Robotics As A Service Revenue (million) Forecast, by Application 2020 & 2033
- Table 14: Argentina Robotics As A Service Revenue (million) Forecast, by Application 2020 & 2033
- Table 15: Rest of South America Robotics As A Service Revenue (million) Forecast, by Application 2020 & 2033
- Table 16: Global Robotics As A Service Revenue million Forecast, by Application 2020 & 2033
- Table 17: Global Robotics As A Service Revenue million Forecast, by Type 2020 & 2033
- Table 18: Global Robotics As A Service Revenue million Forecast, by Country 2020 & 2033
- Table 19: United Kingdom Robotics As A Service Revenue (million) Forecast, by Application 2020 & 2033
- Table 20: Germany Robotics As A Service Revenue (million) Forecast, by Application 2020 & 2033
- Table 21: France Robotics As A Service Revenue (million) Forecast, by Application 2020 & 2033
- Table 22: Italy Robotics As A Service Revenue (million) Forecast, by Application 2020 & 2033
- Table 23: Spain Robotics As A Service Revenue (million) Forecast, by Application 2020 & 2033
- Table 24: Russia Robotics As A Service Revenue (million) Forecast, by Application 2020 & 2033
- Table 25: Benelux Robotics As A Service Revenue (million) Forecast, by Application 2020 & 2033
- Table 26: Nordics Robotics As A Service Revenue (million) Forecast, by Application 2020 & 2033
- Table 27: Rest of Europe Robotics As A Service Revenue (million) Forecast, by Application 2020 & 2033
- Table 28: Global Robotics As A Service Revenue million Forecast, by Application 2020 & 2033
- Table 29: Global Robotics As A Service Revenue million Forecast, by Type 2020 & 2033
- Table 30: Global Robotics As A Service Revenue million Forecast, by Country 2020 & 2033
- Table 31: Turkey Robotics As A Service Revenue (million) Forecast, by Application 2020 & 2033
- Table 32: Israel Robotics As A Service Revenue (million) Forecast, by Application 2020 & 2033
- Table 33: GCC Robotics As A Service Revenue (million) Forecast, by Application 2020 & 2033
- Table 34: North Africa Robotics As A Service Revenue (million) Forecast, by Application 2020 & 2033
- Table 35: South Africa Robotics As A Service Revenue (million) Forecast, by Application 2020 & 2033
- Table 36: Rest of Middle East & Africa Robotics As A Service Revenue (million) Forecast, by Application 2020 & 2033
- Table 37: Global Robotics As A Service Revenue million Forecast, by Application 2020 & 2033
- Table 38: Global Robotics As A Service Revenue million Forecast, by Type 2020 & 2033
- Table 39: Global Robotics As A Service Revenue million Forecast, by Country 2020 & 2033
- Table 40: China Robotics As A Service Revenue (million) Forecast, by Application 2020 & 2033
- Table 41: India Robotics As A Service Revenue (million) Forecast, by Application 2020 & 2033
- Table 42: Japan Robotics As A Service Revenue (million) Forecast, by Application 2020 & 2033
- Table 43: South Korea Robotics As A Service Revenue (million) Forecast, by Application 2020 & 2033
- Table 44: ASEAN Robotics As A Service Revenue (million) Forecast, by Application 2020 & 2033
- Table 45: Oceania Robotics As A Service Revenue (million) Forecast, by Application 2020 & 2033
- Table 46: Rest of Asia Pacific Robotics As A Service Revenue (million) Forecast, by Application 2020 & 2033
Frequently Asked Questions
1. What is the projected Compound Annual Growth Rate (CAGR) of the Robotics As A Service?
The projected CAGR is approximately 20.5%.
2. Which companies are prominent players in the Robotics As A Service?
Key companies in the market include iRobot, Softbank, Intuitive Surgical, DeLaval, Daifuku Co., CYBERDYNE INC., DJI, KONGSBERG, Northrop Grumman, Neato Robotics, ecoRobotix Ltd, Starship Technologies, KUKA AG, Parrot, Aethon, Lely, Dematic, Bastian Solutions, OMRON Corporation.
3. What are the main segments of the Robotics As A Service?
The market segments include Application, Type.
4. Can you provide details about the market size?
The market size is estimated to be USD 9664 million as of 2022.
5. What are some drivers contributing to market growth?
N/A
6. What are the notable trends driving market growth?
N/A
7. Are there any restraints impacting market growth?
N/A
8. Can you provide examples of recent developments in the market?
N/A
9. What pricing options are available for accessing the report?
Pricing options include single-user, multi-user, and enterprise licenses priced at USD 4250.00, USD 6375.00, and USD 8500.00 respectively.
10. Is the market size provided in terms of value or volume?
The market size is provided in terms of value, measured in million.
11. Are there any specific market keywords associated with the report?
Yes, the market keyword associated with the report is "Robotics As A Service," which aids in identifying and referencing the specific market segment covered.
12. How do I determine which pricing option suits my needs best?
The pricing options vary based on user requirements and access needs. Individual users may opt for single-user licenses, while businesses requiring broader access may choose multi-user or enterprise licenses for cost-effective access to the report.
13. Are there any additional resources or data provided in the Robotics As A Service report?
While the report offers comprehensive insights, it's advisable to review the specific contents or supplementary materials provided to ascertain if additional resources or data are available.
14. How can I stay updated on further developments or reports in the Robotics As A Service?
To stay informed about further developments, trends, and reports in the Robotics As A Service, consider subscribing to industry newsletters, following relevant companies and organizations, or regularly checking reputable industry news sources and publications.
Methodology
Step 1 - Identification of Relevant Samples Size from Population Database


Step 2 - Approaches for Defining Global Market Size (Value, Volume* & Price*)

Note*: In applicable scenarios
Step 3 - Data Sources
Primary Research
- Web Analytics
- Survey Reports
- Research Institute
- Latest Research Reports
- Opinion Leaders
Secondary Research
- Annual Reports
- White Paper
- Latest Press Release
- Industry Association
- Paid Database
- Investor Presentations

Step 4 - Data Triangulation
Involves using different sources of information in order to increase the validity of a study
These sources are likely to be stakeholders in a program - participants, other researchers, program staff, other community members, and so on.
Then we put all data in single framework & apply various statistical tools to find out the dynamic on the market.
During the analysis stage, feedback from the stakeholder groups would be compared to determine areas of agreement as well as areas of divergence