

Key Insights
The global Robotic Process Automation (RPA) service market is poised for significant expansion, projected to reach an estimated USD 912 million by 2025. This robust growth is underpinned by a compound annual growth rate (CAGR) of 6.3% throughout the forecast period (2025-2033). The primary drivers fueling this surge include the increasing demand for enhanced operational efficiency, cost reduction initiatives across various industries, and the growing need for improved accuracy and speed in business processes. Businesses are increasingly recognizing RPA's potential to automate repetitive, rule-based tasks, freeing up human resources for more strategic and value-added activities. The adoption of intelligent automation, which combines RPA with AI and machine learning, is further accelerating market penetration, enabling more complex problem-solving and decision-making capabilities.
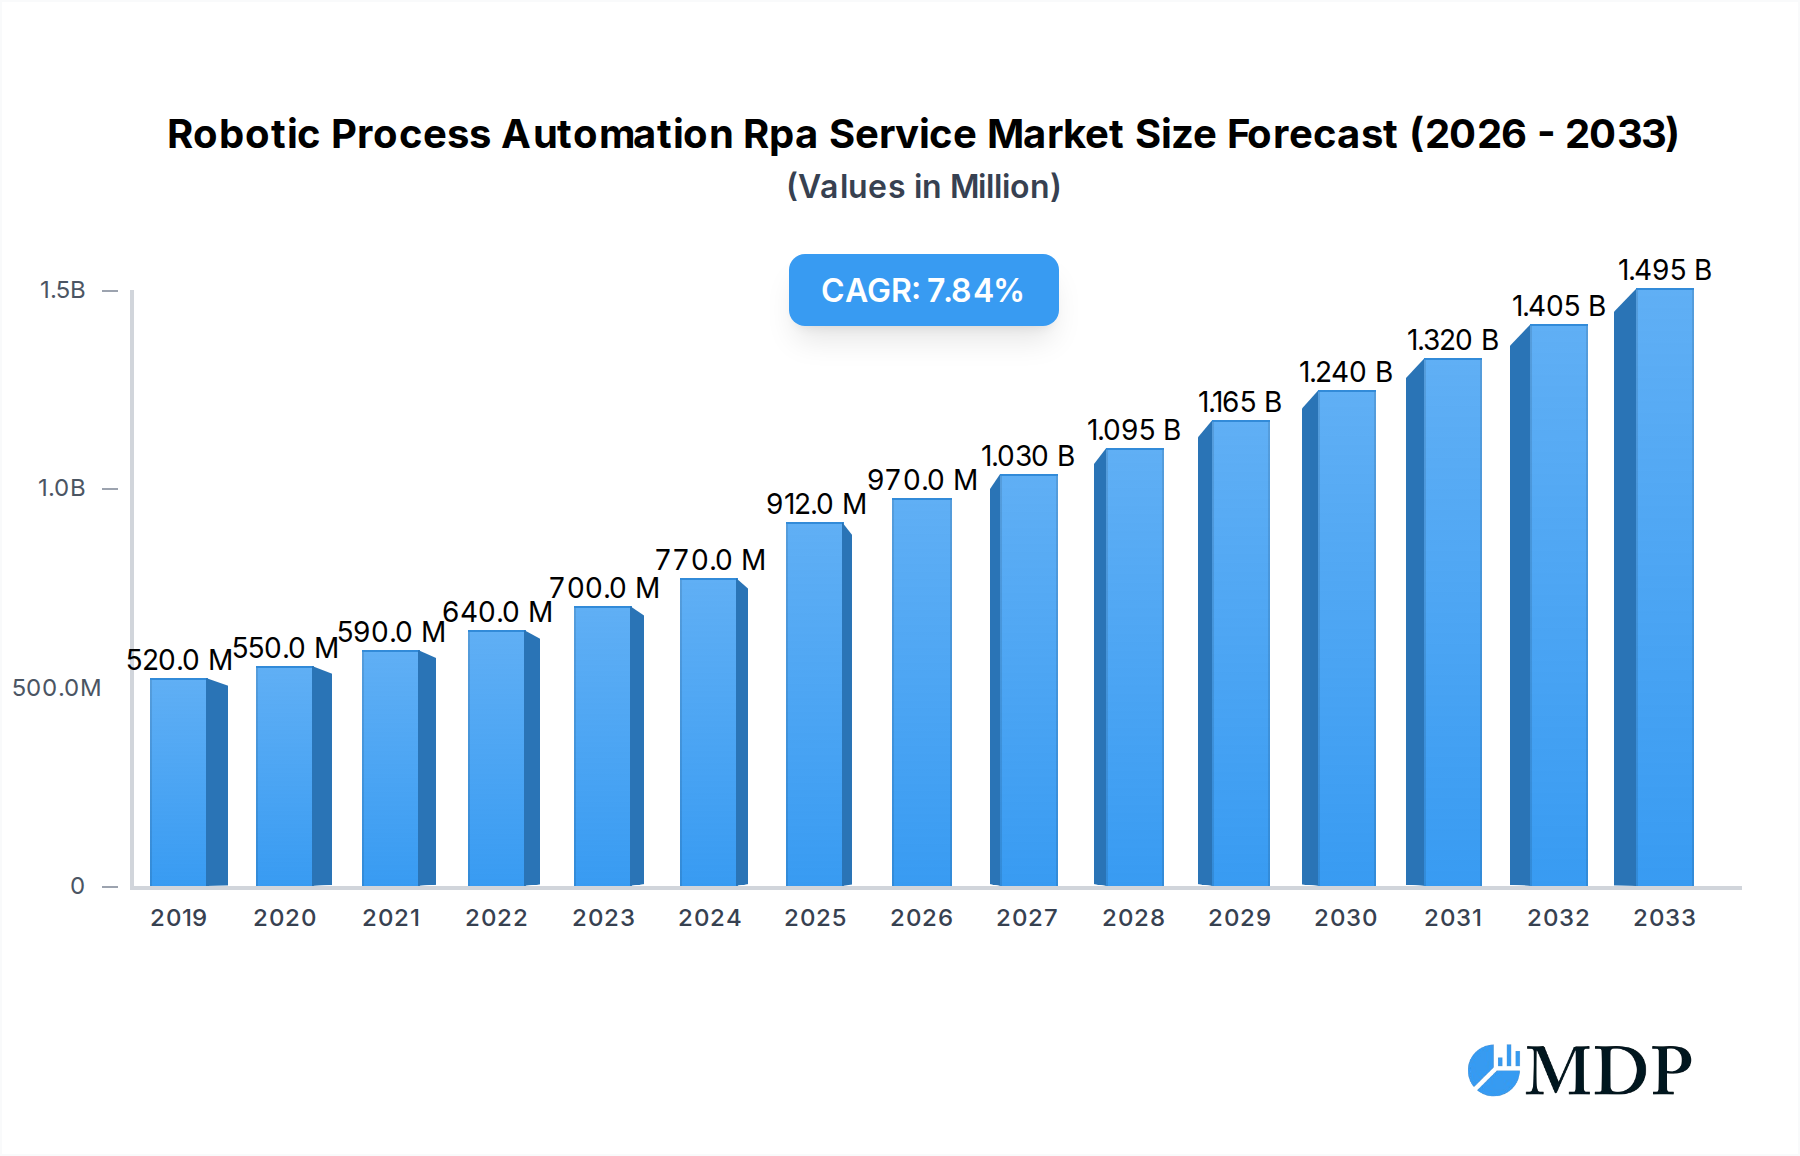
Robotic Process Automation Rpa Service Market Size (In Million)
The RPA service market is characterized by a diverse range of offerings, encompassing RPA consulting, automation design, development, infrastructure and automation support, and managed RPA services. Key industry segments benefiting from these services include BFSI, Retail, Manufacturing, Transport & Logistics, and Communications, each leveraging RPA to streamline operations and gain a competitive edge. While the market is experiencing rapid growth, potential restraints such as the initial investment cost, the need for skilled professionals, and concerns around data security and privacy could pose challenges. However, the continuous innovation in RPA technology, coupled with growing market awareness and successful implementation case studies, is expected to outweigh these restraints, driving sustained and substantial market expansion in the coming years.

Robotic Process Automation Rpa Service Company Market Share
Unlock the Future of Business Operations: Robotic Process Automation (RPA) Service Market Analysis
This comprehensive report delves into the dynamic landscape of Robotic Process Automation (RPA) services, providing critical insights for industry stakeholders looking to leverage intelligent automation for business transformation. Explore market trends, growth drivers, segmentation, leading players, and future opportunities within the RPA ecosystem. Our analysis covers the period from 2019 to 2033, with a base year of 2025, offering a detailed forecast for the evolving RPA services market. Discover how businesses are achieving significant operational efficiencies, cost reductions, and enhanced customer experiences through strategic RPA implementation. This report is essential for understanding the current state and future trajectory of RPA services, expected to generate xx million in revenue by 2025 and projected to grow at a Compound Annual Growth Rate (CAGR) of xx% during the forecast period.
Robotic Process Automation Rpa Service Market Dynamics & Concentration
The Robotic Process Automation (RPA) service market is characterized by a dynamic interplay of innovation, competition, and evolving end-user demands. Market concentration is moderately high, with a few key players dominating a significant portion of the market share, estimated at xx% by leading vendors in 2025. However, the increasing accessibility of RPA platforms and the emergence of specialized service providers are fostering a more competitive environment. Innovation drivers are primarily fueled by advancements in Artificial Intelligence (AI) and Machine Learning (ML), enabling more sophisticated automation capabilities, and the growing need for hyper-automation solutions across industries. Regulatory frameworks, while still developing, are increasingly focusing on data privacy and ethical AI deployment, influencing the design and implementation of RPA solutions. Product substitutes, such as traditional business process outsourcing (BPO) and in-house software development, exist but often lack the agility and cost-effectiveness of RPA. End-user trends indicate a strong preference for scalable, end-to-end automation solutions that address complex workflows. Mergers and acquisitions (M&A) are a notable feature, with an estimated xx significant M&A deals recorded in the historical period (2019-2024), indicating consolidation and strategic expansion efforts by key companies aiming to broaden their service offerings and market reach.
Robotic Process Automation Rpa Service Industry Trends & Analysis
The Robotic Process Automation (RPA) service industry is experiencing robust growth, propelled by the relentless pursuit of operational excellence and digital transformation across all business sectors. The market is projected to reach xx million in value by 2025, driven by an estimated CAGR of xx% from 2019 to 2033. This impressive growth trajectory is fueled by a confluence of factors including the increasing need for enhanced efficiency and productivity, significant cost reduction opportunities in repetitive task automation, and the imperative to improve accuracy and compliance. Technological disruptions are at the forefront, with the integration of AI and Machine Learning transforming RPA from simple rule-based automation to intelligent automation, capable of handling more complex decision-making processes and unstructured data. This evolution is paving the way for hyper-automation, where RPA is combined with other intelligent technologies like process mining, intelligent document processing, and advanced analytics to create end-to-end automated workflows. Consumer preferences are shifting towards solutions that offer faster deployment times, greater scalability, and a demonstrable return on investment (ROI). Businesses are increasingly looking for managed RPA services that alleviate the burden of managing and maintaining automation infrastructure, allowing them to focus on strategic initiatives. The competitive dynamics within the industry are intense, with established IT service giants and specialized RPA vendors vying for market share. Key players are continuously investing in research and development to offer advanced functionalities and specialized solutions tailored to specific industry needs. Market penetration is steadily increasing across various sectors, with early adopters demonstrating significant improvements in operational efficiency and customer satisfaction. The expansion into new and emerging markets, coupled with the growing awareness of RPA's benefits, promises sustained growth and innovation within the RPA service sector. The global market size is projected to expand beyond xx million by 2033.
Leading Markets & Segments in Robotic Process Automation Rpa Service
The Robotic Process Automation (RPA) service market exhibits significant dominance in specific regions and segments, driven by a combination of economic policies, robust infrastructure, and industry-specific needs.
Dominant Application Segments:
- BFSI (Banking, Financial Services, and Insurance): This segment is a leading adopter of RPA services, with an estimated market share of xx% in 2025. Key drivers include the need for enhanced security, compliance with stringent regulations, fraud detection, customer onboarding automation, and claims processing efficiency. The sheer volume of transactional data and repetitive tasks makes BFSI an ideal candidate for RPA.
- Manufacturing: The manufacturing sector is a strong contender, accounting for approximately xx% of the market. RPA implementation here focuses on supply chain optimization, inventory management, quality control automation, and production line monitoring, leading to substantial cost savings and improved throughput.
- Retail: With an estimated xx% market share, the retail sector leverages RPA for order processing, inventory management, customer service automation, pricing updates, and personalized marketing campaigns. The demand for seamless customer experiences and efficient back-office operations fuels RPA adoption.
Dominant Service Type Segments:
- Managed RPA Services: This segment holds a significant market position, estimated at xx%, as organizations increasingly prefer to outsource the management and maintenance of their RPA infrastructure, allowing them to focus on core business activities and strategic automation initiatives. This trend is further amplified by the need for 24/7 support and continuous optimization.
- RPA Development: Representing an estimated xx% of the market, RPA development remains crucial for designing, building, and deploying custom automation solutions tailored to specific business requirements. The demand for skilled RPA developers continues to be high.
- RPA Consulting: This segment, comprising approximately xx% of the market, is vital for guiding organizations through their RPA journey, from strategy formulation and process identification to implementation and change management. Expert advice ensures successful adoption and maximum ROI.
Geographic Dominance:
While detailed country-specific data is proprietary, North America and Europe are recognized as leading markets, driven by early adoption, strong technological infrastructure, and supportive regulatory environments. The Asia-Pacific region is emerging as a high-growth market due to increasing digital transformation initiatives and a growing awareness of RPA's benefits.
Robotic Process Automation Rpa Service Product Developments
Recent product developments in RPA services are characterized by a strong emphasis on intelligent automation and end-to-end process orchestration. Innovations are focused on enhancing bots' cognitive abilities through AI and ML integration, enabling them to handle unstructured data, make complex decisions, and learn from interactions. This leads to more sophisticated applications in areas like intelligent document processing, natural language processing (NLP) for customer service, and predictive analytics for operational insights. Competitive advantages are being carved out through solutions offering seamless integration with existing enterprise systems, robust security features, and user-friendly interfaces that empower citizen developers. The trend towards low-code/no-code RPA platforms is also accelerating, democratizing automation and fostering wider adoption across organizations. These advancements are crucial for meeting the evolving demands of industries seeking to achieve hyper-automation and significant operational efficiencies, driving the market towards a future of more autonomous business processes.
Key Drivers of Robotic Process Automation Rpa Service Growth
The growth of the Robotic Process Automation (RPA) service market is propelled by several key factors. Technologically, the integration of Artificial Intelligence (AI) and Machine Learning (ML) is enabling more sophisticated and intelligent automation, moving beyond simple task execution to complex decision-making. Economically, businesses are driven by the urgent need to reduce operational costs, increase process efficiency, and enhance productivity, with RPA offering a clear and demonstrable return on investment. Regulatory factors, particularly in highly regulated industries like BFSI and healthcare, necessitate increased accuracy and compliance, which RPA can significantly improve. Furthermore, the widespread digital transformation initiatives across all sectors are creating a fertile ground for RPA adoption as organizations seek to modernize their operations and improve customer experiences. The growing demand for enhanced data security and the reduction of human error in repetitive tasks also significantly contribute to this growth.
Challenges in the Robotic Process Automation Rpa Service Market
Despite its immense potential, the Robotic Process Automation (RPA) service market faces several challenges. Regulatory hurdles, particularly concerning data privacy and the ethical implications of AI-driven automation, can slow down adoption in certain sectors. Supply chain issues, while less direct for software-based RPA, can impact the availability of skilled personnel and specialized integration partners. Competitive pressures among vendors can lead to pricing wars, potentially impacting profitability. Additionally, the cost of initial implementation and the need for significant change management within organizations can act as a barrier for smaller enterprises. There's also a perceived complexity in integrating RPA with legacy systems, which requires specialized expertise. Furthermore, the ongoing need for continuous maintenance and updating of bots as business processes evolve can be a resource-intensive challenge for businesses.
Emerging Opportunities in Robotic Process Automation Rpa Service
The Robotic Process Automation (RPA) service market is ripe with emerging opportunities, driven by technological breakthroughs and strategic market expansion. The increasing convergence of RPA with other intelligent automation technologies, such as process mining, AI, and ML, is creating powerful hyper-automation solutions that can address complex end-to-end business processes. This opens up significant opportunities in areas like intelligent decision support, predictive maintenance, and advanced customer analytics. Strategic partnerships between RPA vendors, cloud service providers, and consulting firms are facilitating wider market reach and more comprehensive service offerings. Furthermore, the growing adoption of RPA in emerging economies and niche industries previously underserved by automation presents substantial growth potential. The demand for specialized RPA solutions tailored to specific industry challenges, such as cybersecurity automation or advanced supply chain visibility, is also a key area for future development and market penetration.
Leading Players in the Robotic Process Automation Rpa Service Sector
- Wipro
- Vuram
- Virtusa
- Tech Mahindra
- Tata Consultancy Services
- Sparsh
- RSM
- RPATech
- Roboyo Group
- PCCW Solutions
- NuAIg AI & RPA Consulting
- NIIT Technologies
- New Innovation Management
- Intellias
- IBM
- HGS
- Ernst & Young
- Emorphis Technologies
- Deloitte
- Bosch
- Bobsguide
- Auxis
- Atos
- Aspire Systems
- Altran
- ALTEN Calsoft Labs
- ALMATO
- Agilify
- Agile
- Aggranda
Key Milestones in Robotic Process Automation Rpa Service Industry
- 2019: Increased adoption of AI/ML in RPA platforms, enhancing bot capabilities for unstructured data processing.
- 2020: Significant surge in RPA demand for business continuity and remote work enablement during the global pandemic.
- 2021: Rise of hyper-automation strategies, integrating RPA with other intelligent technologies for end-to-end process automation.
- 2022: Growing focus on low-code/no-code RPA platforms, democratizing automation and empowering citizen developers.
- 2023: Expansion of RPA services into new industry verticals and emerging markets, driving global adoption.
- 2024: Increased emphasis on RPA governance, security, and ethical AI deployment as adoption matures.
- 2025: Continued innovation in AI-powered RPA, enabling more autonomous decision-making and predictive capabilities.
Strategic Outlook for Robotic Process Automation Rpa Service Market
The strategic outlook for the Robotic Process Automation (RPA) service market remains exceptionally strong, driven by an accelerated demand for digital transformation and operational efficiency. The future market will be shaped by the deeper integration of AI and ML, leading to more intelligent and autonomous automation capabilities. Hyper-automation, which orchestrates multiple automation technologies for end-to-end process optimization, will be a key growth accelerator. Strategic partnerships and collaborations will continue to be crucial for expanding service portfolios and market reach, especially in emerging economies. The emphasis on managed RPA services will grow as organizations seek to offload operational complexities and focus on strategic initiatives. Furthermore, the development of industry-specific RPA solutions and platforms tailored to unique business challenges will unlock new revenue streams and market opportunities, ensuring sustained growth and innovation in the years to come.
Robotic Process Automation Rpa Service Segmentation
-
1. Application
- 1.1. BFSI
- 1.2. Retail
- 1.3. Manufacturing
- 1.4. Transport & Logistics
- 1.5. Hospitality
- 1.6. Communications
- 1.7. Others
-
2. Type
- 2.1. RPA Consulting
- 2.2. Automation Design
- 2.3. RPA Development
- 2.4. Infrastructure and Automation Support
- 2.5. Managed RPA Services
- 2.6. Others
Robotic Process Automation Rpa Service Segmentation By Geography
-
1. North America
- 1.1. United States
- 1.2. Canada
- 1.3. Mexico
-
2. South America
- 2.1. Brazil
- 2.2. Argentina
- 2.3. Rest of South America
-
3. Europe
- 3.1. United Kingdom
- 3.2. Germany
- 3.3. France
- 3.4. Italy
- 3.5. Spain
- 3.6. Russia
- 3.7. Benelux
- 3.8. Nordics
- 3.9. Rest of Europe
-
4. Middle East & Africa
- 4.1. Turkey
- 4.2. Israel
- 4.3. GCC
- 4.4. North Africa
- 4.5. South Africa
- 4.6. Rest of Middle East & Africa
-
5. Asia Pacific
- 5.1. China
- 5.2. India
- 5.3. Japan
- 5.4. South Korea
- 5.5. ASEAN
- 5.6. Oceania
- 5.7. Rest of Asia Pacific
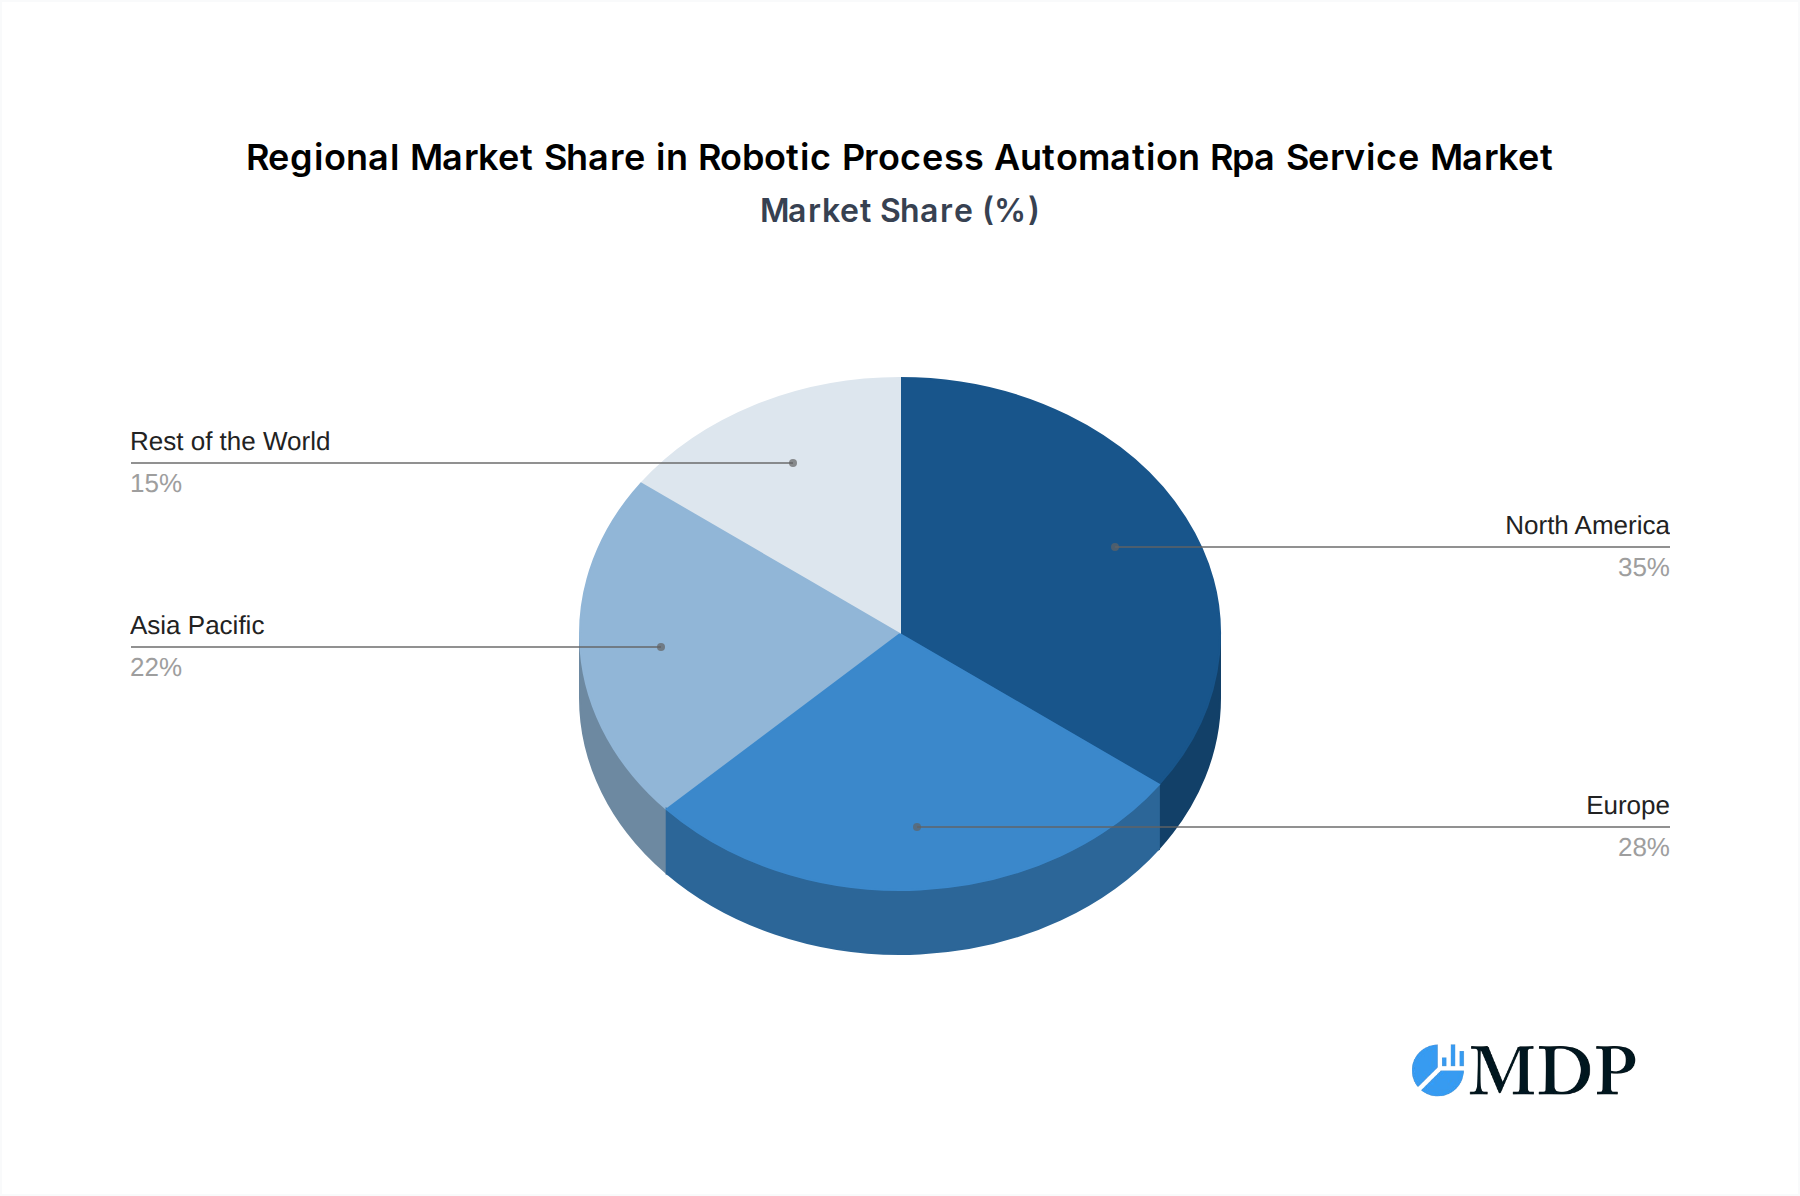
Robotic Process Automation Rpa Service Regional Market Share
Geographic Coverage of Robotic Process Automation Rpa Service
Robotic Process Automation Rpa Service REPORT HIGHLIGHTS
| Aspects | Details |
|---|---|
| Study Period | 2020-2034 |
| Base Year | 2025 |
| Estimated Year | 2026 |
| Forecast Period | 2026-2034 |
| Historical Period | 2020-2025 |
| Growth Rate | CAGR of 6.3% from 2020-2034 |
| Segmentation |
|
Table of Contents
- 1. Introduction
- 1.1. Research Scope
- 1.2. Market Segmentation
- 1.3. Research Methodology
- 1.4. Definitions and Assumptions
- 2. Executive Summary
- 2.1. Introduction
- 3. Market Dynamics
- 3.1. Introduction
- 3.2. Market Drivers
- 3.3. Market Restrains
- 3.4. Market Trends
- 4. Market Factor Analysis
- 4.1. Porters Five Forces
- 4.2. Supply/Value Chain
- 4.3. PESTEL analysis
- 4.4. Market Entropy
- 4.5. Patent/Trademark Analysis
- 5. Global Robotic Process Automation Rpa Service Analysis, Insights and Forecast, 2020-2032
- 5.1. Market Analysis, Insights and Forecast - by Application
- 5.1.1. BFSI
- 5.1.2. Retail
- 5.1.3. Manufacturing
- 5.1.4. Transport & Logistics
- 5.1.5. Hospitality
- 5.1.6. Communications
- 5.1.7. Others
- 5.2. Market Analysis, Insights and Forecast - by Type
- 5.2.1. RPA Consulting
- 5.2.2. Automation Design
- 5.2.3. RPA Development
- 5.2.4. Infrastructure and Automation Support
- 5.2.5. Managed RPA Services
- 5.2.6. Others
- 5.3. Market Analysis, Insights and Forecast - by Region
- 5.3.1. North America
- 5.3.2. South America
- 5.3.3. Europe
- 5.3.4. Middle East & Africa
- 5.3.5. Asia Pacific
- 5.1. Market Analysis, Insights and Forecast - by Application
- 6. North America Robotic Process Automation Rpa Service Analysis, Insights and Forecast, 2020-2032
- 6.1. Market Analysis, Insights and Forecast - by Application
- 6.1.1. BFSI
- 6.1.2. Retail
- 6.1.3. Manufacturing
- 6.1.4. Transport & Logistics
- 6.1.5. Hospitality
- 6.1.6. Communications
- 6.1.7. Others
- 6.2. Market Analysis, Insights and Forecast - by Type
- 6.2.1. RPA Consulting
- 6.2.2. Automation Design
- 6.2.3. RPA Development
- 6.2.4. Infrastructure and Automation Support
- 6.2.5. Managed RPA Services
- 6.2.6. Others
- 6.1. Market Analysis, Insights and Forecast - by Application
- 7. South America Robotic Process Automation Rpa Service Analysis, Insights and Forecast, 2020-2032
- 7.1. Market Analysis, Insights and Forecast - by Application
- 7.1.1. BFSI
- 7.1.2. Retail
- 7.1.3. Manufacturing
- 7.1.4. Transport & Logistics
- 7.1.5. Hospitality
- 7.1.6. Communications
- 7.1.7. Others
- 7.2. Market Analysis, Insights and Forecast - by Type
- 7.2.1. RPA Consulting
- 7.2.2. Automation Design
- 7.2.3. RPA Development
- 7.2.4. Infrastructure and Automation Support
- 7.2.5. Managed RPA Services
- 7.2.6. Others
- 7.1. Market Analysis, Insights and Forecast - by Application
- 8. Europe Robotic Process Automation Rpa Service Analysis, Insights and Forecast, 2020-2032
- 8.1. Market Analysis, Insights and Forecast - by Application
- 8.1.1. BFSI
- 8.1.2. Retail
- 8.1.3. Manufacturing
- 8.1.4. Transport & Logistics
- 8.1.5. Hospitality
- 8.1.6. Communications
- 8.1.7. Others
- 8.2. Market Analysis, Insights and Forecast - by Type
- 8.2.1. RPA Consulting
- 8.2.2. Automation Design
- 8.2.3. RPA Development
- 8.2.4. Infrastructure and Automation Support
- 8.2.5. Managed RPA Services
- 8.2.6. Others
- 8.1. Market Analysis, Insights and Forecast - by Application
- 9. Middle East & Africa Robotic Process Automation Rpa Service Analysis, Insights and Forecast, 2020-2032
- 9.1. Market Analysis, Insights and Forecast - by Application
- 9.1.1. BFSI
- 9.1.2. Retail
- 9.1.3. Manufacturing
- 9.1.4. Transport & Logistics
- 9.1.5. Hospitality
- 9.1.6. Communications
- 9.1.7. Others
- 9.2. Market Analysis, Insights and Forecast - by Type
- 9.2.1. RPA Consulting
- 9.2.2. Automation Design
- 9.2.3. RPA Development
- 9.2.4. Infrastructure and Automation Support
- 9.2.5. Managed RPA Services
- 9.2.6. Others
- 9.1. Market Analysis, Insights and Forecast - by Application
- 10. Asia Pacific Robotic Process Automation Rpa Service Analysis, Insights and Forecast, 2020-2032
- 10.1. Market Analysis, Insights and Forecast - by Application
- 10.1.1. BFSI
- 10.1.2. Retail
- 10.1.3. Manufacturing
- 10.1.4. Transport & Logistics
- 10.1.5. Hospitality
- 10.1.6. Communications
- 10.1.7. Others
- 10.2. Market Analysis, Insights and Forecast - by Type
- 10.2.1. RPA Consulting
- 10.2.2. Automation Design
- 10.2.3. RPA Development
- 10.2.4. Infrastructure and Automation Support
- 10.2.5. Managed RPA Services
- 10.2.6. Others
- 10.1. Market Analysis, Insights and Forecast - by Application
- 11. Competitive Analysis
- 11.1. Global Market Share Analysis 2025
- 11.2. Company Profiles
- 11.2.1 Wipro
- 11.2.1.1. Overview
- 11.2.1.2. Products
- 11.2.1.3. SWOT Analysis
- 11.2.1.4. Recent Developments
- 11.2.1.5. Financials (Based on Availability)
- 11.2.2 Vuram
- 11.2.2.1. Overview
- 11.2.2.2. Products
- 11.2.2.3. SWOT Analysis
- 11.2.2.4. Recent Developments
- 11.2.2.5. Financials (Based on Availability)
- 11.2.3 Virtusa
- 11.2.3.1. Overview
- 11.2.3.2. Products
- 11.2.3.3. SWOT Analysis
- 11.2.3.4. Recent Developments
- 11.2.3.5. Financials (Based on Availability)
- 11.2.4 Tech Mahindra
- 11.2.4.1. Overview
- 11.2.4.2. Products
- 11.2.4.3. SWOT Analysis
- 11.2.4.4. Recent Developments
- 11.2.4.5. Financials (Based on Availability)
- 11.2.5 Tata Consultancy Services
- 11.2.5.1. Overview
- 11.2.5.2. Products
- 11.2.5.3. SWOT Analysis
- 11.2.5.4. Recent Developments
- 11.2.5.5. Financials (Based on Availability)
- 11.2.6 Sparsh
- 11.2.6.1. Overview
- 11.2.6.2. Products
- 11.2.6.3. SWOT Analysis
- 11.2.6.4. Recent Developments
- 11.2.6.5. Financials (Based on Availability)
- 11.2.7 RSM
- 11.2.7.1. Overview
- 11.2.7.2. Products
- 11.2.7.3. SWOT Analysis
- 11.2.7.4. Recent Developments
- 11.2.7.5. Financials (Based on Availability)
- 11.2.8 RPATech
- 11.2.8.1. Overview
- 11.2.8.2. Products
- 11.2.8.3. SWOT Analysis
- 11.2.8.4. Recent Developments
- 11.2.8.5. Financials (Based on Availability)
- 11.2.9 Roboyo Group
- 11.2.9.1. Overview
- 11.2.9.2. Products
- 11.2.9.3. SWOT Analysis
- 11.2.9.4. Recent Developments
- 11.2.9.5. Financials (Based on Availability)
- 11.2.10 PCCW Solutions
- 11.2.10.1. Overview
- 11.2.10.2. Products
- 11.2.10.3. SWOT Analysis
- 11.2.10.4. Recent Developments
- 11.2.10.5. Financials (Based on Availability)
- 11.2.11 NuAIg AI & RPA Consulting
- 11.2.11.1. Overview
- 11.2.11.2. Products
- 11.2.11.3. SWOT Analysis
- 11.2.11.4. Recent Developments
- 11.2.11.5. Financials (Based on Availability)
- 11.2.12 NIIT Technologies
- 11.2.12.1. Overview
- 11.2.12.2. Products
- 11.2.12.3. SWOT Analysis
- 11.2.12.4. Recent Developments
- 11.2.12.5. Financials (Based on Availability)
- 11.2.13 New Innovation Management
- 11.2.13.1. Overview
- 11.2.13.2. Products
- 11.2.13.3. SWOT Analysis
- 11.2.13.4. Recent Developments
- 11.2.13.5. Financials (Based on Availability)
- 11.2.14 Intellias
- 11.2.14.1. Overview
- 11.2.14.2. Products
- 11.2.14.3. SWOT Analysis
- 11.2.14.4. Recent Developments
- 11.2.14.5. Financials (Based on Availability)
- 11.2.15 IBM
- 11.2.15.1. Overview
- 11.2.15.2. Products
- 11.2.15.3. SWOT Analysis
- 11.2.15.4. Recent Developments
- 11.2.15.5. Financials (Based on Availability)
- 11.2.16 HGS
- 11.2.16.1. Overview
- 11.2.16.2. Products
- 11.2.16.3. SWOT Analysis
- 11.2.16.4. Recent Developments
- 11.2.16.5. Financials (Based on Availability)
- 11.2.17 Ernst & Young
- 11.2.17.1. Overview
- 11.2.17.2. Products
- 11.2.17.3. SWOT Analysis
- 11.2.17.4. Recent Developments
- 11.2.17.5. Financials (Based on Availability)
- 11.2.18 Emorphis Technologies
- 11.2.18.1. Overview
- 11.2.18.2. Products
- 11.2.18.3. SWOT Analysis
- 11.2.18.4. Recent Developments
- 11.2.18.5. Financials (Based on Availability)
- 11.2.19 Deloitte
- 11.2.19.1. Overview
- 11.2.19.2. Products
- 11.2.19.3. SWOT Analysis
- 11.2.19.4. Recent Developments
- 11.2.19.5. Financials (Based on Availability)
- 11.2.20 Bosch
- 11.2.20.1. Overview
- 11.2.20.2. Products
- 11.2.20.3. SWOT Analysis
- 11.2.20.4. Recent Developments
- 11.2.20.5. Financials (Based on Availability)
- 11.2.21 Bobsguide
- 11.2.21.1. Overview
- 11.2.21.2. Products
- 11.2.21.3. SWOT Analysis
- 11.2.21.4. Recent Developments
- 11.2.21.5. Financials (Based on Availability)
- 11.2.22 Auxis
- 11.2.22.1. Overview
- 11.2.22.2. Products
- 11.2.22.3. SWOT Analysis
- 11.2.22.4. Recent Developments
- 11.2.22.5. Financials (Based on Availability)
- 11.2.23 Atos
- 11.2.23.1. Overview
- 11.2.23.2. Products
- 11.2.23.3. SWOT Analysis
- 11.2.23.4. Recent Developments
- 11.2.23.5. Financials (Based on Availability)
- 11.2.24 Aspire Systems
- 11.2.24.1. Overview
- 11.2.24.2. Products
- 11.2.24.3. SWOT Analysis
- 11.2.24.4. Recent Developments
- 11.2.24.5. Financials (Based on Availability)
- 11.2.25 Altran
- 11.2.25.1. Overview
- 11.2.25.2. Products
- 11.2.25.3. SWOT Analysis
- 11.2.25.4. Recent Developments
- 11.2.25.5. Financials (Based on Availability)
- 11.2.26 ALTEN Calsoft Labs
- 11.2.26.1. Overview
- 11.2.26.2. Products
- 11.2.26.3. SWOT Analysis
- 11.2.26.4. Recent Developments
- 11.2.26.5. Financials (Based on Availability)
- 11.2.27 ALMATO
- 11.2.27.1. Overview
- 11.2.27.2. Products
- 11.2.27.3. SWOT Analysis
- 11.2.27.4. Recent Developments
- 11.2.27.5. Financials (Based on Availability)
- 11.2.28 Agilify
- 11.2.28.1. Overview
- 11.2.28.2. Products
- 11.2.28.3. SWOT Analysis
- 11.2.28.4. Recent Developments
- 11.2.28.5. Financials (Based on Availability)
- 11.2.29 Agile
- 11.2.29.1. Overview
- 11.2.29.2. Products
- 11.2.29.3. SWOT Analysis
- 11.2.29.4. Recent Developments
- 11.2.29.5. Financials (Based on Availability)
- 11.2.30 Aggranda
- 11.2.30.1. Overview
- 11.2.30.2. Products
- 11.2.30.3. SWOT Analysis
- 11.2.30.4. Recent Developments
- 11.2.30.5. Financials (Based on Availability)
- 11.2.1 Wipro
List of Figures
- Figure 1: Global Robotic Process Automation Rpa Service Revenue Breakdown (million, %) by Region 2025 & 2033
- Figure 2: North America Robotic Process Automation Rpa Service Revenue (million), by Application 2025 & 2033
- Figure 3: North America Robotic Process Automation Rpa Service Revenue Share (%), by Application 2025 & 2033
- Figure 4: North America Robotic Process Automation Rpa Service Revenue (million), by Type 2025 & 2033
- Figure 5: North America Robotic Process Automation Rpa Service Revenue Share (%), by Type 2025 & 2033
- Figure 6: North America Robotic Process Automation Rpa Service Revenue (million), by Country 2025 & 2033
- Figure 7: North America Robotic Process Automation Rpa Service Revenue Share (%), by Country 2025 & 2033
- Figure 8: South America Robotic Process Automation Rpa Service Revenue (million), by Application 2025 & 2033
- Figure 9: South America Robotic Process Automation Rpa Service Revenue Share (%), by Application 2025 & 2033
- Figure 10: South America Robotic Process Automation Rpa Service Revenue (million), by Type 2025 & 2033
- Figure 11: South America Robotic Process Automation Rpa Service Revenue Share (%), by Type 2025 & 2033
- Figure 12: South America Robotic Process Automation Rpa Service Revenue (million), by Country 2025 & 2033
- Figure 13: South America Robotic Process Automation Rpa Service Revenue Share (%), by Country 2025 & 2033
- Figure 14: Europe Robotic Process Automation Rpa Service Revenue (million), by Application 2025 & 2033
- Figure 15: Europe Robotic Process Automation Rpa Service Revenue Share (%), by Application 2025 & 2033
- Figure 16: Europe Robotic Process Automation Rpa Service Revenue (million), by Type 2025 & 2033
- Figure 17: Europe Robotic Process Automation Rpa Service Revenue Share (%), by Type 2025 & 2033
- Figure 18: Europe Robotic Process Automation Rpa Service Revenue (million), by Country 2025 & 2033
- Figure 19: Europe Robotic Process Automation Rpa Service Revenue Share (%), by Country 2025 & 2033
- Figure 20: Middle East & Africa Robotic Process Automation Rpa Service Revenue (million), by Application 2025 & 2033
- Figure 21: Middle East & Africa Robotic Process Automation Rpa Service Revenue Share (%), by Application 2025 & 2033
- Figure 22: Middle East & Africa Robotic Process Automation Rpa Service Revenue (million), by Type 2025 & 2033
- Figure 23: Middle East & Africa Robotic Process Automation Rpa Service Revenue Share (%), by Type 2025 & 2033
- Figure 24: Middle East & Africa Robotic Process Automation Rpa Service Revenue (million), by Country 2025 & 2033
- Figure 25: Middle East & Africa Robotic Process Automation Rpa Service Revenue Share (%), by Country 2025 & 2033
- Figure 26: Asia Pacific Robotic Process Automation Rpa Service Revenue (million), by Application 2025 & 2033
- Figure 27: Asia Pacific Robotic Process Automation Rpa Service Revenue Share (%), by Application 2025 & 2033
- Figure 28: Asia Pacific Robotic Process Automation Rpa Service Revenue (million), by Type 2025 & 2033
- Figure 29: Asia Pacific Robotic Process Automation Rpa Service Revenue Share (%), by Type 2025 & 2033
- Figure 30: Asia Pacific Robotic Process Automation Rpa Service Revenue (million), by Country 2025 & 2033
- Figure 31: Asia Pacific Robotic Process Automation Rpa Service Revenue Share (%), by Country 2025 & 2033
List of Tables
- Table 1: Global Robotic Process Automation Rpa Service Revenue million Forecast, by Application 2020 & 2033
- Table 2: Global Robotic Process Automation Rpa Service Revenue million Forecast, by Type 2020 & 2033
- Table 3: Global Robotic Process Automation Rpa Service Revenue million Forecast, by Region 2020 & 2033
- Table 4: Global Robotic Process Automation Rpa Service Revenue million Forecast, by Application 2020 & 2033
- Table 5: Global Robotic Process Automation Rpa Service Revenue million Forecast, by Type 2020 & 2033
- Table 6: Global Robotic Process Automation Rpa Service Revenue million Forecast, by Country 2020 & 2033
- Table 7: United States Robotic Process Automation Rpa Service Revenue (million) Forecast, by Application 2020 & 2033
- Table 8: Canada Robotic Process Automation Rpa Service Revenue (million) Forecast, by Application 2020 & 2033
- Table 9: Mexico Robotic Process Automation Rpa Service Revenue (million) Forecast, by Application 2020 & 2033
- Table 10: Global Robotic Process Automation Rpa Service Revenue million Forecast, by Application 2020 & 2033
- Table 11: Global Robotic Process Automation Rpa Service Revenue million Forecast, by Type 2020 & 2033
- Table 12: Global Robotic Process Automation Rpa Service Revenue million Forecast, by Country 2020 & 2033
- Table 13: Brazil Robotic Process Automation Rpa Service Revenue (million) Forecast, by Application 2020 & 2033
- Table 14: Argentina Robotic Process Automation Rpa Service Revenue (million) Forecast, by Application 2020 & 2033
- Table 15: Rest of South America Robotic Process Automation Rpa Service Revenue (million) Forecast, by Application 2020 & 2033
- Table 16: Global Robotic Process Automation Rpa Service Revenue million Forecast, by Application 2020 & 2033
- Table 17: Global Robotic Process Automation Rpa Service Revenue million Forecast, by Type 2020 & 2033
- Table 18: Global Robotic Process Automation Rpa Service Revenue million Forecast, by Country 2020 & 2033
- Table 19: United Kingdom Robotic Process Automation Rpa Service Revenue (million) Forecast, by Application 2020 & 2033
- Table 20: Germany Robotic Process Automation Rpa Service Revenue (million) Forecast, by Application 2020 & 2033
- Table 21: France Robotic Process Automation Rpa Service Revenue (million) Forecast, by Application 2020 & 2033
- Table 22: Italy Robotic Process Automation Rpa Service Revenue (million) Forecast, by Application 2020 & 2033
- Table 23: Spain Robotic Process Automation Rpa Service Revenue (million) Forecast, by Application 2020 & 2033
- Table 24: Russia Robotic Process Automation Rpa Service Revenue (million) Forecast, by Application 2020 & 2033
- Table 25: Benelux Robotic Process Automation Rpa Service Revenue (million) Forecast, by Application 2020 & 2033
- Table 26: Nordics Robotic Process Automation Rpa Service Revenue (million) Forecast, by Application 2020 & 2033
- Table 27: Rest of Europe Robotic Process Automation Rpa Service Revenue (million) Forecast, by Application 2020 & 2033
- Table 28: Global Robotic Process Automation Rpa Service Revenue million Forecast, by Application 2020 & 2033
- Table 29: Global Robotic Process Automation Rpa Service Revenue million Forecast, by Type 2020 & 2033
- Table 30: Global Robotic Process Automation Rpa Service Revenue million Forecast, by Country 2020 & 2033
- Table 31: Turkey Robotic Process Automation Rpa Service Revenue (million) Forecast, by Application 2020 & 2033
- Table 32: Israel Robotic Process Automation Rpa Service Revenue (million) Forecast, by Application 2020 & 2033
- Table 33: GCC Robotic Process Automation Rpa Service Revenue (million) Forecast, by Application 2020 & 2033
- Table 34: North Africa Robotic Process Automation Rpa Service Revenue (million) Forecast, by Application 2020 & 2033
- Table 35: South Africa Robotic Process Automation Rpa Service Revenue (million) Forecast, by Application 2020 & 2033
- Table 36: Rest of Middle East & Africa Robotic Process Automation Rpa Service Revenue (million) Forecast, by Application 2020 & 2033
- Table 37: Global Robotic Process Automation Rpa Service Revenue million Forecast, by Application 2020 & 2033
- Table 38: Global Robotic Process Automation Rpa Service Revenue million Forecast, by Type 2020 & 2033
- Table 39: Global Robotic Process Automation Rpa Service Revenue million Forecast, by Country 2020 & 2033
- Table 40: China Robotic Process Automation Rpa Service Revenue (million) Forecast, by Application 2020 & 2033
- Table 41: India Robotic Process Automation Rpa Service Revenue (million) Forecast, by Application 2020 & 2033
- Table 42: Japan Robotic Process Automation Rpa Service Revenue (million) Forecast, by Application 2020 & 2033
- Table 43: South Korea Robotic Process Automation Rpa Service Revenue (million) Forecast, by Application 2020 & 2033
- Table 44: ASEAN Robotic Process Automation Rpa Service Revenue (million) Forecast, by Application 2020 & 2033
- Table 45: Oceania Robotic Process Automation Rpa Service Revenue (million) Forecast, by Application 2020 & 2033
- Table 46: Rest of Asia Pacific Robotic Process Automation Rpa Service Revenue (million) Forecast, by Application 2020 & 2033
Frequently Asked Questions
1. What is the projected Compound Annual Growth Rate (CAGR) of the Robotic Process Automation Rpa Service?
The projected CAGR is approximately 6.3%.
2. Which companies are prominent players in the Robotic Process Automation Rpa Service?
Key companies in the market include Wipro, Vuram, Virtusa, Tech Mahindra, Tata Consultancy Services, Sparsh, RSM, RPATech, Roboyo Group, PCCW Solutions, NuAIg AI & RPA Consulting, NIIT Technologies, New Innovation Management, Intellias, IBM, HGS, Ernst & Young, Emorphis Technologies, Deloitte, Bosch, Bobsguide, Auxis, Atos, Aspire Systems, Altran, ALTEN Calsoft Labs, ALMATO, Agilify, Agile, Aggranda.
3. What are the main segments of the Robotic Process Automation Rpa Service?
The market segments include Application, Type.
4. Can you provide details about the market size?
The market size is estimated to be USD 912 million as of 2022.
5. What are some drivers contributing to market growth?
N/A
6. What are the notable trends driving market growth?
N/A
7. Are there any restraints impacting market growth?
N/A
8. Can you provide examples of recent developments in the market?
N/A
9. What pricing options are available for accessing the report?
Pricing options include single-user, multi-user, and enterprise licenses priced at USD 2900.00, USD 4350.00, and USD 5800.00 respectively.
10. Is the market size provided in terms of value or volume?
The market size is provided in terms of value, measured in million.
11. Are there any specific market keywords associated with the report?
Yes, the market keyword associated with the report is "Robotic Process Automation Rpa Service," which aids in identifying and referencing the specific market segment covered.
12. How do I determine which pricing option suits my needs best?
The pricing options vary based on user requirements and access needs. Individual users may opt for single-user licenses, while businesses requiring broader access may choose multi-user or enterprise licenses for cost-effective access to the report.
13. Are there any additional resources or data provided in the Robotic Process Automation Rpa Service report?
While the report offers comprehensive insights, it's advisable to review the specific contents or supplementary materials provided to ascertain if additional resources or data are available.
14. How can I stay updated on further developments or reports in the Robotic Process Automation Rpa Service?
To stay informed about further developments, trends, and reports in the Robotic Process Automation Rpa Service, consider subscribing to industry newsletters, following relevant companies and organizations, or regularly checking reputable industry news sources and publications.
Methodology
Step 1 - Identification of Relevant Samples Size from Population Database


Step 2 - Approaches for Defining Global Market Size (Value, Volume* & Price*)

Note*: In applicable scenarios
Step 3 - Data Sources
Primary Research
- Web Analytics
- Survey Reports
- Research Institute
- Latest Research Reports
- Opinion Leaders
Secondary Research
- Annual Reports
- White Paper
- Latest Press Release
- Industry Association
- Paid Database
- Investor Presentations

Step 4 - Data Triangulation
Involves using different sources of information in order to increase the validity of a study
These sources are likely to be stakeholders in a program - participants, other researchers, program staff, other community members, and so on.
Then we put all data in single framework & apply various statistical tools to find out the dynamic on the market.
During the analysis stage, feedback from the stakeholder groups would be compared to determine areas of agreement as well as areas of divergence