

Key Insights
The global Recreation Management Software market is poised for significant expansion, projected to reach an estimated USD 5.94 billion in 2025, driven by a robust CAGR of 10.91% through 2033. This substantial growth is fueled by the increasing demand for streamlined operations within community parks, recreation departments, and educational institutions. As organizations across these sectors prioritize enhanced user experiences, efficient resource allocation, and simplified administrative processes, the adoption of comprehensive recreation management solutions is becoming indispensable. The burgeoning trend towards digital transformation in public and private recreational facilities further propels market growth. This includes the need for intuitive registration and membership management systems, sophisticated ticketing and event management capabilities, and integrated venue management platforms that optimize scheduling, resource booking, and communication. The rise of hybrid and in-person event models also necessitates flexible and scalable software solutions, underpinning the software's pivotal role in the modern recreational landscape.
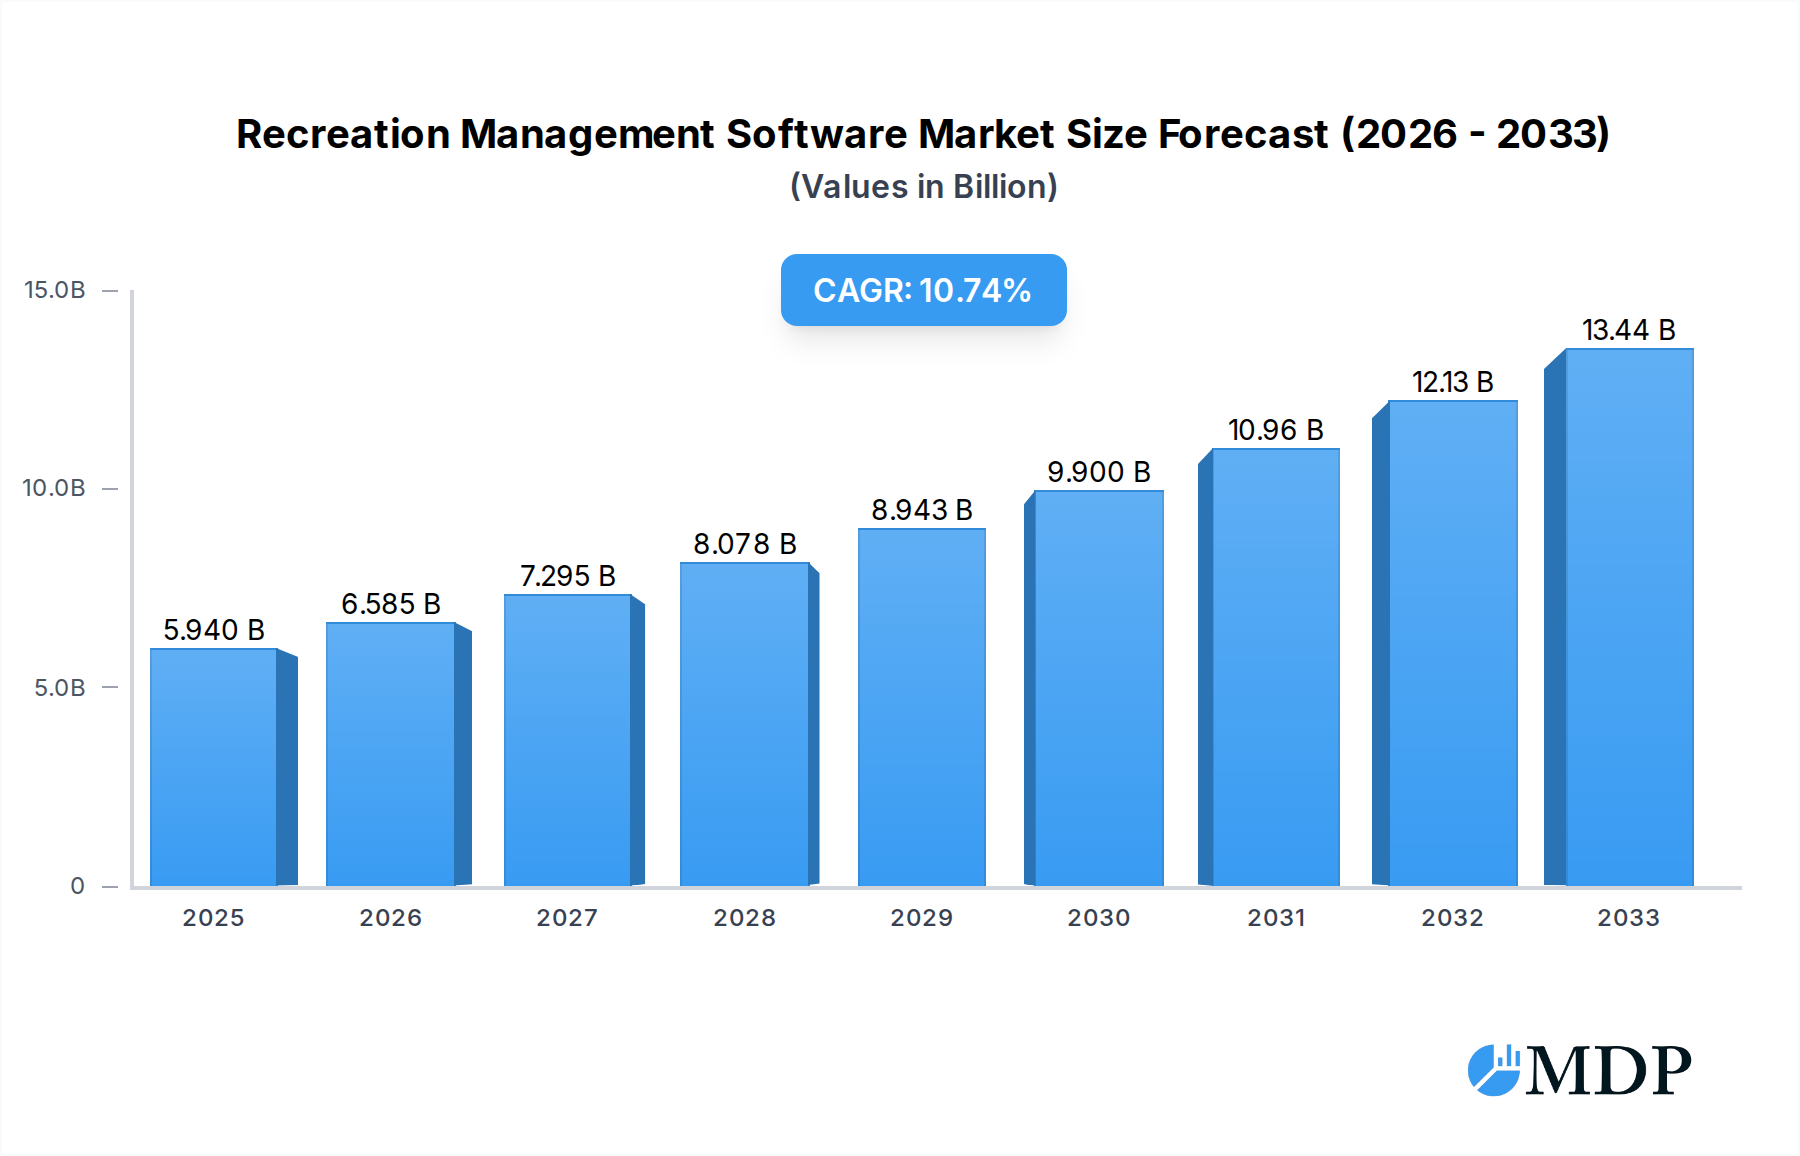
Recreation Management Software Market Size (In Billion)
The market is expected to witness sustained momentum owing to several key drivers, including the increasing focus on health and wellness initiatives and the subsequent rise in participation across various recreational activities. Furthermore, government initiatives promoting community engagement and the development of public recreational spaces are creating a fertile ground for recreation management software adoption. While the market enjoys strong growth prospects, certain restraints such as initial implementation costs and the need for skilled personnel to manage advanced features may pose challenges. However, the continuous innovation in cloud-based solutions and the growing emphasis on data analytics for informed decision-making are mitigating these concerns. The market is segmented into various applications, including Community Parks, Recreation Departments, Healthcare & Wellness, Education & Academics, and Sports Training Centers, each contributing to the overall market value. The types of software, such as Venue Management, Registrations & Membership Management, and Ticketing and Event Management, are crucial in addressing the diverse needs of these segments.

Recreation Management Software Company Market Share
Unlocking Potential: A Comprehensive Report on the Recreation Management Software Market (2019-2033)
This in-depth report provides a detailed analysis of the global Recreation Management Software market, encompassing a comprehensive study of its dynamics, trends, leading segments, product developments, growth drivers, challenges, and emerging opportunities. Leveraging extensive historical data from 2019-2024, a robust base year of 2025, and a forward-looking forecast period of 2025-2033, this report offers unparalleled insights for industry stakeholders, including recreation departments, community parks, healthcare and wellness providers, educational institutions, sports training centers, and technology providers like PerfectMind, EZFacility, Yardi System, Active Network, Civicplus, Legend Recreation Software, Jarvis Corporation, Daxko, RecDesk, MyRec, Dash Platform, Vermont Systems, InnoSoft Fusion.
Recreation Management Software Market Dynamics & Concentration
The Recreation Management Software market exhibits a moderate concentration, with a few key players like Active Network and Civicplus holding significant market share, estimated to be in the billions. Innovation drivers are predominantly fueled by the increasing demand for integrated digital solutions that streamline operations and enhance user experience. Regulatory frameworks, while generally supportive, can vary by region, influencing data privacy and accessibility standards, impacting market adoption. Product substitutes, such as standalone ticketing platforms or basic scheduling tools, exist but lack the comprehensive functionality of dedicated recreation management software, thus posing a limited threat. End-user trends highlight a strong preference for cloud-based solutions, mobile accessibility, and robust reporting capabilities. Mergers and acquisitions (M&A) activities are moderately prevalent, with an estimated xx billion in deal value and xx M&A deals recorded during the historical period, indicating a consolidation trend as companies seek to expand their service offerings and market reach.
Recreation Management Software Industry Trends & Analysis
The Recreation Management Software industry is poised for significant expansion, driven by a projected Compound Annual Growth Rate (CAGR) of approximately xx% during the forecast period. This robust growth is underpinned by several key factors. The increasing adoption of digital transformation initiatives across various sectors, from community parks and recreation departments to educational institutions and healthcare facilities, is a primary catalyst. As organizations strive for greater operational efficiency and enhanced patron engagement, the demand for sophisticated recreation management solutions escalates. Technological advancements are continuously reshaping the landscape, with cloud computing, artificial intelligence (AI), and the Internet of Things (IoT) enabling more intelligent and personalized user experiences. AI-powered analytics, for instance, are facilitating data-driven decision-making for facility management, program scheduling, and marketing efforts. Consumer preferences are shifting towards seamless online registration, self-service options, and personalized communication channels, all of which are core functionalities of modern recreation management software. The competitive dynamics are characterized by a blend of established market leaders and agile emerging players, each vying for market share through product innovation, strategic partnerships, and competitive pricing. Market penetration is steadily increasing across all segments, with an estimated xx% of potential users currently utilizing dedicated recreation management software, leaving substantial room for future growth. The growing emphasis on health and wellness initiatives also contributes significantly to market expansion, as these sectors increasingly rely on software to manage memberships, schedule classes, and track participant progress. Furthermore, the need for efficient venue management, from booking and scheduling to maintenance and resource allocation, is a constant driver for adoption across sports facilities and community centers. The integration of robust payment gateways and automated billing systems further enhances the appeal of these software solutions, reducing administrative burdens and improving financial management. The ongoing digital evolution necessitates continuous upgrades and feature enhancements, ensuring that the market remains dynamic and responsive to evolving user needs.
Leading Markets & Segments in Recreation Management Software
The Community Parks and Recreation Departments segment emerges as the dominant force in the Recreation Management Software market, driven by substantial government investment in public recreational infrastructure and a growing public demand for accessible leisure activities. Economic policies promoting public health and community well-being further bolster the adoption of these solutions. In terms of geographical dominance, North America currently leads, with a market share estimated to be in the billions, attributed to early technological adoption and a mature recreation sector.
- Key Drivers for Community Parks & Recreation Departments Dominance:
- Government Funding & Initiatives: Increased allocation of public funds towards parks, community centers, and recreational programs.
- Growing Health & Wellness Awareness: Public emphasis on physical activity and outdoor recreation.
- Need for Efficient Operations: Streamlining registration, scheduling, and facility management for large-scale public services.
- Data Management & Reporting: Requirement for tracking usage, revenue, and program effectiveness for accountability.
The Registrations & Membership Management type holds significant sway, as it forms the core functionality for most recreation providers, enabling seamless sign-ups for programs, events, and facility access. This directly supports the operational efficiency of organizations within the Education & Academics sector, where managing student participation in sports and extracurricular activities is paramount.
- Key Drivers for Registrations & Membership Management Dominance:
- Streamlined User Onboarding: Facilitating easy sign-ups and renewals for members and participants.
- Automated Billing & Payments: Simplifying revenue collection and financial reconciliation.
- Centralized Data Management: Providing a single source of truth for member information and activity history.
- Enhanced Member Engagement: Enabling personalized communication and program recommendations.
Healthcare & Wellness providers are also demonstrating accelerated adoption, driven by the need to manage fitness classes, personal training sessions, and member wellness programs efficiently. This trend is further amplified by the increasing focus on preventative healthcare and the role of recreational activities in overall well-being. The Others segment, encompassing niche applications like sports academies and specialized training centers, also contributes significantly, showcasing the versatility of these software solutions.
Recreation Management Software Product Developments
Recent product developments in Recreation Management Software are heavily influenced by AI integration for personalized user recommendations and predictive analytics, enhancing operational efficiency. The focus is on creating intuitive, mobile-first interfaces that offer seamless venue management, robust registration and membership functionalities, and integrated ticketing and event management. Competitive advantages are derived from advanced reporting capabilities, secure payment processing, and customizable modules catering to diverse industry needs, from community parks to healthcare and wellness centers.
Key Drivers of Recreation Management Software Growth
The Recreation Management Software market's growth is primarily propelled by the accelerating digital transformation across all sectors, pushing organizations towards more efficient and integrated operational solutions. Technological advancements, particularly in cloud computing and AI, enable enhanced functionality and user experience, driving adoption. The increasing global emphasis on health and wellness initiatives further fuels demand, as these sectors require sophisticated tools for managing programs and memberships. Regulatory support for digital public services also plays a crucial role in expanding the market.
Challenges in the Recreation Management Software Market
Despite robust growth, the Recreation Management Software market faces several challenges. High initial implementation costs can be a barrier for smaller organizations, impacting market penetration. Data security and privacy concerns, particularly with the increasing volume of sensitive user information handled, necessitate robust compliance measures. Integration complexities with existing legacy systems can also pose significant hurdles. Furthermore, the competitive landscape, with numerous players offering similar functionalities, can lead to price pressures and the need for continuous innovation to maintain market share, impacting profitability by an estimated xx% in certain segments.
Emerging Opportunities in Recreation Management Software
Emerging opportunities in the Recreation Management Software market lie in the expansion of AI-driven personalized member experiences, offering tailored program suggestions and fitness plans. Strategic partnerships between software providers and wearable technology companies present avenues for enhanced health and wellness tracking. The growing demand for integrated facility management solutions, encompassing smart building technologies, also offers significant growth potential. Furthermore, expanding into underserved geographical markets and developing specialized modules for niche recreational activities represent key expansion strategies.
Leading Players in the Recreation Management Software Sector
- PerfectMind
- EZFacility
- Yardi System
- Active Network
- Civicplus
- Legend Recreation Software
- Jarvis Corporation
- Daxko
- RecDesk
- MyRec
- Dash Platform
- Vermont Systems
- InnoSoft Fusion
Key Milestones in Recreation Management Software Industry
- 2019: Increased adoption of cloud-based solutions driving scalability and accessibility.
- 2020: Surge in demand for contactless registration and payment features due to global health events.
- 2021: Introduction of AI-powered analytics for predictive maintenance and member engagement.
- 2022: Significant M&A activity as larger players acquire specialized niche providers.
- 2023: Enhanced mobile app functionalities and integration with wearable devices becoming standard.
- 2024: Focus on data visualization and advanced reporting dashboards for better decision-making.
- 2025: Expected widespread adoption of integrated smart facility management features.
- 2026: Anticipated advancements in personalized user experience through machine learning.
- 2027-2033: Continued evolution with deeper AI integration, augmented reality applications, and enhanced cybersecurity measures.
Strategic Outlook for Recreation Management Software Market
The strategic outlook for the Recreation Management Software market is exceptionally positive, driven by the continuous digital evolution of the recreation sector. Growth accelerators include the ongoing push for operational efficiency, the increasing demand for personalized patron experiences, and the integration of emerging technologies like AI and IoT. Strategic opportunities lie in targeting underpenetrated markets, developing specialized solutions for emerging recreational trends, and fostering robust partnerships to enhance service offerings. The market is poised for sustained innovation and expansion, promising significant value creation for stakeholders.
Recreation Management Software Segmentation
-
1. Application
- 1.1. Community Parks
- 1.2. Recreation Departments
- 1.3. Healthcare & Wellness
- 1.4. Education & Academics
- 1.5. Sports Training Center
- 1.6. Others
-
2. Type
- 2.1. Venue Management
- 2.2. Registrations & Membership Management
- 2.3. Ticketing and Event Management
- 2.4. Others
Recreation Management Software Segmentation By Geography
-
1. North America
- 1.1. United States
- 1.2. Canada
- 1.3. Mexico
-
2. South America
- 2.1. Brazil
- 2.2. Argentina
- 2.3. Rest of South America
-
3. Europe
- 3.1. United Kingdom
- 3.2. Germany
- 3.3. France
- 3.4. Italy
- 3.5. Spain
- 3.6. Russia
- 3.7. Benelux
- 3.8. Nordics
- 3.9. Rest of Europe
-
4. Middle East & Africa
- 4.1. Turkey
- 4.2. Israel
- 4.3. GCC
- 4.4. North Africa
- 4.5. South Africa
- 4.6. Rest of Middle East & Africa
-
5. Asia Pacific
- 5.1. China
- 5.2. India
- 5.3. Japan
- 5.4. South Korea
- 5.5. ASEAN
- 5.6. Oceania
- 5.7. Rest of Asia Pacific
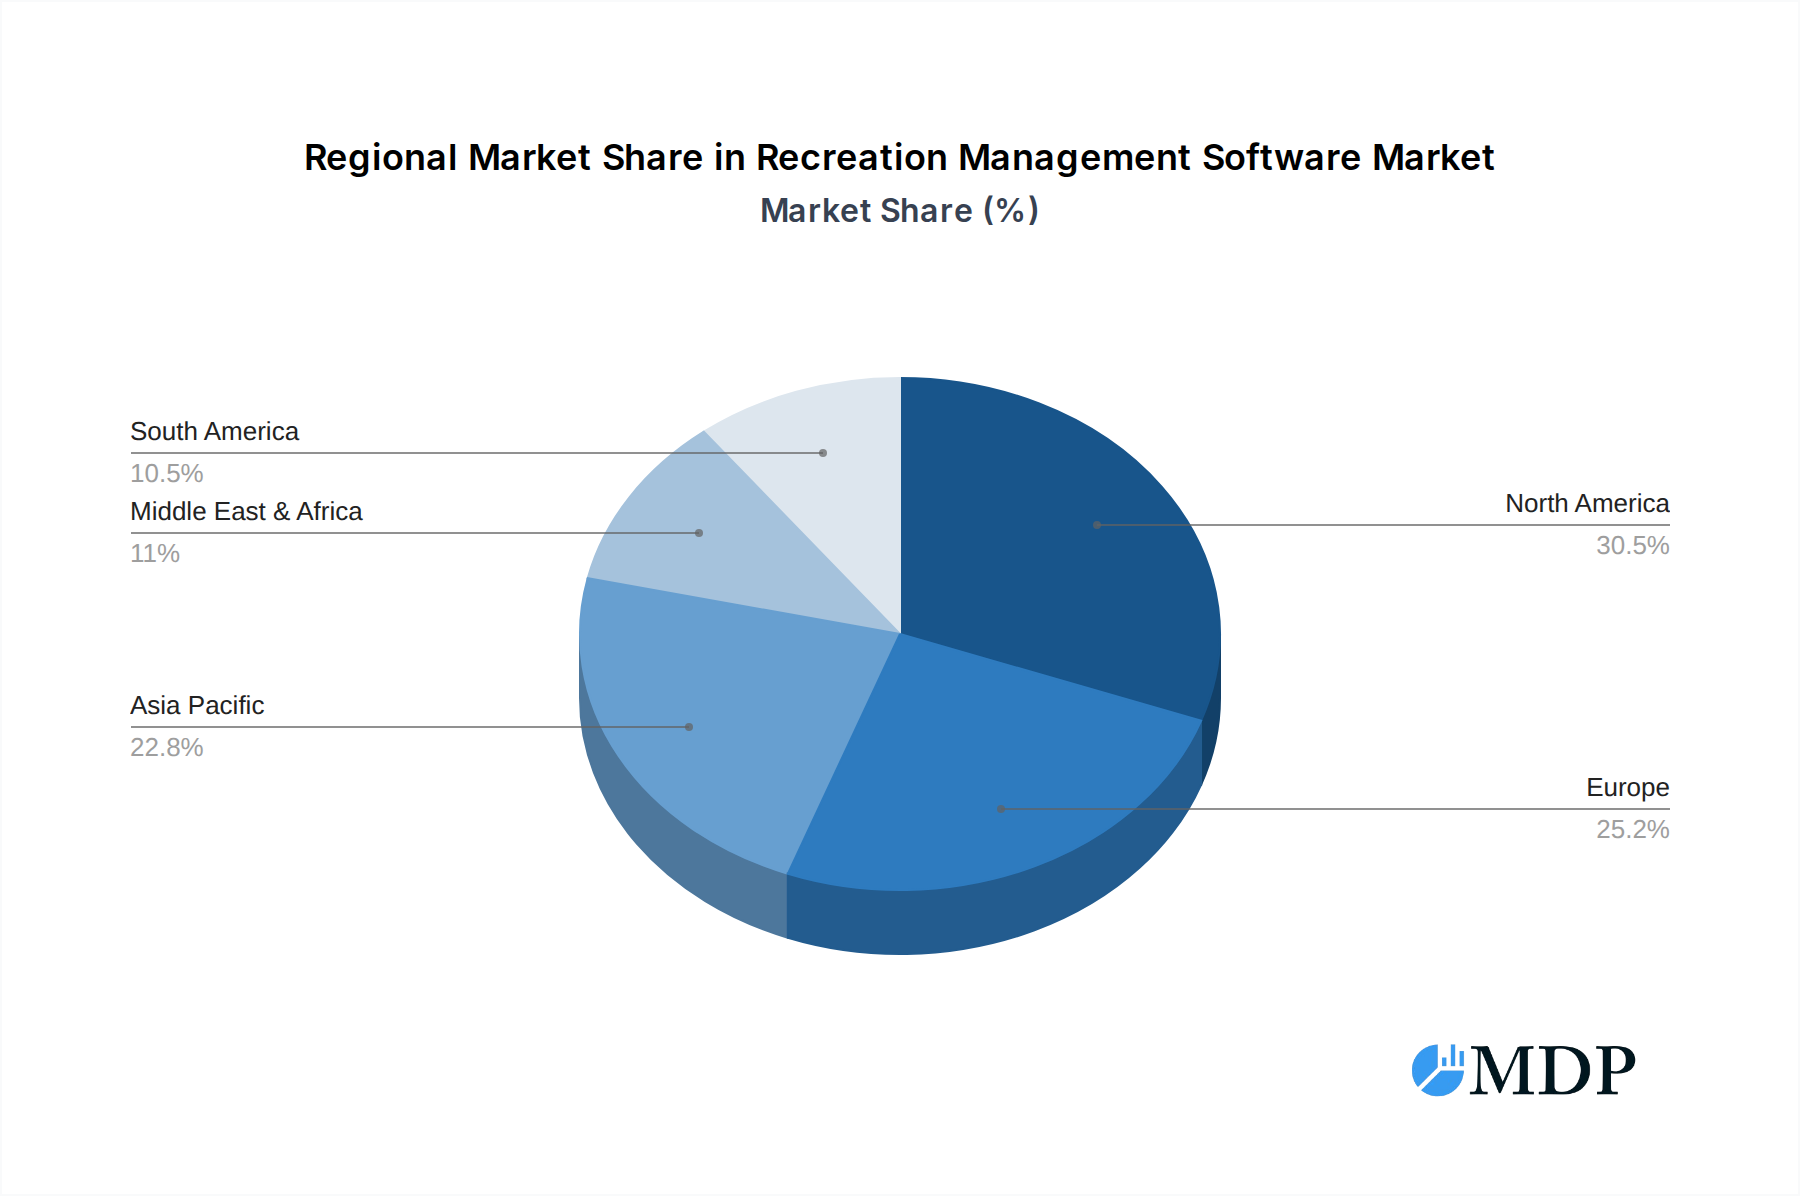
Recreation Management Software Regional Market Share
Geographic Coverage of Recreation Management Software
Recreation Management Software REPORT HIGHLIGHTS
| Aspects | Details |
|---|---|
| Study Period | 2020-2034 |
| Base Year | 2025 |
| Estimated Year | 2026 |
| Forecast Period | 2026-2034 |
| Historical Period | 2020-2025 |
| Growth Rate | CAGR of 10.91% from 2020-2034 |
| Segmentation |
|
Table of Contents
- 1. Introduction
- 1.1. Research Scope
- 1.2. Market Segmentation
- 1.3. Research Methodology
- 1.4. Definitions and Assumptions
- 2. Executive Summary
- 2.1. Introduction
- 3. Market Dynamics
- 3.1. Introduction
- 3.2. Market Drivers
- 3.3. Market Restrains
- 3.4. Market Trends
- 4. Market Factor Analysis
- 4.1. Porters Five Forces
- 4.2. Supply/Value Chain
- 4.3. PESTEL analysis
- 4.4. Market Entropy
- 4.5. Patent/Trademark Analysis
- 5. Global Recreation Management Software Analysis, Insights and Forecast, 2020-2032
- 5.1. Market Analysis, Insights and Forecast - by Application
- 5.1.1. Community Parks
- 5.1.2. Recreation Departments
- 5.1.3. Healthcare & Wellness
- 5.1.4. Education & Academics
- 5.1.5. Sports Training Center
- 5.1.6. Others
- 5.2. Market Analysis, Insights and Forecast - by Type
- 5.2.1. Venue Management
- 5.2.2. Registrations & Membership Management
- 5.2.3. Ticketing and Event Management
- 5.2.4. Others
- 5.3. Market Analysis, Insights and Forecast - by Region
- 5.3.1. North America
- 5.3.2. South America
- 5.3.3. Europe
- 5.3.4. Middle East & Africa
- 5.3.5. Asia Pacific
- 5.1. Market Analysis, Insights and Forecast - by Application
- 6. North America Recreation Management Software Analysis, Insights and Forecast, 2020-2032
- 6.1. Market Analysis, Insights and Forecast - by Application
- 6.1.1. Community Parks
- 6.1.2. Recreation Departments
- 6.1.3. Healthcare & Wellness
- 6.1.4. Education & Academics
- 6.1.5. Sports Training Center
- 6.1.6. Others
- 6.2. Market Analysis, Insights and Forecast - by Type
- 6.2.1. Venue Management
- 6.2.2. Registrations & Membership Management
- 6.2.3. Ticketing and Event Management
- 6.2.4. Others
- 6.1. Market Analysis, Insights and Forecast - by Application
- 7. South America Recreation Management Software Analysis, Insights and Forecast, 2020-2032
- 7.1. Market Analysis, Insights and Forecast - by Application
- 7.1.1. Community Parks
- 7.1.2. Recreation Departments
- 7.1.3. Healthcare & Wellness
- 7.1.4. Education & Academics
- 7.1.5. Sports Training Center
- 7.1.6. Others
- 7.2. Market Analysis, Insights and Forecast - by Type
- 7.2.1. Venue Management
- 7.2.2. Registrations & Membership Management
- 7.2.3. Ticketing and Event Management
- 7.2.4. Others
- 7.1. Market Analysis, Insights and Forecast - by Application
- 8. Europe Recreation Management Software Analysis, Insights and Forecast, 2020-2032
- 8.1. Market Analysis, Insights and Forecast - by Application
- 8.1.1. Community Parks
- 8.1.2. Recreation Departments
- 8.1.3. Healthcare & Wellness
- 8.1.4. Education & Academics
- 8.1.5. Sports Training Center
- 8.1.6. Others
- 8.2. Market Analysis, Insights and Forecast - by Type
- 8.2.1. Venue Management
- 8.2.2. Registrations & Membership Management
- 8.2.3. Ticketing and Event Management
- 8.2.4. Others
- 8.1. Market Analysis, Insights and Forecast - by Application
- 9. Middle East & Africa Recreation Management Software Analysis, Insights and Forecast, 2020-2032
- 9.1. Market Analysis, Insights and Forecast - by Application
- 9.1.1. Community Parks
- 9.1.2. Recreation Departments
- 9.1.3. Healthcare & Wellness
- 9.1.4. Education & Academics
- 9.1.5. Sports Training Center
- 9.1.6. Others
- 9.2. Market Analysis, Insights and Forecast - by Type
- 9.2.1. Venue Management
- 9.2.2. Registrations & Membership Management
- 9.2.3. Ticketing and Event Management
- 9.2.4. Others
- 9.1. Market Analysis, Insights and Forecast - by Application
- 10. Asia Pacific Recreation Management Software Analysis, Insights and Forecast, 2020-2032
- 10.1. Market Analysis, Insights and Forecast - by Application
- 10.1.1. Community Parks
- 10.1.2. Recreation Departments
- 10.1.3. Healthcare & Wellness
- 10.1.4. Education & Academics
- 10.1.5. Sports Training Center
- 10.1.6. Others
- 10.2. Market Analysis, Insights and Forecast - by Type
- 10.2.1. Venue Management
- 10.2.2. Registrations & Membership Management
- 10.2.3. Ticketing and Event Management
- 10.2.4. Others
- 10.1. Market Analysis, Insights and Forecast - by Application
- 11. Competitive Analysis
- 11.1. Global Market Share Analysis 2025
- 11.2. Company Profiles
- 11.2.1 PerfectMind
- 11.2.1.1. Overview
- 11.2.1.2. Products
- 11.2.1.3. SWOT Analysis
- 11.2.1.4. Recent Developments
- 11.2.1.5. Financials (Based on Availability)
- 11.2.2 EZFacility
- 11.2.2.1. Overview
- 11.2.2.2. Products
- 11.2.2.3. SWOT Analysis
- 11.2.2.4. Recent Developments
- 11.2.2.5. Financials (Based on Availability)
- 11.2.3 Yardi System
- 11.2.3.1. Overview
- 11.2.3.2. Products
- 11.2.3.3. SWOT Analysis
- 11.2.3.4. Recent Developments
- 11.2.3.5. Financials (Based on Availability)
- 11.2.4 Active Network
- 11.2.4.1. Overview
- 11.2.4.2. Products
- 11.2.4.3. SWOT Analysis
- 11.2.4.4. Recent Developments
- 11.2.4.5. Financials (Based on Availability)
- 11.2.5 Civicplus
- 11.2.5.1. Overview
- 11.2.5.2. Products
- 11.2.5.3. SWOT Analysis
- 11.2.5.4. Recent Developments
- 11.2.5.5. Financials (Based on Availability)
- 11.2.6 Legend Recreation Software
- 11.2.6.1. Overview
- 11.2.6.2. Products
- 11.2.6.3. SWOT Analysis
- 11.2.6.4. Recent Developments
- 11.2.6.5. Financials (Based on Availability)
- 11.2.7 Jarvis Corporation
- 11.2.7.1. Overview
- 11.2.7.2. Products
- 11.2.7.3. SWOT Analysis
- 11.2.7.4. Recent Developments
- 11.2.7.5. Financials (Based on Availability)
- 11.2.8 Daxko
- 11.2.8.1. Overview
- 11.2.8.2. Products
- 11.2.8.3. SWOT Analysis
- 11.2.8.4. Recent Developments
- 11.2.8.5. Financials (Based on Availability)
- 11.2.9 RecDesk
- 11.2.9.1. Overview
- 11.2.9.2. Products
- 11.2.9.3. SWOT Analysis
- 11.2.9.4. Recent Developments
- 11.2.9.5. Financials (Based on Availability)
- 11.2.10 MyRec
- 11.2.10.1. Overview
- 11.2.10.2. Products
- 11.2.10.3. SWOT Analysis
- 11.2.10.4. Recent Developments
- 11.2.10.5. Financials (Based on Availability)
- 11.2.11 Dash Platform
- 11.2.11.1. Overview
- 11.2.11.2. Products
- 11.2.11.3. SWOT Analysis
- 11.2.11.4. Recent Developments
- 11.2.11.5. Financials (Based on Availability)
- 11.2.12 Vermont Systems
- 11.2.12.1. Overview
- 11.2.12.2. Products
- 11.2.12.3. SWOT Analysis
- 11.2.12.4. Recent Developments
- 11.2.12.5. Financials (Based on Availability)
- 11.2.13 InnoSoft Fusion
- 11.2.13.1. Overview
- 11.2.13.2. Products
- 11.2.13.3. SWOT Analysis
- 11.2.13.4. Recent Developments
- 11.2.13.5. Financials (Based on Availability)
- 11.2.1 PerfectMind
List of Figures
- Figure 1: Global Recreation Management Software Revenue Breakdown (billion, %) by Region 2025 & 2033
- Figure 2: North America Recreation Management Software Revenue (billion), by Application 2025 & 2033
- Figure 3: North America Recreation Management Software Revenue Share (%), by Application 2025 & 2033
- Figure 4: North America Recreation Management Software Revenue (billion), by Type 2025 & 2033
- Figure 5: North America Recreation Management Software Revenue Share (%), by Type 2025 & 2033
- Figure 6: North America Recreation Management Software Revenue (billion), by Country 2025 & 2033
- Figure 7: North America Recreation Management Software Revenue Share (%), by Country 2025 & 2033
- Figure 8: South America Recreation Management Software Revenue (billion), by Application 2025 & 2033
- Figure 9: South America Recreation Management Software Revenue Share (%), by Application 2025 & 2033
- Figure 10: South America Recreation Management Software Revenue (billion), by Type 2025 & 2033
- Figure 11: South America Recreation Management Software Revenue Share (%), by Type 2025 & 2033
- Figure 12: South America Recreation Management Software Revenue (billion), by Country 2025 & 2033
- Figure 13: South America Recreation Management Software Revenue Share (%), by Country 2025 & 2033
- Figure 14: Europe Recreation Management Software Revenue (billion), by Application 2025 & 2033
- Figure 15: Europe Recreation Management Software Revenue Share (%), by Application 2025 & 2033
- Figure 16: Europe Recreation Management Software Revenue (billion), by Type 2025 & 2033
- Figure 17: Europe Recreation Management Software Revenue Share (%), by Type 2025 & 2033
- Figure 18: Europe Recreation Management Software Revenue (billion), by Country 2025 & 2033
- Figure 19: Europe Recreation Management Software Revenue Share (%), by Country 2025 & 2033
- Figure 20: Middle East & Africa Recreation Management Software Revenue (billion), by Application 2025 & 2033
- Figure 21: Middle East & Africa Recreation Management Software Revenue Share (%), by Application 2025 & 2033
- Figure 22: Middle East & Africa Recreation Management Software Revenue (billion), by Type 2025 & 2033
- Figure 23: Middle East & Africa Recreation Management Software Revenue Share (%), by Type 2025 & 2033
- Figure 24: Middle East & Africa Recreation Management Software Revenue (billion), by Country 2025 & 2033
- Figure 25: Middle East & Africa Recreation Management Software Revenue Share (%), by Country 2025 & 2033
- Figure 26: Asia Pacific Recreation Management Software Revenue (billion), by Application 2025 & 2033
- Figure 27: Asia Pacific Recreation Management Software Revenue Share (%), by Application 2025 & 2033
- Figure 28: Asia Pacific Recreation Management Software Revenue (billion), by Type 2025 & 2033
- Figure 29: Asia Pacific Recreation Management Software Revenue Share (%), by Type 2025 & 2033
- Figure 30: Asia Pacific Recreation Management Software Revenue (billion), by Country 2025 & 2033
- Figure 31: Asia Pacific Recreation Management Software Revenue Share (%), by Country 2025 & 2033
List of Tables
- Table 1: Global Recreation Management Software Revenue billion Forecast, by Application 2020 & 2033
- Table 2: Global Recreation Management Software Revenue billion Forecast, by Type 2020 & 2033
- Table 3: Global Recreation Management Software Revenue billion Forecast, by Region 2020 & 2033
- Table 4: Global Recreation Management Software Revenue billion Forecast, by Application 2020 & 2033
- Table 5: Global Recreation Management Software Revenue billion Forecast, by Type 2020 & 2033
- Table 6: Global Recreation Management Software Revenue billion Forecast, by Country 2020 & 2033
- Table 7: United States Recreation Management Software Revenue (billion) Forecast, by Application 2020 & 2033
- Table 8: Canada Recreation Management Software Revenue (billion) Forecast, by Application 2020 & 2033
- Table 9: Mexico Recreation Management Software Revenue (billion) Forecast, by Application 2020 & 2033
- Table 10: Global Recreation Management Software Revenue billion Forecast, by Application 2020 & 2033
- Table 11: Global Recreation Management Software Revenue billion Forecast, by Type 2020 & 2033
- Table 12: Global Recreation Management Software Revenue billion Forecast, by Country 2020 & 2033
- Table 13: Brazil Recreation Management Software Revenue (billion) Forecast, by Application 2020 & 2033
- Table 14: Argentina Recreation Management Software Revenue (billion) Forecast, by Application 2020 & 2033
- Table 15: Rest of South America Recreation Management Software Revenue (billion) Forecast, by Application 2020 & 2033
- Table 16: Global Recreation Management Software Revenue billion Forecast, by Application 2020 & 2033
- Table 17: Global Recreation Management Software Revenue billion Forecast, by Type 2020 & 2033
- Table 18: Global Recreation Management Software Revenue billion Forecast, by Country 2020 & 2033
- Table 19: United Kingdom Recreation Management Software Revenue (billion) Forecast, by Application 2020 & 2033
- Table 20: Germany Recreation Management Software Revenue (billion) Forecast, by Application 2020 & 2033
- Table 21: France Recreation Management Software Revenue (billion) Forecast, by Application 2020 & 2033
- Table 22: Italy Recreation Management Software Revenue (billion) Forecast, by Application 2020 & 2033
- Table 23: Spain Recreation Management Software Revenue (billion) Forecast, by Application 2020 & 2033
- Table 24: Russia Recreation Management Software Revenue (billion) Forecast, by Application 2020 & 2033
- Table 25: Benelux Recreation Management Software Revenue (billion) Forecast, by Application 2020 & 2033
- Table 26: Nordics Recreation Management Software Revenue (billion) Forecast, by Application 2020 & 2033
- Table 27: Rest of Europe Recreation Management Software Revenue (billion) Forecast, by Application 2020 & 2033
- Table 28: Global Recreation Management Software Revenue billion Forecast, by Application 2020 & 2033
- Table 29: Global Recreation Management Software Revenue billion Forecast, by Type 2020 & 2033
- Table 30: Global Recreation Management Software Revenue billion Forecast, by Country 2020 & 2033
- Table 31: Turkey Recreation Management Software Revenue (billion) Forecast, by Application 2020 & 2033
- Table 32: Israel Recreation Management Software Revenue (billion) Forecast, by Application 2020 & 2033
- Table 33: GCC Recreation Management Software Revenue (billion) Forecast, by Application 2020 & 2033
- Table 34: North Africa Recreation Management Software Revenue (billion) Forecast, by Application 2020 & 2033
- Table 35: South Africa Recreation Management Software Revenue (billion) Forecast, by Application 2020 & 2033
- Table 36: Rest of Middle East & Africa Recreation Management Software Revenue (billion) Forecast, by Application 2020 & 2033
- Table 37: Global Recreation Management Software Revenue billion Forecast, by Application 2020 & 2033
- Table 38: Global Recreation Management Software Revenue billion Forecast, by Type 2020 & 2033
- Table 39: Global Recreation Management Software Revenue billion Forecast, by Country 2020 & 2033
- Table 40: China Recreation Management Software Revenue (billion) Forecast, by Application 2020 & 2033
- Table 41: India Recreation Management Software Revenue (billion) Forecast, by Application 2020 & 2033
- Table 42: Japan Recreation Management Software Revenue (billion) Forecast, by Application 2020 & 2033
- Table 43: South Korea Recreation Management Software Revenue (billion) Forecast, by Application 2020 & 2033
- Table 44: ASEAN Recreation Management Software Revenue (billion) Forecast, by Application 2020 & 2033
- Table 45: Oceania Recreation Management Software Revenue (billion) Forecast, by Application 2020 & 2033
- Table 46: Rest of Asia Pacific Recreation Management Software Revenue (billion) Forecast, by Application 2020 & 2033
Frequently Asked Questions
1. What is the projected Compound Annual Growth Rate (CAGR) of the Recreation Management Software?
The projected CAGR is approximately 10.91%.
2. Which companies are prominent players in the Recreation Management Software?
Key companies in the market include PerfectMind, EZFacility, Yardi System, Active Network, Civicplus, Legend Recreation Software, Jarvis Corporation, Daxko, RecDesk, MyRec, Dash Platform, Vermont Systems, InnoSoft Fusion.
3. What are the main segments of the Recreation Management Software?
The market segments include Application, Type.
4. Can you provide details about the market size?
The market size is estimated to be USD 5.94 billion as of 2022.
5. What are some drivers contributing to market growth?
N/A
6. What are the notable trends driving market growth?
N/A
7. Are there any restraints impacting market growth?
N/A
8. Can you provide examples of recent developments in the market?
N/A
9. What pricing options are available for accessing the report?
Pricing options include single-user, multi-user, and enterprise licenses priced at USD 5900.00, USD 8850.00, and USD 11800.00 respectively.
10. Is the market size provided in terms of value or volume?
The market size is provided in terms of value, measured in billion.
11. Are there any specific market keywords associated with the report?
Yes, the market keyword associated with the report is "Recreation Management Software," which aids in identifying and referencing the specific market segment covered.
12. How do I determine which pricing option suits my needs best?
The pricing options vary based on user requirements and access needs. Individual users may opt for single-user licenses, while businesses requiring broader access may choose multi-user or enterprise licenses for cost-effective access to the report.
13. Are there any additional resources or data provided in the Recreation Management Software report?
While the report offers comprehensive insights, it's advisable to review the specific contents or supplementary materials provided to ascertain if additional resources or data are available.
14. How can I stay updated on further developments or reports in the Recreation Management Software?
To stay informed about further developments, trends, and reports in the Recreation Management Software, consider subscribing to industry newsletters, following relevant companies and organizations, or regularly checking reputable industry news sources and publications.
Methodology
Step 1 - Identification of Relevant Samples Size from Population Database


Step 2 - Approaches for Defining Global Market Size (Value, Volume* & Price*)

Note*: In applicable scenarios
Step 3 - Data Sources
Primary Research
- Web Analytics
- Survey Reports
- Research Institute
- Latest Research Reports
- Opinion Leaders
Secondary Research
- Annual Reports
- White Paper
- Latest Press Release
- Industry Association
- Paid Database
- Investor Presentations

Step 4 - Data Triangulation
Involves using different sources of information in order to increase the validity of a study
These sources are likely to be stakeholders in a program - participants, other researchers, program staff, other community members, and so on.
Then we put all data in single framework & apply various statistical tools to find out the dynamic on the market.
During the analysis stage, feedback from the stakeholder groups would be compared to determine areas of agreement as well as areas of divergence