

Key Insights
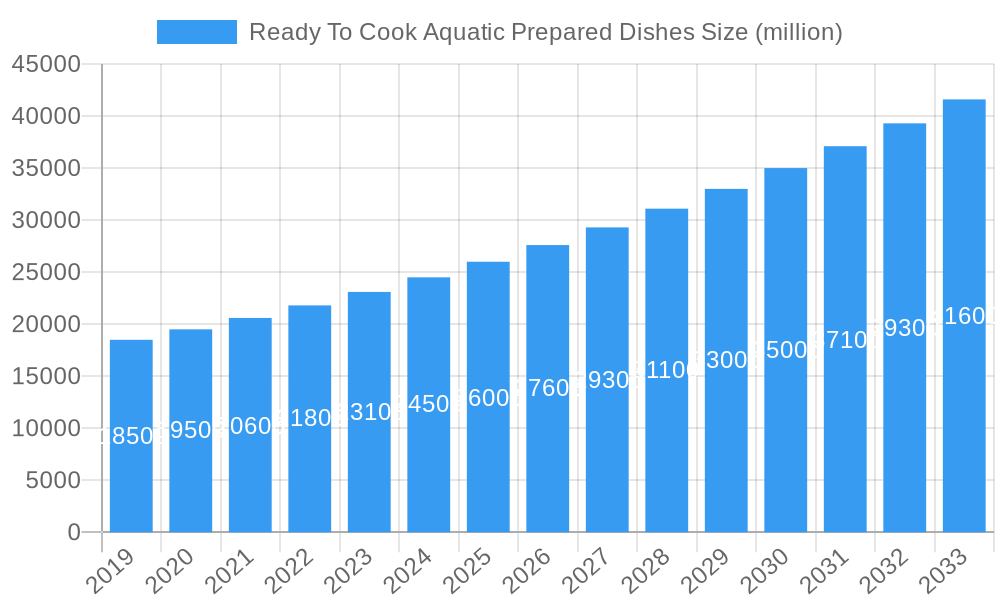
The Ready-to-Cook (RTC) Aquatic Prepared Dishes market is poised for substantial expansion, with a projected market size of $26,370 million. This robust growth is underpinned by a Compound Annual Growth Rate (CAGR) of 6.3%, indicating a dynamic and expanding sector driven by evolving consumer lifestyles and preferences. The primary impetus for this growth stems from the increasing demand for convenient, healthy, and ready-to-prepare meal solutions. Consumers, particularly in urbanized and dual-income households, are actively seeking time-saving alternatives to traditional cooking, without compromising on nutritional value or taste. The accessibility and variety offered by RTC aquatic dishes, encompassing a wide range of seafood like shrimp, fish, crab, and shellfish, cater to this demand effectively. The market is also benefiting from advancements in food processing technologies, leading to improved product quality, extended shelf life, and enhanced flavor profiles, making these dishes more appealing to a broader consumer base. Furthermore, the growing awareness of the health benefits associated with seafood consumption, such as high protein content and omega-3 fatty acids, further bolsters market demand.
Ready To Cook Aquatic Prepared Dishes Market Size (In Billion)
The market's expansion is significantly influenced by the shift towards online sales channels, which offer unparalleled convenience and a wider selection for consumers. This trend is complemented by the continued relevance of offline sales, particularly in traditional grocery stores and specialized seafood markets, which cater to consumers who prefer immediate purchase or require personalized assistance. Emerging trends such as the focus on sustainable sourcing, premiumization of RTC products, and the introduction of international cuisines are expected to shape the market landscape. However, the industry faces certain restraints, including fluctuating raw material prices, particularly for popular seafood varieties, and potential supply chain disruptions. Stringent food safety regulations and the need for advanced cold chain logistics also present operational challenges. Nevertheless, the strong underlying consumer demand for convenient and healthy meal options, coupled with ongoing innovation by leading companies like Xianmeilai Food Co.,Ltd and Zhanjiang Guolian Aquatic Products Co.,Ltd., suggests a promising future for the RTC aquatic prepared dishes market.
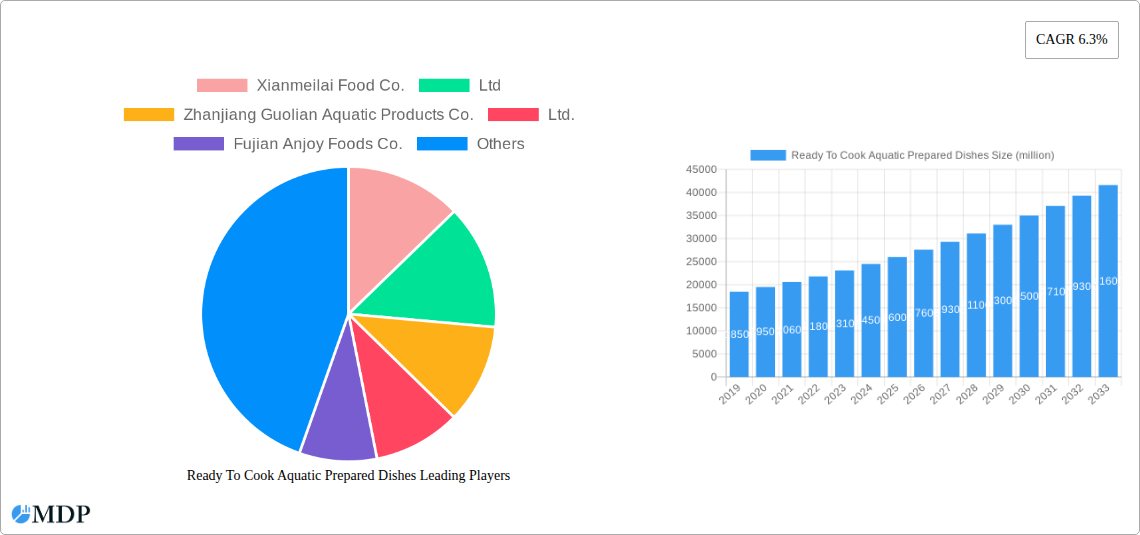
Ready To Cook Aquatic Prepared Dishes Company Market Share
This comprehensive report offers an in-depth analysis of the global Ready To Cook Aquatic Prepared Dishes market, a rapidly expanding segment driven by evolving consumer lifestyles and a demand for convenient, high-quality seafood solutions. Covering the study period from 2019 to 2033, with a base year of 2025, this research provides crucial insights into market dynamics, emerging trends, and key growth drivers. This report is designed for industry stakeholders, including manufacturers, distributors, investors, and policymakers, seeking to understand the competitive landscape, identify strategic opportunities, and navigate the complexities of this lucrative market. The forecast period of 2025–2033 details projected growth trajectories, while the historical period of 2019–2024 sets the foundation for understanding past market evolution.
Ready To Cook Aquatic Prepared Dishes Market Dynamics & Concentration
The Ready To Cook Aquatic Prepared Dishes market is characterized by moderate to high concentration, with a significant portion of market share held by a few leading players. Innovation drivers are primarily focused on enhancing product convenience, expanding flavor profiles, and improving shelf life through advanced processing and packaging technologies. Regulatory frameworks, particularly concerning food safety, labeling, and sustainability, play a crucial role in shaping market entry and operational standards. Product substitutes, such as fresh seafood, home-cooking ingredients, and other convenient meal solutions, present a constant competitive pressure, necessitating continuous product differentiation. End-user trends highlight a growing preference for healthy, protein-rich, and ready-to-eat meals, fueled by busy lifestyles and increased health consciousness. Mergers and Acquisitions (M&A) activities, with an estimated XX deal counts, are strategic initiatives employed by key companies to consolidate market presence, acquire new technologies, and expand their product portfolios. The market share of the top five players is estimated at over 60 million.
- Innovation Drivers: Novel flavor combinations, sustainable sourcing initiatives, advanced preservation techniques.
- Regulatory Frameworks: Stringent food safety standards (e.g., HACCP, ISO), clear allergen labeling, traceability mandates.
- Product Substitutes: Fresh seafood, frozen seafood, meal kits, other ready-to-eat meals.
- End-User Trends: Demand for convenience, health-conscious eating, premiumization of seafood.
- M&A Activities: Focus on market consolidation, technology acquisition, and geographical expansion.
Ready To Cook Aquatic Prepared Dishes Industry Trends & Analysis
The Ready To Cook Aquatic Prepared Dishes industry is poised for substantial growth, driven by a confluence of factors. The increasing demand for convenience among busy consumers, coupled with a rising global population and an expanding middle class, underpins the market's upward trajectory. Technological advancements in food processing, such as flash freezing, retort packaging, and sophisticated chilling systems, are instrumental in preserving the freshness, taste, and nutritional value of aquatic prepared dishes, thereby extending their shelf life and broadening their appeal. These innovations are critical in overcoming the inherent perishability of seafood. Consumer preferences are increasingly leaning towards healthier eating habits, and aquatic prepared dishes, being rich in protein and essential omega-3 fatty acids, align perfectly with these dietary aspirations. The rising awareness about the health benefits of seafood consumption further amplifies this trend. Furthermore, the proliferation of online sales channels, including e-commerce platforms and direct-to-consumer (DTC) models, has significantly broadened market accessibility, allowing consumers to purchase a wide array of prepared seafood dishes with ease and convenience. This digital shift is revolutionizing how consumers interact with food products. The competitive landscape is intensifying, with both established food manufacturers and agile startups vying for market dominance. Companies are investing heavily in product development, marketing campaigns, and supply chain optimization to gain a competitive edge. The Compound Annual Growth Rate (CAGR) for the forecast period is projected to be approximately 8.5 million, with market penetration expected to reach over 50 million households globally. The market size is estimated to reach over 150 million by 2033.
Leading Markets & Segments in Ready To Cook Aquatic Prepared Dishes
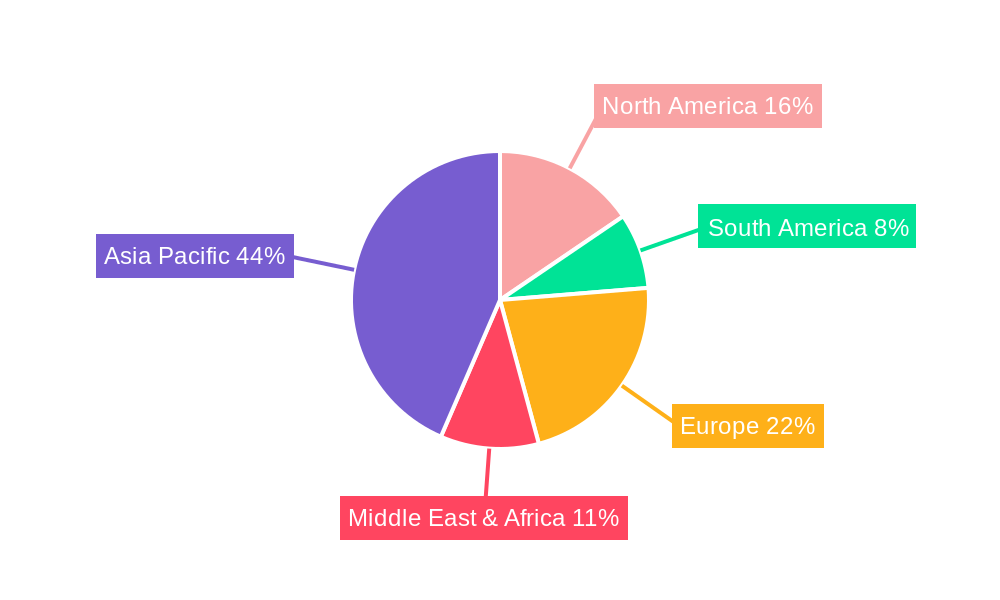
The global Ready To Cook Aquatic Prepared Dishes market exhibits significant regional and segment-specific dominance. Asia Pacific currently stands as the leading region, driven by its large population, increasing disposable incomes, and a deeply ingrained cultural appreciation for seafood. Countries like China, Japan, and South Korea are at the forefront of this growth, with established seafood consumption patterns and a rapidly developing ready-to-eat food culture. In terms of application, Online Sales are experiencing a meteoric rise, projected to capture a market share exceeding 65 million by 2033. This surge is propelled by the convenience of e-commerce, the wider product selection available online, and efficient last-mile delivery networks. However, Offline Sales, encompassing supermarkets, hypermarkets, and specialty food stores, continue to hold substantial ground, particularly in regions with less developed online infrastructure or for consumers who prefer in-person shopping experiences.
Within product types, Fish and Shrimp segments are the dominant forces, owing to their widespread availability, versatility in culinary applications, and established consumer familiarity. The demand for convenient fish preparations, such as pre-marinated fillets and ready-to-cook fish curries, is particularly strong. Similarly, shrimp's popularity spans various cuisines, and its incorporation into ready-to-cook formats, like shrimp scampi and shrimp stir-fries, drives significant market volume, estimated at over 40 million for each segment. The Shellfish segment, while smaller, is also witnessing robust growth, driven by premiumization trends and the availability of convenient shellfish dishes like pre-cooked mussels and ready-to-grill oysters. The "Others" segment, encompassing a diverse range of aquatic ingredients and prepared meals, is expected to show promising growth as innovation continues to broaden the product offerings.
- Dominant Region: Asia Pacific (driven by China, Japan, South Korea).
- Leading Application: Online Sales (projected to exceed 65 million by 2033).
- Key Segments (Type): Fish (over 40 million), Shrimp (over 40 million).
- Drivers for Online Sales: E-commerce penetration, convenience, wider selection, efficient delivery.
- Drivers for Offline Sales: Traditional retail presence, consumer preference for in-person shopping, regional infrastructure.
- Drivers for Fish & Shrimp Dominance: Widespread availability, culinary versatility, consumer familiarity.
- Emerging Segment: Shellfish (driven by premiumization and convenience).
Ready To Cook Aquatic Prepared Dishes Product Developments
Product innovation in the Ready To Cook Aquatic Prepared Dishes market centers on enhancing convenience, flavor diversity, and nutritional value. Manufacturers are focusing on developing ready-to-cook meals that require minimal preparation time, often just heating. This includes pre-marinated seafood portions, seasoned fish fillets, and complete meal kits featuring aquatic protein. Advanced packaging solutions are also crucial, extending shelf life while maintaining product quality and safety. Furthermore, the development of globally inspired flavor profiles and fusion cuisines is a key trend, catering to diverse consumer palates. Competitive advantages are being gained through unique selling propositions such as sustainably sourced ingredients, organic certifications, and the incorporation of functional ingredients for added health benefits. The market is witnessing a rise in plant-based aquatic alternatives and dishes catering to specific dietary needs.
Key Drivers of Ready To Cook Aquatic Prepared Dishes Growth
The growth of the Ready To Cook Aquatic Prepared Dishes market is propelled by several key drivers. Technological advancements in food processing and preservation are enabling the creation of safer, tastier, and longer-lasting products. Economic factors, such as rising disposable incomes and a growing global middle class, are increasing consumer purchasing power for convenient and premium food options. Regulatory support for food safety standards and traceability enhances consumer trust and market access. The increasing urbanization leads to busier lifestyles, creating a higher demand for quick meal solutions. Furthermore, a growing health and wellness trend drives demand for protein-rich seafood options. The expansion of online retail infrastructure provides a more accessible platform for consumers to purchase these products.
Challenges in the Ready To Cook Aquatic Prepared Dishes Market
Despite its robust growth, the Ready To Cook Aquatic Prepared Dishes market faces several challenges. Perishability of seafood remains a significant concern, requiring sophisticated cold chain logistics to prevent spoilage and maintain product quality, impacting operational costs. Stringent food safety regulations and the need for continuous compliance can increase production expenses and necessitate ongoing investment in quality control measures, with potential fines for non-compliance reaching millions. Consumer perception regarding the freshness and quality of pre-prepared seafood can also be a hurdle, requiring effective marketing to build trust. Supply chain volatility, influenced by factors like climate change affecting fish stocks and geopolitical events, can lead to price fluctuations and availability issues. Intense competitive pressure from both domestic and international players necessitates constant innovation and cost management, with price wars potentially eroding profit margins.
Emerging Opportunities in Ready To Cook Aquatic Prepared Dishes
Emerging opportunities in the Ready To Cook Aquatic Prepared Dishes market are abundant, fueled by innovation and shifting consumer demands. Technological breakthroughs in areas like smart packaging and extended shelf-life solutions present significant growth catalysts. The development of plant-based aquatic alternatives caters to a growing vegetarian and vegan consumer base. Strategic partnerships between seafood suppliers, food manufacturers, and e-commerce platforms can unlock new distribution channels and expand market reach. Market expansion into emerging economies with growing middle classes and increasing disposable incomes offers substantial untapped potential. Furthermore, the demand for sustainable and ethically sourced seafood presents an opportunity for companies to differentiate themselves and build brand loyalty, with consumers willing to pay a premium for eco-conscious products.
Leading Players in the Ready To Cook Aquatic Prepared Dishes Sector
- Xianmeilai Food Co.,Ltd
- Zhanjiang Guolian Aquatic Products Co.,Ltd.
- Fujian Anjoy Foods Co.,Ltd
- CNFC Overseas Fisheries Co.,Ltd
- Joyvio Food Co.,Ltd
- Dahu Aquaculture Co.,Ltd
- Shandong Homey Aquatic Development Co.,Ltd
- Suzhou Weizhixiang Food Co.,Ltd
- Baiyang Investment Group,Inc
Key Milestones in Ready To Cook Aquatic Prepared Dishes Industry
- 2019: Increased consumer adoption of online grocery shopping, boosting the demand for convenient prepared meals.
- 2020: Global pandemic accelerates the trend towards home cooking and demand for convenient, ready-to-heat meals.
- 2021: Significant investment in cold chain logistics and e-commerce infrastructure to support the growing online food market.
- 2022: Introduction of innovative packaging technologies that extend shelf life and improve product freshness, impacting market reach.
- 2023: Growing consumer focus on health and sustainability leads to increased demand for responsibly sourced and nutritious aquatic prepared dishes.
- 2024: Expansion of product offerings to include a wider variety of global flavors and niche dietary options.
Strategic Outlook for Ready To Cook Aquatic Prepared Dishes Market
The strategic outlook for the Ready To Cook Aquatic Prepared Dishes market is overwhelmingly positive, characterized by sustained growth and expanding opportunities. The increasing demand for convenient, healthy, and diverse meal solutions, particularly among busy urban populations, will continue to be a primary growth accelerator. Companies that prioritize product innovation, focusing on novel flavors, advanced processing techniques, and sustainable sourcing, will be well-positioned to capture market share. Strategic partnerships and vertical integration within the supply chain will be crucial for ensuring quality control, cost efficiency, and market access. The continued expansion of e-commerce channels offers a significant avenue for reaching a broader consumer base globally. Investment in robust cold chain infrastructure and a commitment to food safety will be paramount in maintaining consumer trust and meeting regulatory requirements.
Ready To Cook Aquatic Prepared Dishes Segmentation
-
1. Application
- 1.1. Online Sales
- 1.2. Offline Sales
-
2. Type
- 2.1. Shrimp
- 2.2. Fish
- 2.3. Crab
- 2.4. Shellfish
- 2.5. Others
Ready To Cook Aquatic Prepared Dishes Segmentation By Geography
-
1. North America
- 1.1. United States
- 1.2. Canada
- 1.3. Mexico
-
2. South America
- 2.1. Brazil
- 2.2. Argentina
- 2.3. Rest of South America
-
3. Europe
- 3.1. United Kingdom
- 3.2. Germany
- 3.3. France
- 3.4. Italy
- 3.5. Spain
- 3.6. Russia
- 3.7. Benelux
- 3.8. Nordics
- 3.9. Rest of Europe
-
4. Middle East & Africa
- 4.1. Turkey
- 4.2. Israel
- 4.3. GCC
- 4.4. North Africa
- 4.5. South Africa
- 4.6. Rest of Middle East & Africa
-
5. Asia Pacific
- 5.1. China
- 5.2. India
- 5.3. Japan
- 5.4. South Korea
- 5.5. ASEAN
- 5.6. Oceania
- 5.7. Rest of Asia Pacific
Ready To Cook Aquatic Prepared Dishes Regional Market Share
Geographic Coverage of Ready To Cook Aquatic Prepared Dishes
Ready To Cook Aquatic Prepared Dishes REPORT HIGHLIGHTS
| Aspects | Details |
|---|---|
| Study Period | 2020-2034 |
| Base Year | 2025 |
| Estimated Year | 2026 |
| Forecast Period | 2026-2034 |
| Historical Period | 2020-2025 |
| Growth Rate | CAGR of 6.3% from 2020-2034 |
| Segmentation |
|
Table of Contents
- 1. Introduction
- 1.1. Research Scope
- 1.2. Market Segmentation
- 1.3. Research Methodology
- 1.4. Definitions and Assumptions
- 2. Executive Summary
- 2.1. Introduction
- 3. Market Dynamics
- 3.1. Introduction
- 3.2. Market Drivers
- 3.3. Market Restrains
- 3.4. Market Trends
- 4. Market Factor Analysis
- 4.1. Porters Five Forces
- 4.2. Supply/Value Chain
- 4.3. PESTEL analysis
- 4.4. Market Entropy
- 4.5. Patent/Trademark Analysis
- 5. Global Ready To Cook Aquatic Prepared Dishes Analysis, Insights and Forecast, 2020-2032
- 5.1. Market Analysis, Insights and Forecast - by Application
- 5.1.1. Online Sales
- 5.1.2. Offline Sales
- 5.2. Market Analysis, Insights and Forecast - by Type
- 5.2.1. Shrimp
- 5.2.2. Fish
- 5.2.3. Crab
- 5.2.4. Shellfish
- 5.2.5. Others
- 5.3. Market Analysis, Insights and Forecast - by Region
- 5.3.1. North America
- 5.3.2. South America
- 5.3.3. Europe
- 5.3.4. Middle East & Africa
- 5.3.5. Asia Pacific
- 5.1. Market Analysis, Insights and Forecast - by Application
- 6. North America Ready To Cook Aquatic Prepared Dishes Analysis, Insights and Forecast, 2020-2032
- 6.1. Market Analysis, Insights and Forecast - by Application
- 6.1.1. Online Sales
- 6.1.2. Offline Sales
- 6.2. Market Analysis, Insights and Forecast - by Type
- 6.2.1. Shrimp
- 6.2.2. Fish
- 6.2.3. Crab
- 6.2.4. Shellfish
- 6.2.5. Others
- 6.1. Market Analysis, Insights and Forecast - by Application
- 7. South America Ready To Cook Aquatic Prepared Dishes Analysis, Insights and Forecast, 2020-2032
- 7.1. Market Analysis, Insights and Forecast - by Application
- 7.1.1. Online Sales
- 7.1.2. Offline Sales
- 7.2. Market Analysis, Insights and Forecast - by Type
- 7.2.1. Shrimp
- 7.2.2. Fish
- 7.2.3. Crab
- 7.2.4. Shellfish
- 7.2.5. Others
- 7.1. Market Analysis, Insights and Forecast - by Application
- 8. Europe Ready To Cook Aquatic Prepared Dishes Analysis, Insights and Forecast, 2020-2032
- 8.1. Market Analysis, Insights and Forecast - by Application
- 8.1.1. Online Sales
- 8.1.2. Offline Sales
- 8.2. Market Analysis, Insights and Forecast - by Type
- 8.2.1. Shrimp
- 8.2.2. Fish
- 8.2.3. Crab
- 8.2.4. Shellfish
- 8.2.5. Others
- 8.1. Market Analysis, Insights and Forecast - by Application
- 9. Middle East & Africa Ready To Cook Aquatic Prepared Dishes Analysis, Insights and Forecast, 2020-2032
- 9.1. Market Analysis, Insights and Forecast - by Application
- 9.1.1. Online Sales
- 9.1.2. Offline Sales
- 9.2. Market Analysis, Insights and Forecast - by Type
- 9.2.1. Shrimp
- 9.2.2. Fish
- 9.2.3. Crab
- 9.2.4. Shellfish
- 9.2.5. Others
- 9.1. Market Analysis, Insights and Forecast - by Application
- 10. Asia Pacific Ready To Cook Aquatic Prepared Dishes Analysis, Insights and Forecast, 2020-2032
- 10.1. Market Analysis, Insights and Forecast - by Application
- 10.1.1. Online Sales
- 10.1.2. Offline Sales
- 10.2. Market Analysis, Insights and Forecast - by Type
- 10.2.1. Shrimp
- 10.2.2. Fish
- 10.2.3. Crab
- 10.2.4. Shellfish
- 10.2.5. Others
- 10.1. Market Analysis, Insights and Forecast - by Application
- 11. Competitive Analysis
- 11.1. Global Market Share Analysis 2025
- 11.2. Company Profiles
- 11.2.1 Xianmeilai Food Co.
- 11.2.1.1. Overview
- 11.2.1.2. Products
- 11.2.1.3. SWOT Analysis
- 11.2.1.4. Recent Developments
- 11.2.1.5. Financials (Based on Availability)
- 11.2.2 Ltd
- 11.2.2.1. Overview
- 11.2.2.2. Products
- 11.2.2.3. SWOT Analysis
- 11.2.2.4. Recent Developments
- 11.2.2.5. Financials (Based on Availability)
- 11.2.3 Zhanjiang Guolian Aquatic Products Co.
- 11.2.3.1. Overview
- 11.2.3.2. Products
- 11.2.3.3. SWOT Analysis
- 11.2.3.4. Recent Developments
- 11.2.3.5. Financials (Based on Availability)
- 11.2.4 Ltd.
- 11.2.4.1. Overview
- 11.2.4.2. Products
- 11.2.4.3. SWOT Analysis
- 11.2.4.4. Recent Developments
- 11.2.4.5. Financials (Based on Availability)
- 11.2.5 Fujian Anjoy Foods Co.
- 11.2.5.1. Overview
- 11.2.5.2. Products
- 11.2.5.3. SWOT Analysis
- 11.2.5.4. Recent Developments
- 11.2.5.5. Financials (Based on Availability)
- 11.2.6 Ltd
- 11.2.6.1. Overview
- 11.2.6.2. Products
- 11.2.6.3. SWOT Analysis
- 11.2.6.4. Recent Developments
- 11.2.6.5. Financials (Based on Availability)
- 11.2.7 CNFC Overseas Fisheries Co.
- 11.2.7.1. Overview
- 11.2.7.2. Products
- 11.2.7.3. SWOT Analysis
- 11.2.7.4. Recent Developments
- 11.2.7.5. Financials (Based on Availability)
- 11.2.8 Ltd
- 11.2.8.1. Overview
- 11.2.8.2. Products
- 11.2.8.3. SWOT Analysis
- 11.2.8.4. Recent Developments
- 11.2.8.5. Financials (Based on Availability)
- 11.2.9 Joyvio Food Co.
- 11.2.9.1. Overview
- 11.2.9.2. Products
- 11.2.9.3. SWOT Analysis
- 11.2.9.4. Recent Developments
- 11.2.9.5. Financials (Based on Availability)
- 11.2.10 Ltd
- 11.2.10.1. Overview
- 11.2.10.2. Products
- 11.2.10.3. SWOT Analysis
- 11.2.10.4. Recent Developments
- 11.2.10.5. Financials (Based on Availability)
- 11.2.11 Dahu Aquaculture Co.
- 11.2.11.1. Overview
- 11.2.11.2. Products
- 11.2.11.3. SWOT Analysis
- 11.2.11.4. Recent Developments
- 11.2.11.5. Financials (Based on Availability)
- 11.2.12 Ltd
- 11.2.12.1. Overview
- 11.2.12.2. Products
- 11.2.12.3. SWOT Analysis
- 11.2.12.4. Recent Developments
- 11.2.12.5. Financials (Based on Availability)
- 11.2.13 Shandong Homey Aquatic Development Co.
- 11.2.13.1. Overview
- 11.2.13.2. Products
- 11.2.13.3. SWOT Analysis
- 11.2.13.4. Recent Developments
- 11.2.13.5. Financials (Based on Availability)
- 11.2.14 Ltd
- 11.2.14.1. Overview
- 11.2.14.2. Products
- 11.2.14.3. SWOT Analysis
- 11.2.14.4. Recent Developments
- 11.2.14.5. Financials (Based on Availability)
- 11.2.15 Suzhou Weizhixiang Food Co.
- 11.2.15.1. Overview
- 11.2.15.2. Products
- 11.2.15.3. SWOT Analysis
- 11.2.15.4. Recent Developments
- 11.2.15.5. Financials (Based on Availability)
- 11.2.16 Ltd
- 11.2.16.1. Overview
- 11.2.16.2. Products
- 11.2.16.3. SWOT Analysis
- 11.2.16.4. Recent Developments
- 11.2.16.5. Financials (Based on Availability)
- 11.2.17 Baiyang Investment Group
- 11.2.17.1. Overview
- 11.2.17.2. Products
- 11.2.17.3. SWOT Analysis
- 11.2.17.4. Recent Developments
- 11.2.17.5. Financials (Based on Availability)
- 11.2.18 Inc
- 11.2.18.1. Overview
- 11.2.18.2. Products
- 11.2.18.3. SWOT Analysis
- 11.2.18.4. Recent Developments
- 11.2.18.5. Financials (Based on Availability)
- 11.2.1 Xianmeilai Food Co.
List of Figures
- Figure 1: Global Ready To Cook Aquatic Prepared Dishes Revenue Breakdown (million, %) by Region 2025 & 2033
- Figure 2: Global Ready To Cook Aquatic Prepared Dishes Volume Breakdown (K, %) by Region 2025 & 2033
- Figure 3: North America Ready To Cook Aquatic Prepared Dishes Revenue (million), by Application 2025 & 2033
- Figure 4: North America Ready To Cook Aquatic Prepared Dishes Volume (K), by Application 2025 & 2033
- Figure 5: North America Ready To Cook Aquatic Prepared Dishes Revenue Share (%), by Application 2025 & 2033
- Figure 6: North America Ready To Cook Aquatic Prepared Dishes Volume Share (%), by Application 2025 & 2033
- Figure 7: North America Ready To Cook Aquatic Prepared Dishes Revenue (million), by Type 2025 & 2033
- Figure 8: North America Ready To Cook Aquatic Prepared Dishes Volume (K), by Type 2025 & 2033
- Figure 9: North America Ready To Cook Aquatic Prepared Dishes Revenue Share (%), by Type 2025 & 2033
- Figure 10: North America Ready To Cook Aquatic Prepared Dishes Volume Share (%), by Type 2025 & 2033
- Figure 11: North America Ready To Cook Aquatic Prepared Dishes Revenue (million), by Country 2025 & 2033
- Figure 12: North America Ready To Cook Aquatic Prepared Dishes Volume (K), by Country 2025 & 2033
- Figure 13: North America Ready To Cook Aquatic Prepared Dishes Revenue Share (%), by Country 2025 & 2033
- Figure 14: North America Ready To Cook Aquatic Prepared Dishes Volume Share (%), by Country 2025 & 2033
- Figure 15: South America Ready To Cook Aquatic Prepared Dishes Revenue (million), by Application 2025 & 2033
- Figure 16: South America Ready To Cook Aquatic Prepared Dishes Volume (K), by Application 2025 & 2033
- Figure 17: South America Ready To Cook Aquatic Prepared Dishes Revenue Share (%), by Application 2025 & 2033
- Figure 18: South America Ready To Cook Aquatic Prepared Dishes Volume Share (%), by Application 2025 & 2033
- Figure 19: South America Ready To Cook Aquatic Prepared Dishes Revenue (million), by Type 2025 & 2033
- Figure 20: South America Ready To Cook Aquatic Prepared Dishes Volume (K), by Type 2025 & 2033
- Figure 21: South America Ready To Cook Aquatic Prepared Dishes Revenue Share (%), by Type 2025 & 2033
- Figure 22: South America Ready To Cook Aquatic Prepared Dishes Volume Share (%), by Type 2025 & 2033
- Figure 23: South America Ready To Cook Aquatic Prepared Dishes Revenue (million), by Country 2025 & 2033
- Figure 24: South America Ready To Cook Aquatic Prepared Dishes Volume (K), by Country 2025 & 2033
- Figure 25: South America Ready To Cook Aquatic Prepared Dishes Revenue Share (%), by Country 2025 & 2033
- Figure 26: South America Ready To Cook Aquatic Prepared Dishes Volume Share (%), by Country 2025 & 2033
- Figure 27: Europe Ready To Cook Aquatic Prepared Dishes Revenue (million), by Application 2025 & 2033
- Figure 28: Europe Ready To Cook Aquatic Prepared Dishes Volume (K), by Application 2025 & 2033
- Figure 29: Europe Ready To Cook Aquatic Prepared Dishes Revenue Share (%), by Application 2025 & 2033
- Figure 30: Europe Ready To Cook Aquatic Prepared Dishes Volume Share (%), by Application 2025 & 2033
- Figure 31: Europe Ready To Cook Aquatic Prepared Dishes Revenue (million), by Type 2025 & 2033
- Figure 32: Europe Ready To Cook Aquatic Prepared Dishes Volume (K), by Type 2025 & 2033
- Figure 33: Europe Ready To Cook Aquatic Prepared Dishes Revenue Share (%), by Type 2025 & 2033
- Figure 34: Europe Ready To Cook Aquatic Prepared Dishes Volume Share (%), by Type 2025 & 2033
- Figure 35: Europe Ready To Cook Aquatic Prepared Dishes Revenue (million), by Country 2025 & 2033
- Figure 36: Europe Ready To Cook Aquatic Prepared Dishes Volume (K), by Country 2025 & 2033
- Figure 37: Europe Ready To Cook Aquatic Prepared Dishes Revenue Share (%), by Country 2025 & 2033
- Figure 38: Europe Ready To Cook Aquatic Prepared Dishes Volume Share (%), by Country 2025 & 2033
- Figure 39: Middle East & Africa Ready To Cook Aquatic Prepared Dishes Revenue (million), by Application 2025 & 2033
- Figure 40: Middle East & Africa Ready To Cook Aquatic Prepared Dishes Volume (K), by Application 2025 & 2033
- Figure 41: Middle East & Africa Ready To Cook Aquatic Prepared Dishes Revenue Share (%), by Application 2025 & 2033
- Figure 42: Middle East & Africa Ready To Cook Aquatic Prepared Dishes Volume Share (%), by Application 2025 & 2033
- Figure 43: Middle East & Africa Ready To Cook Aquatic Prepared Dishes Revenue (million), by Type 2025 & 2033
- Figure 44: Middle East & Africa Ready To Cook Aquatic Prepared Dishes Volume (K), by Type 2025 & 2033
- Figure 45: Middle East & Africa Ready To Cook Aquatic Prepared Dishes Revenue Share (%), by Type 2025 & 2033
- Figure 46: Middle East & Africa Ready To Cook Aquatic Prepared Dishes Volume Share (%), by Type 2025 & 2033
- Figure 47: Middle East & Africa Ready To Cook Aquatic Prepared Dishes Revenue (million), by Country 2025 & 2033
- Figure 48: Middle East & Africa Ready To Cook Aquatic Prepared Dishes Volume (K), by Country 2025 & 2033
- Figure 49: Middle East & Africa Ready To Cook Aquatic Prepared Dishes Revenue Share (%), by Country 2025 & 2033
- Figure 50: Middle East & Africa Ready To Cook Aquatic Prepared Dishes Volume Share (%), by Country 2025 & 2033
- Figure 51: Asia Pacific Ready To Cook Aquatic Prepared Dishes Revenue (million), by Application 2025 & 2033
- Figure 52: Asia Pacific Ready To Cook Aquatic Prepared Dishes Volume (K), by Application 2025 & 2033
- Figure 53: Asia Pacific Ready To Cook Aquatic Prepared Dishes Revenue Share (%), by Application 2025 & 2033
- Figure 54: Asia Pacific Ready To Cook Aquatic Prepared Dishes Volume Share (%), by Application 2025 & 2033
- Figure 55: Asia Pacific Ready To Cook Aquatic Prepared Dishes Revenue (million), by Type 2025 & 2033
- Figure 56: Asia Pacific Ready To Cook Aquatic Prepared Dishes Volume (K), by Type 2025 & 2033
- Figure 57: Asia Pacific Ready To Cook Aquatic Prepared Dishes Revenue Share (%), by Type 2025 & 2033
- Figure 58: Asia Pacific Ready To Cook Aquatic Prepared Dishes Volume Share (%), by Type 2025 & 2033
- Figure 59: Asia Pacific Ready To Cook Aquatic Prepared Dishes Revenue (million), by Country 2025 & 2033
- Figure 60: Asia Pacific Ready To Cook Aquatic Prepared Dishes Volume (K), by Country 2025 & 2033
- Figure 61: Asia Pacific Ready To Cook Aquatic Prepared Dishes Revenue Share (%), by Country 2025 & 2033
- Figure 62: Asia Pacific Ready To Cook Aquatic Prepared Dishes Volume Share (%), by Country 2025 & 2033
List of Tables
- Table 1: Global Ready To Cook Aquatic Prepared Dishes Revenue million Forecast, by Application 2020 & 2033
- Table 2: Global Ready To Cook Aquatic Prepared Dishes Volume K Forecast, by Application 2020 & 2033
- Table 3: Global Ready To Cook Aquatic Prepared Dishes Revenue million Forecast, by Type 2020 & 2033
- Table 4: Global Ready To Cook Aquatic Prepared Dishes Volume K Forecast, by Type 2020 & 2033
- Table 5: Global Ready To Cook Aquatic Prepared Dishes Revenue million Forecast, by Region 2020 & 2033
- Table 6: Global Ready To Cook Aquatic Prepared Dishes Volume K Forecast, by Region 2020 & 2033
- Table 7: Global Ready To Cook Aquatic Prepared Dishes Revenue million Forecast, by Application 2020 & 2033
- Table 8: Global Ready To Cook Aquatic Prepared Dishes Volume K Forecast, by Application 2020 & 2033
- Table 9: Global Ready To Cook Aquatic Prepared Dishes Revenue million Forecast, by Type 2020 & 2033
- Table 10: Global Ready To Cook Aquatic Prepared Dishes Volume K Forecast, by Type 2020 & 2033
- Table 11: Global Ready To Cook Aquatic Prepared Dishes Revenue million Forecast, by Country 2020 & 2033
- Table 12: Global Ready To Cook Aquatic Prepared Dishes Volume K Forecast, by Country 2020 & 2033
- Table 13: United States Ready To Cook Aquatic Prepared Dishes Revenue (million) Forecast, by Application 2020 & 2033
- Table 14: United States Ready To Cook Aquatic Prepared Dishes Volume (K) Forecast, by Application 2020 & 2033
- Table 15: Canada Ready To Cook Aquatic Prepared Dishes Revenue (million) Forecast, by Application 2020 & 2033
- Table 16: Canada Ready To Cook Aquatic Prepared Dishes Volume (K) Forecast, by Application 2020 & 2033
- Table 17: Mexico Ready To Cook Aquatic Prepared Dishes Revenue (million) Forecast, by Application 2020 & 2033
- Table 18: Mexico Ready To Cook Aquatic Prepared Dishes Volume (K) Forecast, by Application 2020 & 2033
- Table 19: Global Ready To Cook Aquatic Prepared Dishes Revenue million Forecast, by Application 2020 & 2033
- Table 20: Global Ready To Cook Aquatic Prepared Dishes Volume K Forecast, by Application 2020 & 2033
- Table 21: Global Ready To Cook Aquatic Prepared Dishes Revenue million Forecast, by Type 2020 & 2033
- Table 22: Global Ready To Cook Aquatic Prepared Dishes Volume K Forecast, by Type 2020 & 2033
- Table 23: Global Ready To Cook Aquatic Prepared Dishes Revenue million Forecast, by Country 2020 & 2033
- Table 24: Global Ready To Cook Aquatic Prepared Dishes Volume K Forecast, by Country 2020 & 2033
- Table 25: Brazil Ready To Cook Aquatic Prepared Dishes Revenue (million) Forecast, by Application 2020 & 2033
- Table 26: Brazil Ready To Cook Aquatic Prepared Dishes Volume (K) Forecast, by Application 2020 & 2033
- Table 27: Argentina Ready To Cook Aquatic Prepared Dishes Revenue (million) Forecast, by Application 2020 & 2033
- Table 28: Argentina Ready To Cook Aquatic Prepared Dishes Volume (K) Forecast, by Application 2020 & 2033
- Table 29: Rest of South America Ready To Cook Aquatic Prepared Dishes Revenue (million) Forecast, by Application 2020 & 2033
- Table 30: Rest of South America Ready To Cook Aquatic Prepared Dishes Volume (K) Forecast, by Application 2020 & 2033
- Table 31: Global Ready To Cook Aquatic Prepared Dishes Revenue million Forecast, by Application 2020 & 2033
- Table 32: Global Ready To Cook Aquatic Prepared Dishes Volume K Forecast, by Application 2020 & 2033
- Table 33: Global Ready To Cook Aquatic Prepared Dishes Revenue million Forecast, by Type 2020 & 2033
- Table 34: Global Ready To Cook Aquatic Prepared Dishes Volume K Forecast, by Type 2020 & 2033
- Table 35: Global Ready To Cook Aquatic Prepared Dishes Revenue million Forecast, by Country 2020 & 2033
- Table 36: Global Ready To Cook Aquatic Prepared Dishes Volume K Forecast, by Country 2020 & 2033
- Table 37: United Kingdom Ready To Cook Aquatic Prepared Dishes Revenue (million) Forecast, by Application 2020 & 2033
- Table 38: United Kingdom Ready To Cook Aquatic Prepared Dishes Volume (K) Forecast, by Application 2020 & 2033
- Table 39: Germany Ready To Cook Aquatic Prepared Dishes Revenue (million) Forecast, by Application 2020 & 2033
- Table 40: Germany Ready To Cook Aquatic Prepared Dishes Volume (K) Forecast, by Application 2020 & 2033
- Table 41: France Ready To Cook Aquatic Prepared Dishes Revenue (million) Forecast, by Application 2020 & 2033
- Table 42: France Ready To Cook Aquatic Prepared Dishes Volume (K) Forecast, by Application 2020 & 2033
- Table 43: Italy Ready To Cook Aquatic Prepared Dishes Revenue (million) Forecast, by Application 2020 & 2033
- Table 44: Italy Ready To Cook Aquatic Prepared Dishes Volume (K) Forecast, by Application 2020 & 2033
- Table 45: Spain Ready To Cook Aquatic Prepared Dishes Revenue (million) Forecast, by Application 2020 & 2033
- Table 46: Spain Ready To Cook Aquatic Prepared Dishes Volume (K) Forecast, by Application 2020 & 2033
- Table 47: Russia Ready To Cook Aquatic Prepared Dishes Revenue (million) Forecast, by Application 2020 & 2033
- Table 48: Russia Ready To Cook Aquatic Prepared Dishes Volume (K) Forecast, by Application 2020 & 2033
- Table 49: Benelux Ready To Cook Aquatic Prepared Dishes Revenue (million) Forecast, by Application 2020 & 2033
- Table 50: Benelux Ready To Cook Aquatic Prepared Dishes Volume (K) Forecast, by Application 2020 & 2033
- Table 51: Nordics Ready To Cook Aquatic Prepared Dishes Revenue (million) Forecast, by Application 2020 & 2033
- Table 52: Nordics Ready To Cook Aquatic Prepared Dishes Volume (K) Forecast, by Application 2020 & 2033
- Table 53: Rest of Europe Ready To Cook Aquatic Prepared Dishes Revenue (million) Forecast, by Application 2020 & 2033
- Table 54: Rest of Europe Ready To Cook Aquatic Prepared Dishes Volume (K) Forecast, by Application 2020 & 2033
- Table 55: Global Ready To Cook Aquatic Prepared Dishes Revenue million Forecast, by Application 2020 & 2033
- Table 56: Global Ready To Cook Aquatic Prepared Dishes Volume K Forecast, by Application 2020 & 2033
- Table 57: Global Ready To Cook Aquatic Prepared Dishes Revenue million Forecast, by Type 2020 & 2033
- Table 58: Global Ready To Cook Aquatic Prepared Dishes Volume K Forecast, by Type 2020 & 2033
- Table 59: Global Ready To Cook Aquatic Prepared Dishes Revenue million Forecast, by Country 2020 & 2033
- Table 60: Global Ready To Cook Aquatic Prepared Dishes Volume K Forecast, by Country 2020 & 2033
- Table 61: Turkey Ready To Cook Aquatic Prepared Dishes Revenue (million) Forecast, by Application 2020 & 2033
- Table 62: Turkey Ready To Cook Aquatic Prepared Dishes Volume (K) Forecast, by Application 2020 & 2033
- Table 63: Israel Ready To Cook Aquatic Prepared Dishes Revenue (million) Forecast, by Application 2020 & 2033
- Table 64: Israel Ready To Cook Aquatic Prepared Dishes Volume (K) Forecast, by Application 2020 & 2033
- Table 65: GCC Ready To Cook Aquatic Prepared Dishes Revenue (million) Forecast, by Application 2020 & 2033
- Table 66: GCC Ready To Cook Aquatic Prepared Dishes Volume (K) Forecast, by Application 2020 & 2033
- Table 67: North Africa Ready To Cook Aquatic Prepared Dishes Revenue (million) Forecast, by Application 2020 & 2033
- Table 68: North Africa Ready To Cook Aquatic Prepared Dishes Volume (K) Forecast, by Application 2020 & 2033
- Table 69: South Africa Ready To Cook Aquatic Prepared Dishes Revenue (million) Forecast, by Application 2020 & 2033
- Table 70: South Africa Ready To Cook Aquatic Prepared Dishes Volume (K) Forecast, by Application 2020 & 2033
- Table 71: Rest of Middle East & Africa Ready To Cook Aquatic Prepared Dishes Revenue (million) Forecast, by Application 2020 & 2033
- Table 72: Rest of Middle East & Africa Ready To Cook Aquatic Prepared Dishes Volume (K) Forecast, by Application 2020 & 2033
- Table 73: Global Ready To Cook Aquatic Prepared Dishes Revenue million Forecast, by Application 2020 & 2033
- Table 74: Global Ready To Cook Aquatic Prepared Dishes Volume K Forecast, by Application 2020 & 2033
- Table 75: Global Ready To Cook Aquatic Prepared Dishes Revenue million Forecast, by Type 2020 & 2033
- Table 76: Global Ready To Cook Aquatic Prepared Dishes Volume K Forecast, by Type 2020 & 2033
- Table 77: Global Ready To Cook Aquatic Prepared Dishes Revenue million Forecast, by Country 2020 & 2033
- Table 78: Global Ready To Cook Aquatic Prepared Dishes Volume K Forecast, by Country 2020 & 2033
- Table 79: China Ready To Cook Aquatic Prepared Dishes Revenue (million) Forecast, by Application 2020 & 2033
- Table 80: China Ready To Cook Aquatic Prepared Dishes Volume (K) Forecast, by Application 2020 & 2033
- Table 81: India Ready To Cook Aquatic Prepared Dishes Revenue (million) Forecast, by Application 2020 & 2033
- Table 82: India Ready To Cook Aquatic Prepared Dishes Volume (K) Forecast, by Application 2020 & 2033
- Table 83: Japan Ready To Cook Aquatic Prepared Dishes Revenue (million) Forecast, by Application 2020 & 2033
- Table 84: Japan Ready To Cook Aquatic Prepared Dishes Volume (K) Forecast, by Application 2020 & 2033
- Table 85: South Korea Ready To Cook Aquatic Prepared Dishes Revenue (million) Forecast, by Application 2020 & 2033
- Table 86: South Korea Ready To Cook Aquatic Prepared Dishes Volume (K) Forecast, by Application 2020 & 2033
- Table 87: ASEAN Ready To Cook Aquatic Prepared Dishes Revenue (million) Forecast, by Application 2020 & 2033
- Table 88: ASEAN Ready To Cook Aquatic Prepared Dishes Volume (K) Forecast, by Application 2020 & 2033
- Table 89: Oceania Ready To Cook Aquatic Prepared Dishes Revenue (million) Forecast, by Application 2020 & 2033
- Table 90: Oceania Ready To Cook Aquatic Prepared Dishes Volume (K) Forecast, by Application 2020 & 2033
- Table 91: Rest of Asia Pacific Ready To Cook Aquatic Prepared Dishes Revenue (million) Forecast, by Application 2020 & 2033
- Table 92: Rest of Asia Pacific Ready To Cook Aquatic Prepared Dishes Volume (K) Forecast, by Application 2020 & 2033
Frequently Asked Questions
1. What is the projected Compound Annual Growth Rate (CAGR) of the Ready To Cook Aquatic Prepared Dishes?
The projected CAGR is approximately 6.3%.
2. Which companies are prominent players in the Ready To Cook Aquatic Prepared Dishes?
Key companies in the market include Xianmeilai Food Co., Ltd, Zhanjiang Guolian Aquatic Products Co., Ltd., Fujian Anjoy Foods Co., Ltd, CNFC Overseas Fisheries Co., Ltd, Joyvio Food Co., Ltd, Dahu Aquaculture Co., Ltd, Shandong Homey Aquatic Development Co., Ltd, Suzhou Weizhixiang Food Co., Ltd, Baiyang Investment Group, Inc.
3. What are the main segments of the Ready To Cook Aquatic Prepared Dishes?
The market segments include Application, Type.
4. Can you provide details about the market size?
The market size is estimated to be USD 26370 million as of 2022.
5. What are some drivers contributing to market growth?
N/A
6. What are the notable trends driving market growth?
N/A
7. Are there any restraints impacting market growth?
N/A
8. Can you provide examples of recent developments in the market?
N/A
9. What pricing options are available for accessing the report?
Pricing options include single-user, multi-user, and enterprise licenses priced at USD 3950.00, USD 5925.00, and USD 7900.00 respectively.
10. Is the market size provided in terms of value or volume?
The market size is provided in terms of value, measured in million and volume, measured in K.
11. Are there any specific market keywords associated with the report?
Yes, the market keyword associated with the report is "Ready To Cook Aquatic Prepared Dishes," which aids in identifying and referencing the specific market segment covered.
12. How do I determine which pricing option suits my needs best?
The pricing options vary based on user requirements and access needs. Individual users may opt for single-user licenses, while businesses requiring broader access may choose multi-user or enterprise licenses for cost-effective access to the report.
13. Are there any additional resources or data provided in the Ready To Cook Aquatic Prepared Dishes report?
While the report offers comprehensive insights, it's advisable to review the specific contents or supplementary materials provided to ascertain if additional resources or data are available.
14. How can I stay updated on further developments or reports in the Ready To Cook Aquatic Prepared Dishes?
To stay informed about further developments, trends, and reports in the Ready To Cook Aquatic Prepared Dishes, consider subscribing to industry newsletters, following relevant companies and organizations, or regularly checking reputable industry news sources and publications.
Methodology
Step 1 - Identification of Relevant Samples Size from Population Database


Step 2 - Approaches for Defining Global Market Size (Value, Volume* & Price*)

Note*: In applicable scenarios
Step 3 - Data Sources
Primary Research
- Web Analytics
- Survey Reports
- Research Institute
- Latest Research Reports
- Opinion Leaders
Secondary Research
- Annual Reports
- White Paper
- Latest Press Release
- Industry Association
- Paid Database
- Investor Presentations

Step 4 - Data Triangulation
Involves using different sources of information in order to increase the validity of a study
These sources are likely to be stakeholders in a program - participants, other researchers, program staff, other community members, and so on.
Then we put all data in single framework & apply various statistical tools to find out the dynamic on the market.
During the analysis stage, feedback from the stakeholder groups would be compared to determine areas of agreement as well as areas of divergence