

Key Insights
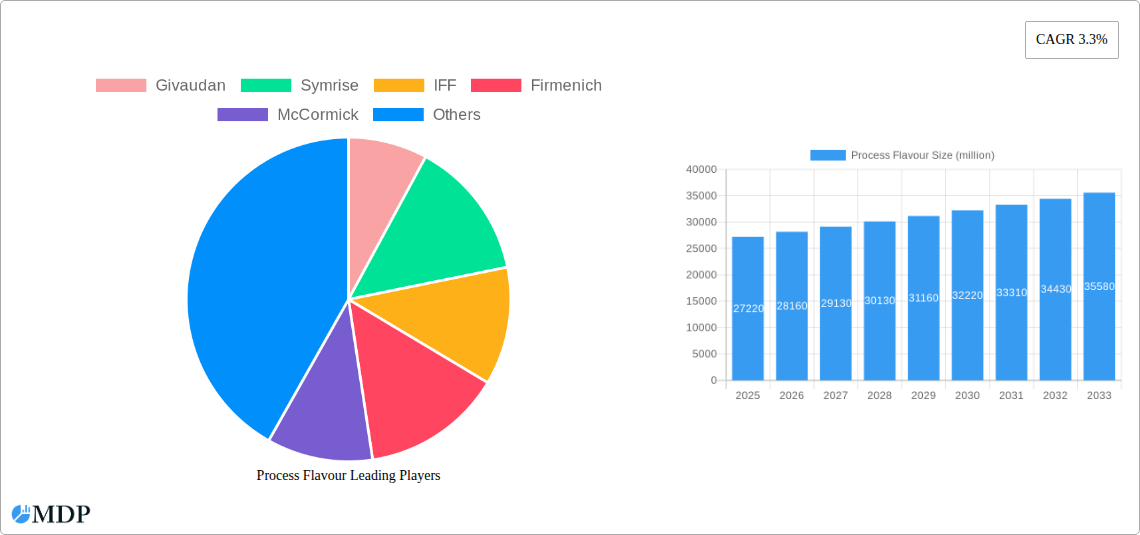
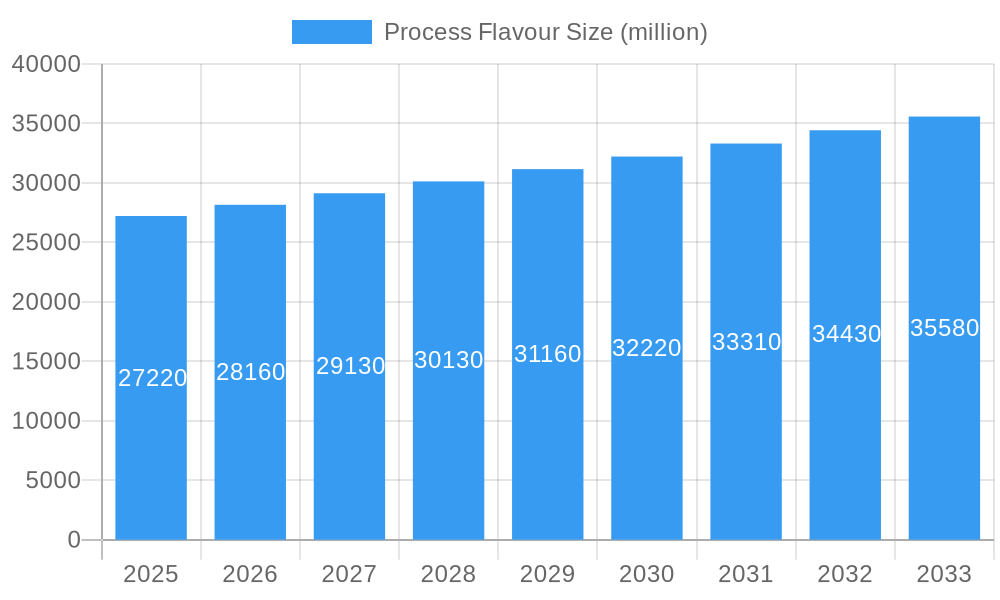
The global process flavor market, valued at $27.22 billion in 2025, is projected to experience steady growth, driven by increasing demand for convenient and ready-to-eat foods, expanding food and beverage industries in developing economies, and the rising popularity of customized flavor profiles. The compound annual growth rate (CAGR) of 3.3% from 2025 to 2033 indicates a consistent, albeit moderate, expansion. This growth is fueled by several key factors. Firstly, the continuous innovation in flavor technology allows manufacturers to create more complex and appealing flavor profiles, enhancing the sensory experience for consumers. Secondly, the growing awareness of health and wellness is leading to increased demand for natural and clean-label flavors, presenting opportunities for manufacturers focusing on sustainably sourced and organically derived ingredients. Finally, the rising disposable incomes in emerging markets are significantly contributing to increased consumption of processed foods, further boosting market growth.
Process Flavour Market Size (In Billion)
However, certain challenges are expected to moderate the market's growth. Fluctuating raw material prices, especially for natural ingredients, pose a significant challenge to manufacturers' profitability and pricing strategies. Additionally, stringent regulatory requirements and growing concerns about the potential health impacts of artificial flavors could hinder the growth of certain segments within the market. Despite these challenges, the long-term outlook for the process flavor market remains positive due to the ongoing demand for diverse and appealing flavor profiles in processed foods and beverages across various global regions. The market is further segmented by type (natural, artificial), application (beverages, dairy, confectionery etc.), and region, with key players such as Givaudan, Symrise, IFF, and Firmenich leading the market through robust innovation and global reach. The forecast period from 2025-2033 suggests a continued expansion of the market, with significant growth opportunities in emerging economies.
Process Flavour Company Market Share
Process Flavour Market Report: A Comprehensive Analysis (2019-2033)
This in-depth report provides a comprehensive analysis of the global process flavour market, offering invaluable insights for industry stakeholders seeking to navigate this dynamic sector. The report covers the period 2019-2033, with a focus on the 2025-2033 forecast period, utilizing data from the base year 2025 and leveraging historical data from 2019-2024. The study encompasses key players such as Givaudan, Symrise, IFF, Firmenich, McCormick, Kerry, ADM, Mane, Takasago, T. Hasegawa, Sensient, and Robertet, analyzing market trends, competitive landscapes, and future growth opportunities. Millions are used for all value figures.
Process Flavour Market Dynamics & Concentration
The global process flavour market, valued at xx million in 2025, is characterized by a moderately concentrated landscape dominated by a few multinational corporations. Givaudan, Symrise, and IFF collectively hold an estimated xx% market share, reflecting their extensive product portfolios, strong R&D capabilities, and global distribution networks. Innovation, particularly in natural and clean-label flavours, is a key driver, alongside regulatory pressures towards cleaner and healthier food and beverage products. The market witnesses continuous M&A activity, with xx major deals recorded between 2019 and 2024, indicating consolidation and expansion strategies among leading players. Product substitutes, such as natural extracts and plant-based alternatives, pose a growing challenge, while evolving consumer preferences for specific flavour profiles are significantly influencing market dynamics.
- Market Concentration: High, with top 3 players holding xx% market share in 2025.
- Innovation Drivers: Clean label, natural ingredients, and customized flavour solutions.
- Regulatory Frameworks: Growing focus on food safety and labeling regulations.
- Product Substitutes: Natural extracts and plant-based alternatives.
- End-User Trends: Increasing demand for healthy, convenient, and customized food & beverage options.
- M&A Activity: xx major deals between 2019 and 2024.
Process Flavour Industry Trends & Analysis
The process flavour market exhibits a robust CAGR of xx% during the forecast period (2025-2033), driven by several factors. Rising disposable incomes in developing economies are fueling demand for processed foods and beverages, boosting the consumption of flavouring agents. Technological advancements in flavour creation and delivery systems, such as encapsulation and microencapsulation, are expanding application possibilities. Consumer preferences are shifting towards natural and clean-label ingredients, impacting product development and market competition. The market displays significant regional variations, with strong growth anticipated in Asia-Pacific and Latin America. Competitive dynamics are intense, with companies focusing on product diversification, innovation, and strategic partnerships to maintain market share. Market penetration of natural and organic flavorings is increasing at xx% annually.
Leading Markets & Segments in Process Flavour
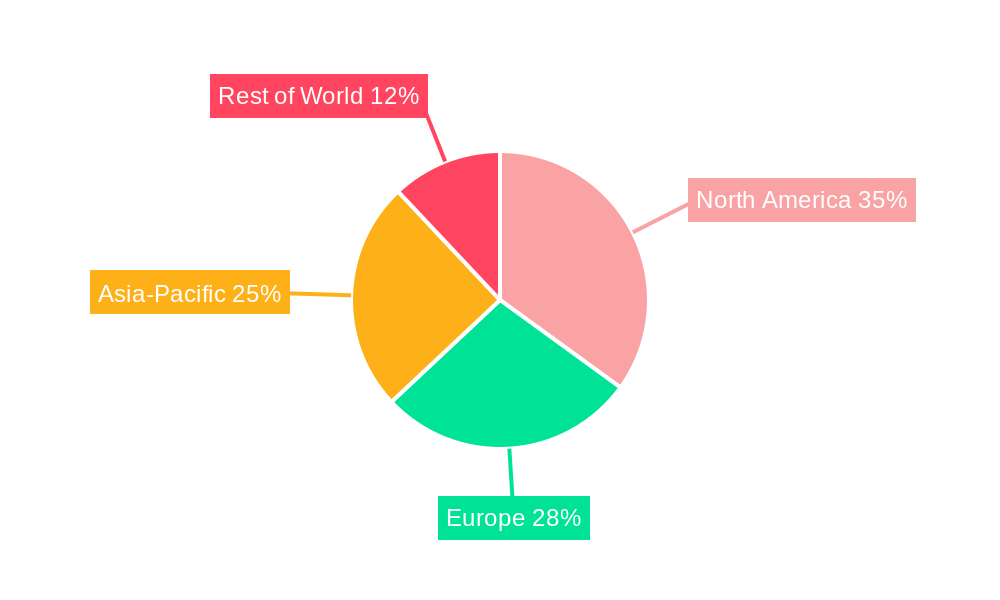
The Asia-Pacific region is the dominant market for process flavours, driven by factors such as rapid economic growth, burgeoning population, and rising demand for processed food and beverages. China and India are key contributors to regional growth. Specific key drivers include:
- Economic Growth: Rapid expansion of the middle class fueling increased consumption of processed foods.
- Population Growth: Large and growing population base creating significant demand.
- Changing Dietary Habits: Increasing adoption of westernized diets and preferences for processed foods.
- Infrastructure Development: Improved logistics and distribution networks supporting market expansion.
Dominance analysis reveals that while Europe and North America maintain significant market shares, their growth rates are comparatively slower compared to Asia-Pacific, driven by market saturation and higher regulatory scrutiny.
Process Flavour Product Developments
Recent innovations focus on developing natural, clean-label flavours with enhanced stability and improved organoleptic properties. Encapsulation technologies are gaining traction, enabling targeted flavour release and improved product shelf life. This reflects a growing consumer demand for healthier, more natural products. Companies are investing heavily in R&D to create bespoke flavour solutions tailored to specific applications and consumer preferences, offering a distinct competitive advantage.
Key Drivers of Process Flavour Growth
Technological advancements in flavour creation and delivery, coupled with the rising demand for convenient and processed foods in developing economies are key growth accelerators. Favorable regulatory environments in certain regions, promoting the use of specific flavour types, further stimulate market expansion. The growing preference for customized flavor profiles, offering unique sensory experiences, fuels growth within niche segments.
Challenges in the Process Flavour Market
Stringent regulatory requirements regarding food safety and labeling present significant hurdles, demanding extensive compliance efforts. Fluctuations in raw material prices and supply chain disruptions can negatively impact profitability and production timelines. Intense competition among established players and the emergence of new entrants puts pressure on margins and requires constant innovation to maintain a competitive edge. Estimating the precise quantifiable impact of these challenges is difficult without specific company data, but the combined effect likely reduces market growth by xx million annually.
Emerging Opportunities in Process Flavour
The integration of artificial intelligence and machine learning in flavor development opens up opportunities for creating highly customized and personalized flavour solutions. Strategic partnerships between flavour companies and food manufacturers can lead to the development of innovative and healthier products. Expansion into new and emerging markets, particularly in Africa and the Middle East, offers considerable growth potential, as these regions present untapped demand for process flavours.
Key Milestones in Process Flavour Industry
- 2020: Increased focus on clean-label ingredients and sustainable sourcing.
- 2021: Several key mergers and acquisitions reshape the competitive landscape.
- 2022: Advancements in encapsulation technologies enhance flavour stability and delivery.
- 2023: Growing adoption of AI and machine learning in flavour development.
- 2024: Launch of several innovative flavour solutions catering to specific health and wellness trends.
Strategic Outlook for Process Flavour Market
The process flavour market is poised for continued growth, driven by technological innovation, evolving consumer preferences, and expansion into new markets. Strategic partnerships, focused R&D efforts, and sustainable sourcing practices will be crucial for success. Companies that can adapt to changing regulatory landscapes and effectively leverage digital technologies will be best positioned to capitalize on future growth opportunities. The market is expected to reach xx million by 2033, representing a substantial increase from the 2025 value.
Process Flavour Segmentation
-
1. Application
- 1.1. Drinks
- 1.2. Meats
- 1.3. Snacks
- 1.4. Meat Alternatives
- 1.5. Soupes
- 1.6. Sauces
- 1.7. Others
-
2. Type
- 2.1. Vegetarian Flavor
- 2.2. Meat Flavor
Process Flavour Segmentation By Geography
-
1. North America
- 1.1. United States
- 1.2. Canada
- 1.3. Mexico
-
2. South America
- 2.1. Brazil
- 2.2. Argentina
- 2.3. Rest of South America
-
3. Europe
- 3.1. United Kingdom
- 3.2. Germany
- 3.3. France
- 3.4. Italy
- 3.5. Spain
- 3.6. Russia
- 3.7. Benelux
- 3.8. Nordics
- 3.9. Rest of Europe
-
4. Middle East & Africa
- 4.1. Turkey
- 4.2. Israel
- 4.3. GCC
- 4.4. North Africa
- 4.5. South Africa
- 4.6. Rest of Middle East & Africa
-
5. Asia Pacific
- 5.1. China
- 5.2. India
- 5.3. Japan
- 5.4. South Korea
- 5.5. ASEAN
- 5.6. Oceania
- 5.7. Rest of Asia Pacific
Process Flavour Regional Market Share
Geographic Coverage of Process Flavour
Process Flavour REPORT HIGHLIGHTS
| Aspects | Details |
|---|---|
| Study Period | 2020-2034 |
| Base Year | 2025 |
| Estimated Year | 2026 |
| Forecast Period | 2026-2034 |
| Historical Period | 2020-2025 |
| Growth Rate | CAGR of 3.3% from 2020-2034 |
| Segmentation |
|
Table of Contents
- 1. Introduction
- 1.1. Research Scope
- 1.2. Market Segmentation
- 1.3. Research Methodology
- 1.4. Definitions and Assumptions
- 2. Executive Summary
- 2.1. Introduction
- 3. Market Dynamics
- 3.1. Introduction
- 3.2. Market Drivers
- 3.3. Market Restrains
- 3.4. Market Trends
- 4. Market Factor Analysis
- 4.1. Porters Five Forces
- 4.2. Supply/Value Chain
- 4.3. PESTEL analysis
- 4.4. Market Entropy
- 4.5. Patent/Trademark Analysis
- 5. Global Process Flavour Analysis, Insights and Forecast, 2020-2032
- 5.1. Market Analysis, Insights and Forecast - by Application
- 5.1.1. Drinks
- 5.1.2. Meats
- 5.1.3. Snacks
- 5.1.4. Meat Alternatives
- 5.1.5. Soupes
- 5.1.6. Sauces
- 5.1.7. Others
- 5.2. Market Analysis, Insights and Forecast - by Type
- 5.2.1. Vegetarian Flavor
- 5.2.2. Meat Flavor
- 5.3. Market Analysis, Insights and Forecast - by Region
- 5.3.1. North America
- 5.3.2. South America
- 5.3.3. Europe
- 5.3.4. Middle East & Africa
- 5.3.5. Asia Pacific
- 5.1. Market Analysis, Insights and Forecast - by Application
- 6. North America Process Flavour Analysis, Insights and Forecast, 2020-2032
- 6.1. Market Analysis, Insights and Forecast - by Application
- 6.1.1. Drinks
- 6.1.2. Meats
- 6.1.3. Snacks
- 6.1.4. Meat Alternatives
- 6.1.5. Soupes
- 6.1.6. Sauces
- 6.1.7. Others
- 6.2. Market Analysis, Insights and Forecast - by Type
- 6.2.1. Vegetarian Flavor
- 6.2.2. Meat Flavor
- 6.1. Market Analysis, Insights and Forecast - by Application
- 7. South America Process Flavour Analysis, Insights and Forecast, 2020-2032
- 7.1. Market Analysis, Insights and Forecast - by Application
- 7.1.1. Drinks
- 7.1.2. Meats
- 7.1.3. Snacks
- 7.1.4. Meat Alternatives
- 7.1.5. Soupes
- 7.1.6. Sauces
- 7.1.7. Others
- 7.2. Market Analysis, Insights and Forecast - by Type
- 7.2.1. Vegetarian Flavor
- 7.2.2. Meat Flavor
- 7.1. Market Analysis, Insights and Forecast - by Application
- 8. Europe Process Flavour Analysis, Insights and Forecast, 2020-2032
- 8.1. Market Analysis, Insights and Forecast - by Application
- 8.1.1. Drinks
- 8.1.2. Meats
- 8.1.3. Snacks
- 8.1.4. Meat Alternatives
- 8.1.5. Soupes
- 8.1.6. Sauces
- 8.1.7. Others
- 8.2. Market Analysis, Insights and Forecast - by Type
- 8.2.1. Vegetarian Flavor
- 8.2.2. Meat Flavor
- 8.1. Market Analysis, Insights and Forecast - by Application
- 9. Middle East & Africa Process Flavour Analysis, Insights and Forecast, 2020-2032
- 9.1. Market Analysis, Insights and Forecast - by Application
- 9.1.1. Drinks
- 9.1.2. Meats
- 9.1.3. Snacks
- 9.1.4. Meat Alternatives
- 9.1.5. Soupes
- 9.1.6. Sauces
- 9.1.7. Others
- 9.2. Market Analysis, Insights and Forecast - by Type
- 9.2.1. Vegetarian Flavor
- 9.2.2. Meat Flavor
- 9.1. Market Analysis, Insights and Forecast - by Application
- 10. Asia Pacific Process Flavour Analysis, Insights and Forecast, 2020-2032
- 10.1. Market Analysis, Insights and Forecast - by Application
- 10.1.1. Drinks
- 10.1.2. Meats
- 10.1.3. Snacks
- 10.1.4. Meat Alternatives
- 10.1.5. Soupes
- 10.1.6. Sauces
- 10.1.7. Others
- 10.2. Market Analysis, Insights and Forecast - by Type
- 10.2.1. Vegetarian Flavor
- 10.2.2. Meat Flavor
- 10.1. Market Analysis, Insights and Forecast - by Application
- 11. Competitive Analysis
- 11.1. Global Market Share Analysis 2025
- 11.2. Company Profiles
- 11.2.1 Givaudan
- 11.2.1.1. Overview
- 11.2.1.2. Products
- 11.2.1.3. SWOT Analysis
- 11.2.1.4. Recent Developments
- 11.2.1.5. Financials (Based on Availability)
- 11.2.2 Symrise
- 11.2.2.1. Overview
- 11.2.2.2. Products
- 11.2.2.3. SWOT Analysis
- 11.2.2.4. Recent Developments
- 11.2.2.5. Financials (Based on Availability)
- 11.2.3 IFF
- 11.2.3.1. Overview
- 11.2.3.2. Products
- 11.2.3.3. SWOT Analysis
- 11.2.3.4. Recent Developments
- 11.2.3.5. Financials (Based on Availability)
- 11.2.4 Firmenich
- 11.2.4.1. Overview
- 11.2.4.2. Products
- 11.2.4.3. SWOT Analysis
- 11.2.4.4. Recent Developments
- 11.2.4.5. Financials (Based on Availability)
- 11.2.5 McCormick
- 11.2.5.1. Overview
- 11.2.5.2. Products
- 11.2.5.3. SWOT Analysis
- 11.2.5.4. Recent Developments
- 11.2.5.5. Financials (Based on Availability)
- 11.2.6 Kerry
- 11.2.6.1. Overview
- 11.2.6.2. Products
- 11.2.6.3. SWOT Analysis
- 11.2.6.4. Recent Developments
- 11.2.6.5. Financials (Based on Availability)
- 11.2.7 ADM
- 11.2.7.1. Overview
- 11.2.7.2. Products
- 11.2.7.3. SWOT Analysis
- 11.2.7.4. Recent Developments
- 11.2.7.5. Financials (Based on Availability)
- 11.2.8 Mane
- 11.2.8.1. Overview
- 11.2.8.2. Products
- 11.2.8.3. SWOT Analysis
- 11.2.8.4. Recent Developments
- 11.2.8.5. Financials (Based on Availability)
- 11.2.9 Takasago
- 11.2.9.1. Overview
- 11.2.9.2. Products
- 11.2.9.3. SWOT Analysis
- 11.2.9.4. Recent Developments
- 11.2.9.5. Financials (Based on Availability)
- 11.2.10 T. Hasegawa
- 11.2.10.1. Overview
- 11.2.10.2. Products
- 11.2.10.3. SWOT Analysis
- 11.2.10.4. Recent Developments
- 11.2.10.5. Financials (Based on Availability)
- 11.2.11 Sensient
- 11.2.11.1. Overview
- 11.2.11.2. Products
- 11.2.11.3. SWOT Analysis
- 11.2.11.4. Recent Developments
- 11.2.11.5. Financials (Based on Availability)
- 11.2.12 Robertet
- 11.2.12.1. Overview
- 11.2.12.2. Products
- 11.2.12.3. SWOT Analysis
- 11.2.12.4. Recent Developments
- 11.2.12.5. Financials (Based on Availability)
- 11.2.1 Givaudan
List of Figures
- Figure 1: Global Process Flavour Revenue Breakdown (million, %) by Region 2025 & 2033
- Figure 2: North America Process Flavour Revenue (million), by Application 2025 & 2033
- Figure 3: North America Process Flavour Revenue Share (%), by Application 2025 & 2033
- Figure 4: North America Process Flavour Revenue (million), by Type 2025 & 2033
- Figure 5: North America Process Flavour Revenue Share (%), by Type 2025 & 2033
- Figure 6: North America Process Flavour Revenue (million), by Country 2025 & 2033
- Figure 7: North America Process Flavour Revenue Share (%), by Country 2025 & 2033
- Figure 8: South America Process Flavour Revenue (million), by Application 2025 & 2033
- Figure 9: South America Process Flavour Revenue Share (%), by Application 2025 & 2033
- Figure 10: South America Process Flavour Revenue (million), by Type 2025 & 2033
- Figure 11: South America Process Flavour Revenue Share (%), by Type 2025 & 2033
- Figure 12: South America Process Flavour Revenue (million), by Country 2025 & 2033
- Figure 13: South America Process Flavour Revenue Share (%), by Country 2025 & 2033
- Figure 14: Europe Process Flavour Revenue (million), by Application 2025 & 2033
- Figure 15: Europe Process Flavour Revenue Share (%), by Application 2025 & 2033
- Figure 16: Europe Process Flavour Revenue (million), by Type 2025 & 2033
- Figure 17: Europe Process Flavour Revenue Share (%), by Type 2025 & 2033
- Figure 18: Europe Process Flavour Revenue (million), by Country 2025 & 2033
- Figure 19: Europe Process Flavour Revenue Share (%), by Country 2025 & 2033
- Figure 20: Middle East & Africa Process Flavour Revenue (million), by Application 2025 & 2033
- Figure 21: Middle East & Africa Process Flavour Revenue Share (%), by Application 2025 & 2033
- Figure 22: Middle East & Africa Process Flavour Revenue (million), by Type 2025 & 2033
- Figure 23: Middle East & Africa Process Flavour Revenue Share (%), by Type 2025 & 2033
- Figure 24: Middle East & Africa Process Flavour Revenue (million), by Country 2025 & 2033
- Figure 25: Middle East & Africa Process Flavour Revenue Share (%), by Country 2025 & 2033
- Figure 26: Asia Pacific Process Flavour Revenue (million), by Application 2025 & 2033
- Figure 27: Asia Pacific Process Flavour Revenue Share (%), by Application 2025 & 2033
- Figure 28: Asia Pacific Process Flavour Revenue (million), by Type 2025 & 2033
- Figure 29: Asia Pacific Process Flavour Revenue Share (%), by Type 2025 & 2033
- Figure 30: Asia Pacific Process Flavour Revenue (million), by Country 2025 & 2033
- Figure 31: Asia Pacific Process Flavour Revenue Share (%), by Country 2025 & 2033
List of Tables
- Table 1: Global Process Flavour Revenue million Forecast, by Application 2020 & 2033
- Table 2: Global Process Flavour Revenue million Forecast, by Type 2020 & 2033
- Table 3: Global Process Flavour Revenue million Forecast, by Region 2020 & 2033
- Table 4: Global Process Flavour Revenue million Forecast, by Application 2020 & 2033
- Table 5: Global Process Flavour Revenue million Forecast, by Type 2020 & 2033
- Table 6: Global Process Flavour Revenue million Forecast, by Country 2020 & 2033
- Table 7: United States Process Flavour Revenue (million) Forecast, by Application 2020 & 2033
- Table 8: Canada Process Flavour Revenue (million) Forecast, by Application 2020 & 2033
- Table 9: Mexico Process Flavour Revenue (million) Forecast, by Application 2020 & 2033
- Table 10: Global Process Flavour Revenue million Forecast, by Application 2020 & 2033
- Table 11: Global Process Flavour Revenue million Forecast, by Type 2020 & 2033
- Table 12: Global Process Flavour Revenue million Forecast, by Country 2020 & 2033
- Table 13: Brazil Process Flavour Revenue (million) Forecast, by Application 2020 & 2033
- Table 14: Argentina Process Flavour Revenue (million) Forecast, by Application 2020 & 2033
- Table 15: Rest of South America Process Flavour Revenue (million) Forecast, by Application 2020 & 2033
- Table 16: Global Process Flavour Revenue million Forecast, by Application 2020 & 2033
- Table 17: Global Process Flavour Revenue million Forecast, by Type 2020 & 2033
- Table 18: Global Process Flavour Revenue million Forecast, by Country 2020 & 2033
- Table 19: United Kingdom Process Flavour Revenue (million) Forecast, by Application 2020 & 2033
- Table 20: Germany Process Flavour Revenue (million) Forecast, by Application 2020 & 2033
- Table 21: France Process Flavour Revenue (million) Forecast, by Application 2020 & 2033
- Table 22: Italy Process Flavour Revenue (million) Forecast, by Application 2020 & 2033
- Table 23: Spain Process Flavour Revenue (million) Forecast, by Application 2020 & 2033
- Table 24: Russia Process Flavour Revenue (million) Forecast, by Application 2020 & 2033
- Table 25: Benelux Process Flavour Revenue (million) Forecast, by Application 2020 & 2033
- Table 26: Nordics Process Flavour Revenue (million) Forecast, by Application 2020 & 2033
- Table 27: Rest of Europe Process Flavour Revenue (million) Forecast, by Application 2020 & 2033
- Table 28: Global Process Flavour Revenue million Forecast, by Application 2020 & 2033
- Table 29: Global Process Flavour Revenue million Forecast, by Type 2020 & 2033
- Table 30: Global Process Flavour Revenue million Forecast, by Country 2020 & 2033
- Table 31: Turkey Process Flavour Revenue (million) Forecast, by Application 2020 & 2033
- Table 32: Israel Process Flavour Revenue (million) Forecast, by Application 2020 & 2033
- Table 33: GCC Process Flavour Revenue (million) Forecast, by Application 2020 & 2033
- Table 34: North Africa Process Flavour Revenue (million) Forecast, by Application 2020 & 2033
- Table 35: South Africa Process Flavour Revenue (million) Forecast, by Application 2020 & 2033
- Table 36: Rest of Middle East & Africa Process Flavour Revenue (million) Forecast, by Application 2020 & 2033
- Table 37: Global Process Flavour Revenue million Forecast, by Application 2020 & 2033
- Table 38: Global Process Flavour Revenue million Forecast, by Type 2020 & 2033
- Table 39: Global Process Flavour Revenue million Forecast, by Country 2020 & 2033
- Table 40: China Process Flavour Revenue (million) Forecast, by Application 2020 & 2033
- Table 41: India Process Flavour Revenue (million) Forecast, by Application 2020 & 2033
- Table 42: Japan Process Flavour Revenue (million) Forecast, by Application 2020 & 2033
- Table 43: South Korea Process Flavour Revenue (million) Forecast, by Application 2020 & 2033
- Table 44: ASEAN Process Flavour Revenue (million) Forecast, by Application 2020 & 2033
- Table 45: Oceania Process Flavour Revenue (million) Forecast, by Application 2020 & 2033
- Table 46: Rest of Asia Pacific Process Flavour Revenue (million) Forecast, by Application 2020 & 2033
Frequently Asked Questions
1. What is the projected Compound Annual Growth Rate (CAGR) of the Process Flavour?
The projected CAGR is approximately 3.3%.
2. Which companies are prominent players in the Process Flavour?
Key companies in the market include Givaudan, Symrise, IFF, Firmenich, McCormick, Kerry, ADM, Mane, Takasago, T. Hasegawa, Sensient, Robertet.
3. What are the main segments of the Process Flavour?
The market segments include Application, Type.
4. Can you provide details about the market size?
The market size is estimated to be USD 27220 million as of 2022.
5. What are some drivers contributing to market growth?
N/A
6. What are the notable trends driving market growth?
N/A
7. Are there any restraints impacting market growth?
N/A
8. Can you provide examples of recent developments in the market?
N/A
9. What pricing options are available for accessing the report?
Pricing options include single-user, multi-user, and enterprise licenses priced at USD 4250.00, USD 6375.00, and USD 8500.00 respectively.
10. Is the market size provided in terms of value or volume?
The market size is provided in terms of value, measured in million.
11. Are there any specific market keywords associated with the report?
Yes, the market keyword associated with the report is "Process Flavour," which aids in identifying and referencing the specific market segment covered.
12. How do I determine which pricing option suits my needs best?
The pricing options vary based on user requirements and access needs. Individual users may opt for single-user licenses, while businesses requiring broader access may choose multi-user or enterprise licenses for cost-effective access to the report.
13. Are there any additional resources or data provided in the Process Flavour report?
While the report offers comprehensive insights, it's advisable to review the specific contents or supplementary materials provided to ascertain if additional resources or data are available.
14. How can I stay updated on further developments or reports in the Process Flavour?
To stay informed about further developments, trends, and reports in the Process Flavour, consider subscribing to industry newsletters, following relevant companies and organizations, or regularly checking reputable industry news sources and publications.
Methodology
Step 1 - Identification of Relevant Samples Size from Population Database


Step 2 - Approaches for Defining Global Market Size (Value, Volume* & Price*)

Note*: In applicable scenarios
Step 3 - Data Sources
Primary Research
- Web Analytics
- Survey Reports
- Research Institute
- Latest Research Reports
- Opinion Leaders
Secondary Research
- Annual Reports
- White Paper
- Latest Press Release
- Industry Association
- Paid Database
- Investor Presentations

Step 4 - Data Triangulation
Involves using different sources of information in order to increase the validity of a study
These sources are likely to be stakeholders in a program - participants, other researchers, program staff, other community members, and so on.
Then we put all data in single framework & apply various statistical tools to find out the dynamic on the market.
During the analysis stage, feedback from the stakeholder groups would be compared to determine areas of agreement as well as areas of divergence