

Key Insights
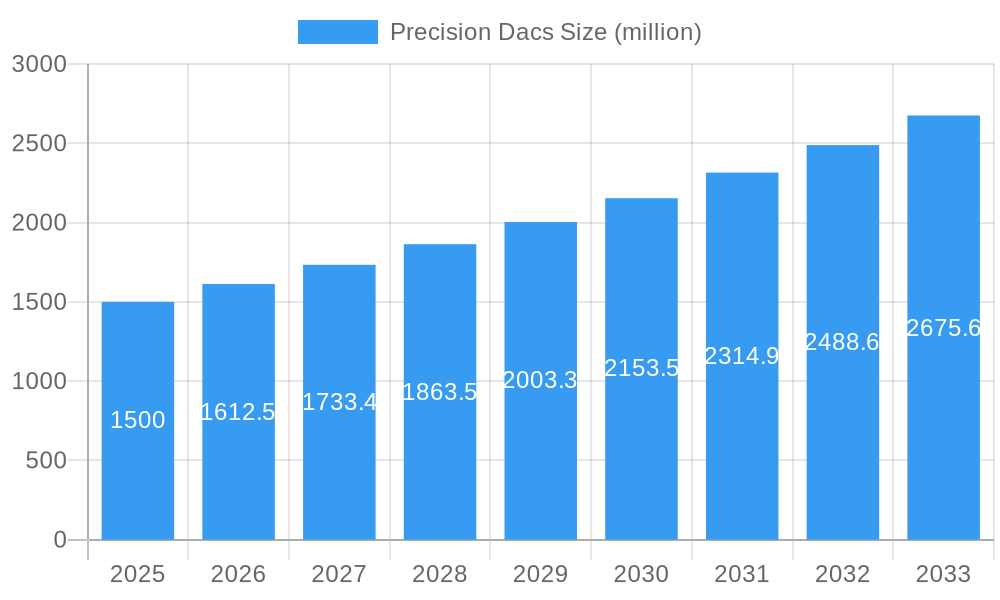
The global Precision DACs market is experiencing robust growth, driven by the increasing demand for high-fidelity signal conversion in a wide array of electronic applications. With an estimated market size of approximately $1.5 billion in 2025, the sector is projected to expand at a Compound Annual Growth Rate (CAGR) of around 7.5% through 2033. This impressive trajectory is primarily fueled by the burgeoning consumer electronics sector, where devices demand increasingly accurate audio and video processing. Furthermore, the rapid advancements and widespread adoption of communication technologies, including 5G infrastructure and sophisticated networking equipment, necessitate precise signal generation and manipulation offered by advanced DACs. The automotive industry's shift towards sophisticated infotainment systems, advanced driver-assistance systems (ADAS), and electric vehicle (EV) powertrains also presents a significant growth avenue, requiring high-performance analog-to-digital and digital-to-analog conversion for seamless operation and enhanced user experience.
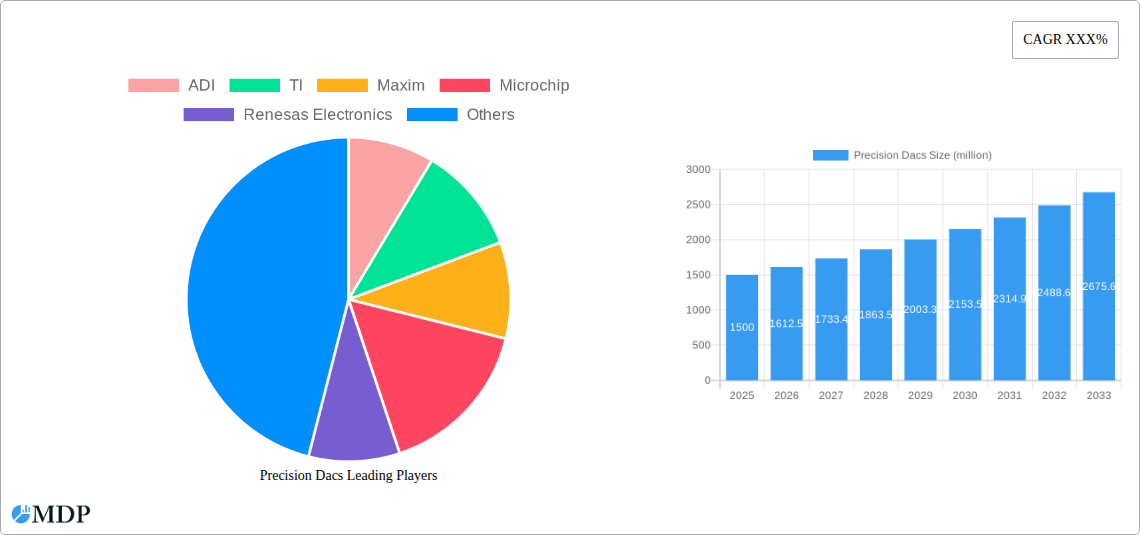
Precision Dacs Market Size (In Billion)
The market is characterized by a continuous drive towards miniaturization, lower power consumption, and higher precision, with companies investing heavily in research and development to meet these evolving demands. Key industry players like Analog Devices (ADI), Texas Instruments (TI), and Maxim Integrated are at the forefront, offering a diverse portfolio of DACs with varying output channels and resolutions. While the market is broadly segmented by application and type of output channels, the increasing complexity of modern electronic systems is pushing innovation towards DACs with multiple output channels and enhanced linearity for critical applications. However, the market faces certain restraints, including the high cost of advanced manufacturing processes and the need for stringent calibration and testing to ensure precision. Nevertheless, the persistent innovation in semiconductor technology and the expanding application landscape, especially in areas like medical devices and industrial automation, are expected to counterbalance these challenges, ensuring sustained market expansion.
Precision Dacs Company Market Share
Precision Dacs Market: Unlocking Growth and Innovation (2019-2033)
This comprehensive report delves into the dynamic global Precision DACs market, providing in-depth analysis, actionable insights, and strategic forecasts for industry stakeholders. Covering the period from 2019 to 2033, with a base year of 2025 and a forecast period of 2025–2033, this report is an essential resource for understanding market trends, competitive landscapes, and emerging opportunities. The market is projected to reach millions in value by 2025, with a significant Compound Annual Growth Rate (CAGR) driven by advancements in electronics and expanding application sectors.
Precision Dacs Market Dynamics & Concentration
The Precision DACs market exhibits a moderate to high concentration, characterized by the presence of established semiconductor giants alongside emerging innovators. Key drivers of innovation include the relentless demand for higher resolution, lower power consumption, and increased accuracy in digital-to-analog conversion across various applications. Regulatory frameworks, particularly those related to consumer electronics safety and automotive emissions, indirectly influence the design and adoption of precision DACs. Product substitutes, such as integrated analog-to-digital converters (ADCs) with limited DAC functionality, exist but generally lack the specialized performance of dedicated precision DACs. End-user trends point towards miniaturization, increased processing power, and connectivity, demanding more sophisticated and efficient DAC solutions. Mergers and acquisitions (M&A) are significant strategic activities, consolidating market share and fostering technological integration. For instance, recent M&A deals in the semiconductor industry, numbering in the dozens, have reshaped the competitive landscape, with reported deal values in the hundreds of millions to billions of dollars. Market share is dominated by a few key players, holding an estimated xx% of the total market, with the remaining share distributed among smaller, specialized manufacturers.
Precision Dacs Industry Trends & Analysis
The Precision DACs market is experiencing robust growth, fueled by several interconnected trends. The increasing complexity and performance demands of consumer electronics, from high-fidelity audio systems to advanced display technologies, are significant market growth drivers. Technological disruptions, such as the advent of multi-bit delta-sigma converters and advancements in silicon-germanium (SiGe) and gallium nitride (GaN) technologies, are enabling higher precision and efficiency. Consumer preferences are shifting towards devices with superior audio-visual quality and longer battery life, directly impacting the need for low-power, high-performance DACs. The competitive dynamics are intense, with companies vying for market share through product differentiation, technological innovation, and strategic pricing. The market penetration of precision DACs is steadily increasing across all major segments, driven by their essential role in signal processing and analog control.
- Market Growth Drivers:
- Consumer Electronics: The proliferation of smart home devices, wearable technology, and advanced audio-visual equipment.
- Automotive: The increasing integration of infotainment systems, advanced driver-assistance systems (ADAS), and electric vehicle (EV) power management.
- Communications: The deployment of 5G networks and the demand for high-speed data processing.
- Industrial Automation: The need for precise control in manufacturing processes, robotics, and sensor networks.
- Technological Advancements:
- Higher Resolution and Accuracy: Development of DACs with resolutions exceeding 20 bits.
- Lower Power Consumption: Miniaturization and efficiency improvements for battery-powered devices.
- Increased Speed and Bandwidth: Support for high-frequency signal processing.
- Integration of Features: Incorporation of digital filters, amplifiers, and other analog front-end components.
- Market Penetration: The market penetration is estimated to be around xx%, with projections for significant further growth. The Compound Annual Growth Rate (CAGR) for the Precision DACs market is anticipated to be approximately xx% over the forecast period.
Leading Markets & Segments in Precision Dacs
The Consumer Electronics segment stands as the dominant force in the global Precision DACs market, driven by the insatiable demand for high-quality audio, immersive gaming experiences, and sophisticated display technologies. Within this segment, countries with strong consumer electronics manufacturing bases, such as China, South Korea, and the United States, exhibit the highest consumption of precision DACs. The Automotive segment is a rapidly growing contender, propelled by the increasing electrification of vehicles and the integration of advanced infotainment and ADAS features. The growth here is underpinned by government initiatives promoting EVs and safety standards, leading to an increased adoption of precision DACs for precise control of vehicle systems.
In terms of product type, DACs with Output Channels: 3-7 are experiencing the most significant growth, reflecting the trend towards more complex signal processing requirements in modern electronic devices. These multi-channel DACs are crucial for applications requiring simultaneous analog output for various functions, such as audio processing in soundbars, sensor fusion in automotive systems, and control of multiple actuators in industrial automation.
- Dominant Application Segment:
- Consumer Electronics: Significant demand from high-fidelity audio, virtual reality (VR) and augmented reality (AR) devices, and smart home appliances. Factors contributing to dominance include high consumer spending, rapid product innovation cycles, and the increasing need for immersive user experiences.
- Leading Geographic Markets:
- Asia-Pacific: Dominates due to its extensive manufacturing capabilities and a large consumer base for electronics.
- North America: Strong demand driven by technological innovation and high disposable income.
- Europe: Growing adoption in automotive and industrial sectors, supported by stringent quality and performance regulations.
- Key Product Type Trends:
- Output Channels: 3-7: This category is a key growth engine, catering to the increasing complexity of signal generation in advanced applications.
- Output Channels: 2: Continues to see steady demand from established applications like audio amplifiers and measurement equipment.
- Output Channels: 1: Finds application in simpler control systems and specialized instrumentation.
Precision Dacs Product Developments
Recent product developments in the Precision DACs market are characterized by a relentless pursuit of enhanced performance and integrated functionality. Companies are introducing DACs with ultra-low noise, exceptional linearity, and wide bandwidth to meet the stringent demands of high-end audio, medical imaging, and scientific instrumentation. Innovations include the development of compact, low-power DACs suitable for portable and battery-operated devices, alongside high-speed DACs capable of processing complex waveforms for telecommunications and radar systems. The integration of digital filters, voltage references, and output amplifiers within a single chip is also a key trend, simplifying system design and reducing component count, thereby offering significant competitive advantages to manufacturers who can deliver such highly integrated solutions.
Key Drivers of Precision Dacs Growth
The growth of the Precision DACs market is primarily driven by technological advancements in semiconductor manufacturing, leading to more accurate, efficient, and cost-effective components. The expanding adoption of sophisticated electronic systems across key sectors like automotive, consumer electronics, and industrial automation significantly fuels demand. Economic factors, such as increasing global disposable income and growing investments in advanced manufacturing, also play a crucial role. Furthermore, regulatory mandates promoting energy efficiency and enhanced product performance indirectly encourage the use of precision DACs. For example, the automotive industry's shift towards electric vehicles necessitates highly precise control systems, boosting the demand for precision DACs.
Challenges in the Precision Dacs Market
Despite the positive growth trajectory, the Precision DACs market faces several challenges. Intense competition from established players and emerging manufacturers can lead to pricing pressures and reduced profit margins. Supply chain disruptions, particularly for critical raw materials and manufacturing capacity, can impact product availability and lead times, with potential lead times extending to xx weeks. Strict regulatory compliance, especially for safety-critical applications in automotive and medical devices, adds to development costs and time-to-market. Moreover, the high cost of research and development for cutting-edge technologies can be a barrier to entry for smaller companies, limiting overall market accessibility and potentially slowing down innovation adoption.
Emerging Opportunities in Precision Dacs
Emerging opportunities in the Precision DACs market lie in the burgeoning fields of the Internet of Things (IoT), artificial intelligence (AI), and advanced medical technologies. The proliferation of IoT devices, requiring precise analog control and signal processing, presents a vast untapped market. AI-powered systems and edge computing necessitate efficient and accurate DACs for real-time data conversion and control loops. Strategic partnerships between DAC manufacturers and system integrators can accelerate product development and market penetration in these rapidly evolving sectors. Market expansion into developing economies, where the adoption of advanced electronics is accelerating, also offers significant long-term growth potential.
Leading Players in the Precision Dacs Sector
- Analog Devices, Inc.
- Texas Instruments Incorporated
- Maxim Integrated Products, Inc.
- Microchip Technology Inc.
- Renesas Electronics Corporation
- KT Micro
- CoreBai Microelectronics
- Suzhou Novosense Microelectronics
- Titan Micro Electronics
Key Milestones in Precision Dacs Industry
- 2019: Introduction of xx series of ultra-low power DACs, enhancing battery life in portable devices.
- 2020: Renesas Electronics acquires Integrated Device Technology (IDT), expanding its portfolio in the high-performance analog and digital sectors.
- 2021: Texas Instruments launches a new generation of automotive-grade DACs with enhanced reliability and performance for ADAS applications.
- 2022: Analog Devices introduces a high-speed DAC with a record-breaking sample rate for 5G communications.
- 2023: Microchip Technology expands its offering of precision DACs with integrated digital potentiometers for industrial automation.
- 2024: Suzhou Novosense Microelectronics showcases innovative MEMS-based sensors with integrated precision DACs for automotive applications.
Strategic Outlook for Precision Dacs Market
The strategic outlook for the Precision DACs market is overwhelmingly positive, driven by ongoing technological innovation and expanding application landscapes. Key growth accelerators include the increasing demand for high-resolution audio in consumer electronics, the pervasive integration of advanced driver-assistance systems (ADAS) and infotainment in automotive, and the relentless push for efficiency and miniaturization in IoT devices. Companies that can offer highly integrated, low-power, and high-performance DAC solutions, coupled with strong customer support and a robust supply chain, are best positioned to capitalize on the substantial future market potential. Strategic investments in R&D focused on emerging technologies like advanced modulation techniques and integrated analog front-ends will be crucial for maintaining a competitive edge.
Precision Dacs Segmentation
-
1. Application
- 1.1. Consumer Electronics
- 1.2. Communications
- 1.3. Automotive
- 1.4. General Industrial
- 1.5. Others
-
2. Type
- 2.1. Output Channels:1
- 2.2. Output Channels:2
- 2.3. Output Channels:3-7
- 2.4. Others
Precision Dacs Segmentation By Geography
-
1. North America
- 1.1. United States
- 1.2. Canada
- 1.3. Mexico
-
2. South America
- 2.1. Brazil
- 2.2. Argentina
- 2.3. Rest of South America
-
3. Europe
- 3.1. United Kingdom
- 3.2. Germany
- 3.3. France
- 3.4. Italy
- 3.5. Spain
- 3.6. Russia
- 3.7. Benelux
- 3.8. Nordics
- 3.9. Rest of Europe
-
4. Middle East & Africa
- 4.1. Turkey
- 4.2. Israel
- 4.3. GCC
- 4.4. North Africa
- 4.5. South Africa
- 4.6. Rest of Middle East & Africa
-
5. Asia Pacific
- 5.1. China
- 5.2. India
- 5.3. Japan
- 5.4. South Korea
- 5.5. ASEAN
- 5.6. Oceania
- 5.7. Rest of Asia Pacific
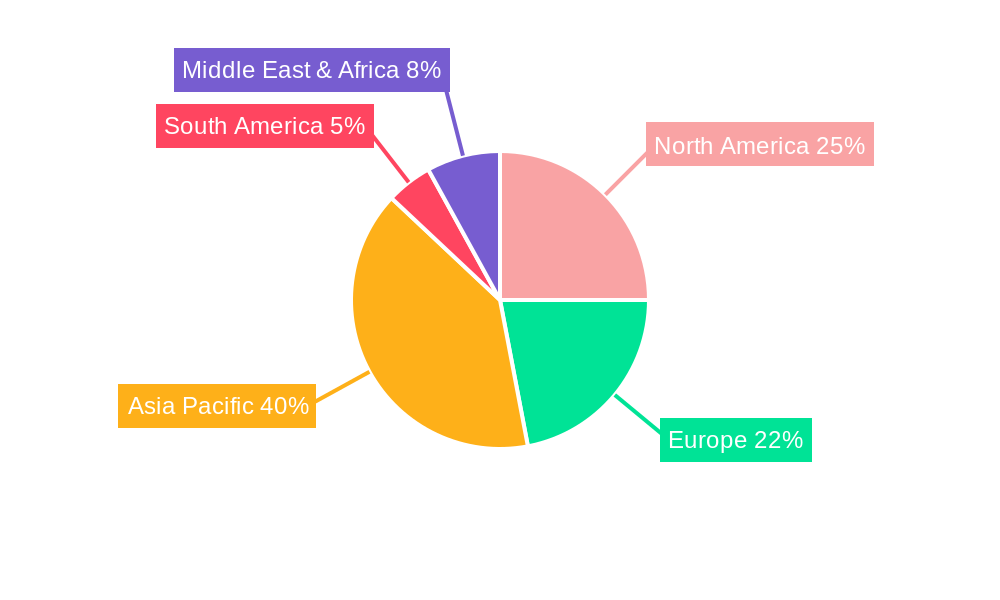
Precision Dacs Regional Market Share
Geographic Coverage of Precision Dacs
Precision Dacs REPORT HIGHLIGHTS
| Aspects | Details |
|---|---|
| Study Period | 2020-2034 |
| Base Year | 2025 |
| Estimated Year | 2026 |
| Forecast Period | 2026-2034 |
| Historical Period | 2020-2025 |
| Growth Rate | CAGR of XXX% from 2020-2034 |
| Segmentation |
|
Table of Contents
- 1. Introduction
- 1.1. Research Scope
- 1.2. Market Segmentation
- 1.3. Research Methodology
- 1.4. Definitions and Assumptions
- 2. Executive Summary
- 2.1. Introduction
- 3. Market Dynamics
- 3.1. Introduction
- 3.2. Market Drivers
- 3.3. Market Restrains
- 3.4. Market Trends
- 4. Market Factor Analysis
- 4.1. Porters Five Forces
- 4.2. Supply/Value Chain
- 4.3. PESTEL analysis
- 4.4. Market Entropy
- 4.5. Patent/Trademark Analysis
- 5. Global Precision Dacs Analysis, Insights and Forecast, 2020-2032
- 5.1. Market Analysis, Insights and Forecast - by Application
- 5.1.1. Consumer Electronics
- 5.1.2. Communications
- 5.1.3. Automotive
- 5.1.4. General Industrial
- 5.1.5. Others
- 5.2. Market Analysis, Insights and Forecast - by Type
- 5.2.1. Output Channels:1
- 5.2.2. Output Channels:2
- 5.2.3. Output Channels:3-7
- 5.2.4. Others
- 5.3. Market Analysis, Insights and Forecast - by Region
- 5.3.1. North America
- 5.3.2. South America
- 5.3.3. Europe
- 5.3.4. Middle East & Africa
- 5.3.5. Asia Pacific
- 5.1. Market Analysis, Insights and Forecast - by Application
- 6. North America Precision Dacs Analysis, Insights and Forecast, 2020-2032
- 6.1. Market Analysis, Insights and Forecast - by Application
- 6.1.1. Consumer Electronics
- 6.1.2. Communications
- 6.1.3. Automotive
- 6.1.4. General Industrial
- 6.1.5. Others
- 6.2. Market Analysis, Insights and Forecast - by Type
- 6.2.1. Output Channels:1
- 6.2.2. Output Channels:2
- 6.2.3. Output Channels:3-7
- 6.2.4. Others
- 6.1. Market Analysis, Insights and Forecast - by Application
- 7. South America Precision Dacs Analysis, Insights and Forecast, 2020-2032
- 7.1. Market Analysis, Insights and Forecast - by Application
- 7.1.1. Consumer Electronics
- 7.1.2. Communications
- 7.1.3. Automotive
- 7.1.4. General Industrial
- 7.1.5. Others
- 7.2. Market Analysis, Insights and Forecast - by Type
- 7.2.1. Output Channels:1
- 7.2.2. Output Channels:2
- 7.2.3. Output Channels:3-7
- 7.2.4. Others
- 7.1. Market Analysis, Insights and Forecast - by Application
- 8. Europe Precision Dacs Analysis, Insights and Forecast, 2020-2032
- 8.1. Market Analysis, Insights and Forecast - by Application
- 8.1.1. Consumer Electronics
- 8.1.2. Communications
- 8.1.3. Automotive
- 8.1.4. General Industrial
- 8.1.5. Others
- 8.2. Market Analysis, Insights and Forecast - by Type
- 8.2.1. Output Channels:1
- 8.2.2. Output Channels:2
- 8.2.3. Output Channels:3-7
- 8.2.4. Others
- 8.1. Market Analysis, Insights and Forecast - by Application
- 9. Middle East & Africa Precision Dacs Analysis, Insights and Forecast, 2020-2032
- 9.1. Market Analysis, Insights and Forecast - by Application
- 9.1.1. Consumer Electronics
- 9.1.2. Communications
- 9.1.3. Automotive
- 9.1.4. General Industrial
- 9.1.5. Others
- 9.2. Market Analysis, Insights and Forecast - by Type
- 9.2.1. Output Channels:1
- 9.2.2. Output Channels:2
- 9.2.3. Output Channels:3-7
- 9.2.4. Others
- 9.1. Market Analysis, Insights and Forecast - by Application
- 10. Asia Pacific Precision Dacs Analysis, Insights and Forecast, 2020-2032
- 10.1. Market Analysis, Insights and Forecast - by Application
- 10.1.1. Consumer Electronics
- 10.1.2. Communications
- 10.1.3. Automotive
- 10.1.4. General Industrial
- 10.1.5. Others
- 10.2. Market Analysis, Insights and Forecast - by Type
- 10.2.1. Output Channels:1
- 10.2.2. Output Channels:2
- 10.2.3. Output Channels:3-7
- 10.2.4. Others
- 10.1. Market Analysis, Insights and Forecast - by Application
- 11. Competitive Analysis
- 11.1. Global Market Share Analysis 2025
- 11.2. Company Profiles
- 11.2.1 ADI
- 11.2.1.1. Overview
- 11.2.1.2. Products
- 11.2.1.3. SWOT Analysis
- 11.2.1.4. Recent Developments
- 11.2.1.5. Financials (Based on Availability)
- 11.2.2 TI
- 11.2.2.1. Overview
- 11.2.2.2. Products
- 11.2.2.3. SWOT Analysis
- 11.2.2.4. Recent Developments
- 11.2.2.5. Financials (Based on Availability)
- 11.2.3 Maxim
- 11.2.3.1. Overview
- 11.2.3.2. Products
- 11.2.3.3. SWOT Analysis
- 11.2.3.4. Recent Developments
- 11.2.3.5. Financials (Based on Availability)
- 11.2.4 Microchip
- 11.2.4.1. Overview
- 11.2.4.2. Products
- 11.2.4.3. SWOT Analysis
- 11.2.4.4. Recent Developments
- 11.2.4.5. Financials (Based on Availability)
- 11.2.5 Renesas Electronics
- 11.2.5.1. Overview
- 11.2.5.2. Products
- 11.2.5.3. SWOT Analysis
- 11.2.5.4. Recent Developments
- 11.2.5.5. Financials (Based on Availability)
- 11.2.6 KT Micro
- 11.2.6.1. Overview
- 11.2.6.2. Products
- 11.2.6.3. SWOT Analysis
- 11.2.6.4. Recent Developments
- 11.2.6.5. Financials (Based on Availability)
- 11.2.7 CoreBai Microelectronics
- 11.2.7.1. Overview
- 11.2.7.2. Products
- 11.2.7.3. SWOT Analysis
- 11.2.7.4. Recent Developments
- 11.2.7.5. Financials (Based on Availability)
- 11.2.8 Suzhou Novosense Microelectronics
- 11.2.8.1. Overview
- 11.2.8.2. Products
- 11.2.8.3. SWOT Analysis
- 11.2.8.4. Recent Developments
- 11.2.8.5. Financials (Based on Availability)
- 11.2.9 TitanMicro Electronics
- 11.2.9.1. Overview
- 11.2.9.2. Products
- 11.2.9.3. SWOT Analysis
- 11.2.9.4. Recent Developments
- 11.2.9.5. Financials (Based on Availability)
- 11.2.1 ADI
List of Figures
- Figure 1: Global Precision Dacs Revenue Breakdown (million, %) by Region 2025 & 2033
- Figure 2: North America Precision Dacs Revenue (million), by Application 2025 & 2033
- Figure 3: North America Precision Dacs Revenue Share (%), by Application 2025 & 2033
- Figure 4: North America Precision Dacs Revenue (million), by Type 2025 & 2033
- Figure 5: North America Precision Dacs Revenue Share (%), by Type 2025 & 2033
- Figure 6: North America Precision Dacs Revenue (million), by Country 2025 & 2033
- Figure 7: North America Precision Dacs Revenue Share (%), by Country 2025 & 2033
- Figure 8: South America Precision Dacs Revenue (million), by Application 2025 & 2033
- Figure 9: South America Precision Dacs Revenue Share (%), by Application 2025 & 2033
- Figure 10: South America Precision Dacs Revenue (million), by Type 2025 & 2033
- Figure 11: South America Precision Dacs Revenue Share (%), by Type 2025 & 2033
- Figure 12: South America Precision Dacs Revenue (million), by Country 2025 & 2033
- Figure 13: South America Precision Dacs Revenue Share (%), by Country 2025 & 2033
- Figure 14: Europe Precision Dacs Revenue (million), by Application 2025 & 2033
- Figure 15: Europe Precision Dacs Revenue Share (%), by Application 2025 & 2033
- Figure 16: Europe Precision Dacs Revenue (million), by Type 2025 & 2033
- Figure 17: Europe Precision Dacs Revenue Share (%), by Type 2025 & 2033
- Figure 18: Europe Precision Dacs Revenue (million), by Country 2025 & 2033
- Figure 19: Europe Precision Dacs Revenue Share (%), by Country 2025 & 2033
- Figure 20: Middle East & Africa Precision Dacs Revenue (million), by Application 2025 & 2033
- Figure 21: Middle East & Africa Precision Dacs Revenue Share (%), by Application 2025 & 2033
- Figure 22: Middle East & Africa Precision Dacs Revenue (million), by Type 2025 & 2033
- Figure 23: Middle East & Africa Precision Dacs Revenue Share (%), by Type 2025 & 2033
- Figure 24: Middle East & Africa Precision Dacs Revenue (million), by Country 2025 & 2033
- Figure 25: Middle East & Africa Precision Dacs Revenue Share (%), by Country 2025 & 2033
- Figure 26: Asia Pacific Precision Dacs Revenue (million), by Application 2025 & 2033
- Figure 27: Asia Pacific Precision Dacs Revenue Share (%), by Application 2025 & 2033
- Figure 28: Asia Pacific Precision Dacs Revenue (million), by Type 2025 & 2033
- Figure 29: Asia Pacific Precision Dacs Revenue Share (%), by Type 2025 & 2033
- Figure 30: Asia Pacific Precision Dacs Revenue (million), by Country 2025 & 2033
- Figure 31: Asia Pacific Precision Dacs Revenue Share (%), by Country 2025 & 2033
List of Tables
- Table 1: Global Precision Dacs Revenue million Forecast, by Application 2020 & 2033
- Table 2: Global Precision Dacs Revenue million Forecast, by Type 2020 & 2033
- Table 3: Global Precision Dacs Revenue million Forecast, by Region 2020 & 2033
- Table 4: Global Precision Dacs Revenue million Forecast, by Application 2020 & 2033
- Table 5: Global Precision Dacs Revenue million Forecast, by Type 2020 & 2033
- Table 6: Global Precision Dacs Revenue million Forecast, by Country 2020 & 2033
- Table 7: United States Precision Dacs Revenue (million) Forecast, by Application 2020 & 2033
- Table 8: Canada Precision Dacs Revenue (million) Forecast, by Application 2020 & 2033
- Table 9: Mexico Precision Dacs Revenue (million) Forecast, by Application 2020 & 2033
- Table 10: Global Precision Dacs Revenue million Forecast, by Application 2020 & 2033
- Table 11: Global Precision Dacs Revenue million Forecast, by Type 2020 & 2033
- Table 12: Global Precision Dacs Revenue million Forecast, by Country 2020 & 2033
- Table 13: Brazil Precision Dacs Revenue (million) Forecast, by Application 2020 & 2033
- Table 14: Argentina Precision Dacs Revenue (million) Forecast, by Application 2020 & 2033
- Table 15: Rest of South America Precision Dacs Revenue (million) Forecast, by Application 2020 & 2033
- Table 16: Global Precision Dacs Revenue million Forecast, by Application 2020 & 2033
- Table 17: Global Precision Dacs Revenue million Forecast, by Type 2020 & 2033
- Table 18: Global Precision Dacs Revenue million Forecast, by Country 2020 & 2033
- Table 19: United Kingdom Precision Dacs Revenue (million) Forecast, by Application 2020 & 2033
- Table 20: Germany Precision Dacs Revenue (million) Forecast, by Application 2020 & 2033
- Table 21: France Precision Dacs Revenue (million) Forecast, by Application 2020 & 2033
- Table 22: Italy Precision Dacs Revenue (million) Forecast, by Application 2020 & 2033
- Table 23: Spain Precision Dacs Revenue (million) Forecast, by Application 2020 & 2033
- Table 24: Russia Precision Dacs Revenue (million) Forecast, by Application 2020 & 2033
- Table 25: Benelux Precision Dacs Revenue (million) Forecast, by Application 2020 & 2033
- Table 26: Nordics Precision Dacs Revenue (million) Forecast, by Application 2020 & 2033
- Table 27: Rest of Europe Precision Dacs Revenue (million) Forecast, by Application 2020 & 2033
- Table 28: Global Precision Dacs Revenue million Forecast, by Application 2020 & 2033
- Table 29: Global Precision Dacs Revenue million Forecast, by Type 2020 & 2033
- Table 30: Global Precision Dacs Revenue million Forecast, by Country 2020 & 2033
- Table 31: Turkey Precision Dacs Revenue (million) Forecast, by Application 2020 & 2033
- Table 32: Israel Precision Dacs Revenue (million) Forecast, by Application 2020 & 2033
- Table 33: GCC Precision Dacs Revenue (million) Forecast, by Application 2020 & 2033
- Table 34: North Africa Precision Dacs Revenue (million) Forecast, by Application 2020 & 2033
- Table 35: South Africa Precision Dacs Revenue (million) Forecast, by Application 2020 & 2033
- Table 36: Rest of Middle East & Africa Precision Dacs Revenue (million) Forecast, by Application 2020 & 2033
- Table 37: Global Precision Dacs Revenue million Forecast, by Application 2020 & 2033
- Table 38: Global Precision Dacs Revenue million Forecast, by Type 2020 & 2033
- Table 39: Global Precision Dacs Revenue million Forecast, by Country 2020 & 2033
- Table 40: China Precision Dacs Revenue (million) Forecast, by Application 2020 & 2033
- Table 41: India Precision Dacs Revenue (million) Forecast, by Application 2020 & 2033
- Table 42: Japan Precision Dacs Revenue (million) Forecast, by Application 2020 & 2033
- Table 43: South Korea Precision Dacs Revenue (million) Forecast, by Application 2020 & 2033
- Table 44: ASEAN Precision Dacs Revenue (million) Forecast, by Application 2020 & 2033
- Table 45: Oceania Precision Dacs Revenue (million) Forecast, by Application 2020 & 2033
- Table 46: Rest of Asia Pacific Precision Dacs Revenue (million) Forecast, by Application 2020 & 2033
Frequently Asked Questions
1. What is the projected Compound Annual Growth Rate (CAGR) of the Precision Dacs?
The projected CAGR is approximately XXX%.
2. Which companies are prominent players in the Precision Dacs?
Key companies in the market include ADI, TI, Maxim, Microchip, Renesas Electronics, KT Micro, CoreBai Microelectronics, Suzhou Novosense Microelectronics, TitanMicro Electronics.
3. What are the main segments of the Precision Dacs?
The market segments include Application, Type.
4. Can you provide details about the market size?
The market size is estimated to be USD XXX million as of 2022.
5. What are some drivers contributing to market growth?
N/A
6. What are the notable trends driving market growth?
N/A
7. Are there any restraints impacting market growth?
N/A
8. Can you provide examples of recent developments in the market?
N/A
9. What pricing options are available for accessing the report?
Pricing options include single-user, multi-user, and enterprise licenses priced at USD 2900.00, USD 4350.00, and USD 5800.00 respectively.
10. Is the market size provided in terms of value or volume?
The market size is provided in terms of value, measured in million.
11. Are there any specific market keywords associated with the report?
Yes, the market keyword associated with the report is "Precision Dacs," which aids in identifying and referencing the specific market segment covered.
12. How do I determine which pricing option suits my needs best?
The pricing options vary based on user requirements and access needs. Individual users may opt for single-user licenses, while businesses requiring broader access may choose multi-user or enterprise licenses for cost-effective access to the report.
13. Are there any additional resources or data provided in the Precision Dacs report?
While the report offers comprehensive insights, it's advisable to review the specific contents or supplementary materials provided to ascertain if additional resources or data are available.
14. How can I stay updated on further developments or reports in the Precision Dacs?
To stay informed about further developments, trends, and reports in the Precision Dacs, consider subscribing to industry newsletters, following relevant companies and organizations, or regularly checking reputable industry news sources and publications.
Methodology
Step 1 - Identification of Relevant Samples Size from Population Database


Step 2 - Approaches for Defining Global Market Size (Value, Volume* & Price*)

Note*: In applicable scenarios
Step 3 - Data Sources
Primary Research
- Web Analytics
- Survey Reports
- Research Institute
- Latest Research Reports
- Opinion Leaders
Secondary Research
- Annual Reports
- White Paper
- Latest Press Release
- Industry Association
- Paid Database
- Investor Presentations

Step 4 - Data Triangulation
Involves using different sources of information in order to increase the validity of a study
These sources are likely to be stakeholders in a program - participants, other researchers, program staff, other community members, and so on.
Then we put all data in single framework & apply various statistical tools to find out the dynamic on the market.
During the analysis stage, feedback from the stakeholder groups would be compared to determine areas of agreement as well as areas of divergence