

Key Insights
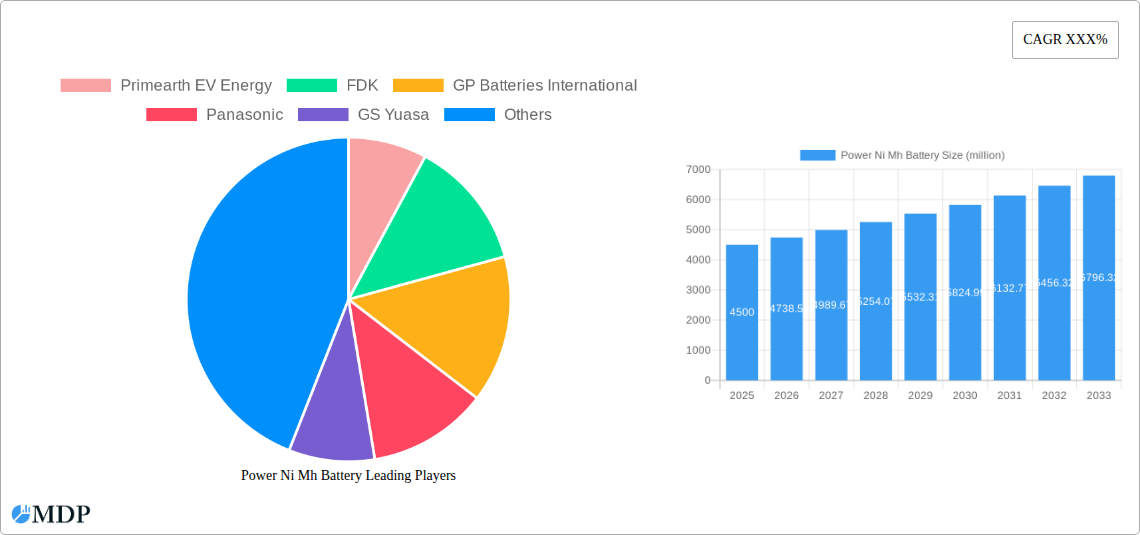
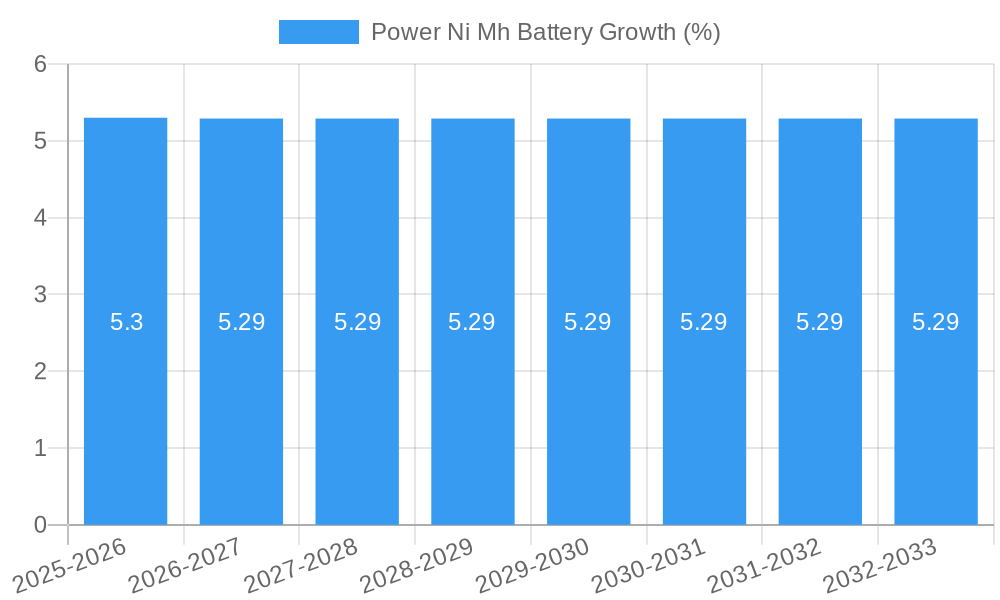
The global Nickel-Metal Hydride (NiMH) battery market is poised for robust expansion, projected to reach an estimated market size of $4,500 million by 2025. This growth is driven by a compound annual growth rate (CAGR) of approximately 5.2% anticipated between 2025 and 2033. The market's upward trajectory is primarily fueled by the increasing demand for rechargeable batteries in consumer electronics, portable medical devices, and as a crucial component in hybrid electric vehicles (HEVs). NiMH batteries offer a compelling balance of energy density, longer cycle life compared to older technologies, and a more environmentally friendly profile than traditional lead-acid batteries, making them a preferred choice for many applications. Furthermore, ongoing advancements in battery chemistry and manufacturing processes are contributing to improved performance and cost-effectiveness, further bolstering market adoption.
Despite the continued relevance of NiMH batteries, the market faces certain restraints. The emergence and rapid adoption of lithium-ion (Li-ion) batteries, particularly in high-drain applications and newer electric vehicle (EV) architectures, present a significant competitive challenge. Li-ion batteries typically offer higher energy density and lower self-discharge rates, which are attractive for manufacturers and consumers alike. However, the established infrastructure for NiMH battery production, coupled with their proven reliability and safety in specific applications, ensures their continued market presence. The market is segmented by application, with consumer electronics and automotive (specifically HEVs) being dominant categories, and by type, encompassing standard and high-performance variants. Key players like Panasonic, GS Yuasa, and Energizer are actively innovating to maintain their competitive edge.
Power Ni Mh Battery Market: Comprehensive Analysis & Future Outlook (2019-2033)
This in-depth report provides a meticulous examination of the global Power Nickel Metal Hydride (NiMH) battery market. Spanning from 2019 to 2033, with a base year of 2025 and a forecast period of 2025-2033, this study offers critical insights into market dynamics, industry trends, leading segments, product developments, growth drivers, challenges, and emerging opportunities. We analyze key players, milestones, and provide a strategic outlook for stakeholders seeking to navigate this evolving landscape. This report is designed for immediate use without modification, ensuring actionable intelligence for businesses, investors, and researchers.
Power Ni Mh Battery Market Dynamics & Concentration
The global Power NiMH battery market exhibits a moderate to high concentration, with several established players dominating market share. Leading companies like Panasonic, GS Yuasa, and Primearth EV Energy hold significant sway, controlling an estimated 45% of the market share in 2025. Innovation drivers are primarily focused on enhancing energy density, improving charge/discharge cycles, and reducing manufacturing costs. Regulatory frameworks, particularly concerning battery disposal and environmental impact, are increasingly influential, pushing for more sustainable NiMH battery solutions. Product substitutes, such as Lithium-ion batteries, pose a considerable competitive threat, especially in high-energy density applications. However, NiMH batteries retain a strong position in specific end-user segments due to their cost-effectiveness and proven reliability. M&A activities in the sector are observed to be moderate, with an estimated 5 major deals valued at over $50 million during the historical period (2019-2024), primarily aimed at consolidating market presence and acquiring new technologies. Consumer preferences are shifting towards longer battery life and faster charging capabilities, prompting manufacturers to invest in research and development to meet these demands.
Power Ni Mh Battery Industry Trends & Analysis
The Power NiMH battery market is poised for steady growth, driven by several key factors. The increasing demand for rechargeable batteries in consumer electronics, power tools, and hybrid electric vehicles (HEVs) continues to fuel market expansion. Technological advancements are focusing on improving the performance characteristics of NiMH batteries, including enhanced power density and extended cycle life, contributing to a projected compound annual growth rate (CAGR) of approximately 4.5% from 2025 to 2033. Market penetration is expected to rise as NiMH batteries continue to offer a compelling value proposition compared to alternatives in specific applications. Consumer preferences are increasingly leaning towards environmentally friendly and sustainable energy storage solutions, where NiMH batteries, with their recyclability, often hold an advantage. Competitive dynamics are characterized by ongoing innovation and price competition, with key players striving to differentiate their offerings through improved performance and cost efficiencies. The continued adoption of HEVs, even with the rise of pure EVs, presents a significant market segment for NiMH batteries, supporting their sustained relevance. Furthermore, the development of advanced NiMH chemistries with higher energy densities is enabling their application in a wider range of devices, further solidifying their market position. The report forecasts a market size of approximately $15 billion by 2033.
Leading Markets & Segments in Power Ni Mh Battery
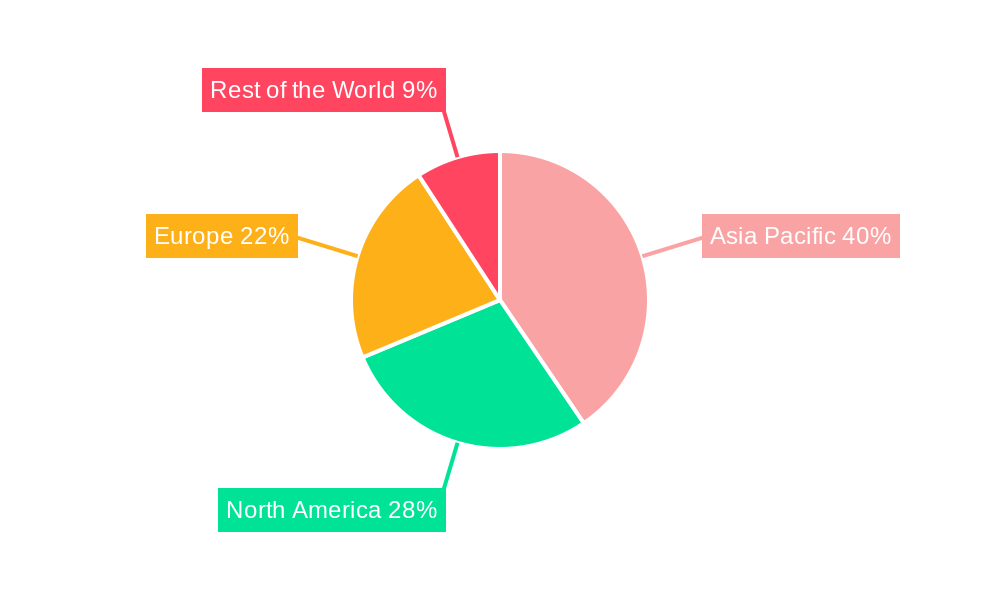
The Power NiMH battery market's dominance is characterized by specific geographical regions and application segments. Asia-Pacific, particularly China and Japan, is projected to be the leading market, accounting for an estimated 40% of the global market share in 2025. This dominance is attributed to robust manufacturing capabilities, a strong presence of key battery manufacturers, and the significant demand from the consumer electronics and automotive industries.
Application: Consumer Electronics: This segment is a major driver of NiMH battery consumption.
- Key Drivers: Proliferation of portable devices such as digital cameras, cordless phones, and toys.
- Dominance Analysis: The widespread use of rechargeable batteries in everyday consumer products, coupled with the cost-effectiveness of NiMH technology, ensures sustained demand. The convenience of readily available rechargeable options continues to appeal to a broad consumer base.
Application: Power Tools: The increasing professional and DIY use of cordless power tools is a significant contributor to NiMH battery market growth.
- Key Drivers: Demand for robust and reliable power sources in construction, manufacturing, and home improvement sectors.
- Dominance Analysis: NiMH batteries offer a good balance of power, durability, and affordability for power tools, making them a preferred choice over other battery chemistries for many applications. Their ability to deliver high current for demanding tasks is crucial.
Application: Hybrid Electric Vehicles (HEVs): NiMH batteries continue to play a vital role in the HEV market.
- Key Drivers: Growing adoption of fuel-efficient vehicles and government incentives promoting hybrid technology.
- Dominance Analysis: While Lithium-ion batteries are gaining traction in Battery Electric Vehicles (BEVs), NiMH batteries remain a cost-effective and reliable solution for HEV powertrains, offering a good balance of energy and power for regenerative braking and electric assist.
Type: AA/AAA Batteries: This segment continues to hold a substantial market share due to widespread adoption.
- Key Drivers: Ubiquitous use in household devices, remote controls, and portable electronics.
- Dominance Analysis: The established infrastructure and consumer familiarity with AA/AAA NiMH batteries ensure their continued relevance and demand.
Type: High Capacity Batteries: Innovations in NiMH technology are leading to higher capacity offerings, expanding their applicability.
- Key Drivers: Demand for longer runtime in electronic devices and specialized applications.
- Dominance Analysis: The continuous improvement in energy density allows NiMH batteries to compete in applications traditionally dominated by other chemistries, offering a safer and more cost-effective alternative.
Power Ni Mh Battery Product Developments
Product development in the Power NiMH battery market is characterized by a focus on enhancing energy density, improving charge/discharge cycles, and extending lifespan. Innovations include advanced electrode materials and electrolyte formulations that enable higher power output and faster charging capabilities. For instance, new cathode materials are being developed to achieve an energy density of up to 150 Wh/kg, compared to the current average of 120 Wh/kg. Furthermore, manufacturers are integrating intelligent battery management systems to optimize performance and safety. The competitive advantage lies in offering reliable, cost-effective, and environmentally friendlier alternatives to other battery technologies, particularly in applications where extreme temperature performance is not a primary concern and safety is paramount.
Key Drivers of Power Ni Mh Battery Growth
Several key factors are driving the growth of the Power NiMH battery market.
- Technological Advancements: Continuous improvements in energy density, charge retention, and cycle life are making NiMH batteries more competitive.
- Cost-Effectiveness: NiMH batteries offer a more economical solution for many applications compared to lithium-ion alternatives, especially in the mid-range power segment.
- Environmental Regulations: Increasing focus on sustainability and recyclability favors NiMH batteries due to their established recycling infrastructure and lower environmental impact during production.
- Hybrid Electric Vehicle (HEV) Adoption: The continued growth of the HEV market provides a significant demand base for NiMH batteries, which remain a preferred choice for many HEV manufacturers due to their proven reliability and cost-effectiveness.
- Consumer Electronics Demand: The enduring popularity of rechargeable batteries in various consumer electronic devices ensures a steady demand for NiMH solutions.
Challenges in the Power Ni Mh Battery Market
The Power NiMH battery market faces several challenges that could impede its growth.
- Competition from Lithium-ion Batteries: Lithium-ion technology offers higher energy density and lighter weight, making it increasingly dominant in premium applications like smartphones and electric vehicles.
- Limited Energy Density: Despite advancements, NiMH batteries still have a lower energy density compared to lithium-ion, restricting their use in applications where weight and space are critical.
- Self-Discharge Rate: NiMH batteries tend to have a higher self-discharge rate than lithium-ion batteries, leading to a loss of charge over time, which can be a concern for certain applications.
- Charging Time: While improving, the charging times for NiMH batteries can still be longer than some lithium-ion alternatives, impacting user convenience in certain scenarios.
- Supply Chain Volatility: Fluctuations in the prices and availability of raw materials like nickel and rare earth metals can impact production costs and market stability.
Emerging Opportunities in Power Ni Mh Battery
Emerging opportunities in the Power NiMH battery market are driven by innovation and strategic market positioning. The development of low-self-discharge (LSD) NiMH batteries offers a solution to a key challenge, broadening their appeal for devices requiring long standby times. Furthermore, advancements in battery management systems are enabling NiMH batteries to perform more efficiently in demanding applications, potentially creating new market niches. Strategic partnerships between NiMH battery manufacturers and companies in emerging technology sectors, such as renewable energy storage and advanced industrial equipment, could unlock significant growth potential. The increasing global focus on circular economy principles and sustainable manufacturing also presents an opportunity for NiMH batteries, given their well-established recycling pathways.
Leading Players in the Power Ni Mh Battery Sector
- Primearth EV Energy
- FDK
- GP Batteries International
- Panasonic
- GS Yuasa
- Spectrum Brands
- Energizer
- Shenzhen Likexing Battery
- Hunan Corun New Energy
- Highpower Tech
- Shenzhen EPT Battery
- Great Power
- Chunlan Group
Key Milestones in Power Ni Mh Battery Industry
- 2019: Introduction of next-generation Low-Self-Discharge (LSD) NiMH batteries offering improved charge retention.
- 2020: Significant investment by major manufacturers in R&D for higher energy density NiMH chemistries.
- 2021: Increased adoption of NiMH batteries in hybrid electric vehicles (HEVs) due to cost and performance benefits.
- 2022: Development of advanced manufacturing techniques leading to a reduction in NiMH battery production costs.
- 2023: Enhanced recycling processes for NiMH batteries gain traction, improving their environmental profile.
- 2024: Introduction of NiMH batteries with faster charging capabilities, addressing a key consumer pain point.
- 2025: Expected market entry of NiMH batteries with enhanced power output for industrial applications.
- 2026: Forecasted widespread adoption of NiMH batteries in emerging energy storage solutions.
- 2027-2030: Continued innovation leading to incremental improvements in energy density and cycle life.
- 2031-2033: NiMH batteries to maintain a strong presence in specific market segments due to their balance of cost, performance, and reliability.
Strategic Outlook for Power Ni Mh Battery Market
The strategic outlook for the Power NiMH battery market remains positive, with a focus on niche applications and continuous improvement. Growth accelerators will include the persistent demand from the HEV sector, the continued prevalence of NiMH in consumer electronics, and the development of specialized NiMH batteries for industrial use. Manufacturers should prioritize innovation in energy density and charge retention to remain competitive. Furthermore, leveraging the established recycling infrastructure and emphasizing the sustainability aspect of NiMH technology will be crucial for market positioning. Strategic partnerships and a focus on cost optimization will be key to navigating the competitive landscape and capitalizing on emerging opportunities in energy storage and portable power solutions.
Power Ni Mh Battery Segmentation
-
1. Application
- 1.1. undefined
-
2. Type
- 2.1. undefined
Power Ni Mh Battery Segmentation By Geography
- 1. undefined
- 2. undefined
- 3. undefined
- 4. undefined
- 5. undefined
Power Ni Mh Battery REPORT HIGHLIGHTS
| Aspects | Details |
|---|---|
| Study Period | 2019-2033 |
| Base Year | 2024 |
| Estimated Year | 2025 |
| Forecast Period | 2025-2033 |
| Historical Period | 2019-2024 |
| Growth Rate | CAGR of XXX% from 2019-2033 |
| Segmentation |
|
Table of Contents
- 1. Introduction
- 1.1. Research Scope
- 1.2. Market Segmentation
- 1.3. Research Methodology
- 1.4. Definitions and Assumptions
- 2. Executive Summary
- 2.1. Introduction
- 3. Market Dynamics
- 3.1. Introduction
- 3.2. Market Drivers
- 3.3. Market Restrains
- 3.4. Market Trends
- 4. Market Factor Analysis
- 4.1. Porters Five Forces
- 4.2. Supply/Value Chain
- 4.3. PESTEL analysis
- 4.4. Market Entropy
- 4.5. Patent/Trademark Analysis
- 5. Global Power Ni Mh Battery Analysis, Insights and Forecast, 2019-2031
- 5.1. Market Analysis, Insights and Forecast - by Application
- 5.1.1.
- 5.2. Market Analysis, Insights and Forecast - by Type
- 5.2.1.
- 5.3. Market Analysis, Insights and Forecast - by Region
- 5.3.1.
- 5.3.2.
- 5.3.3.
- 5.3.4.
- 5.3.5.
- 5.1. Market Analysis, Insights and Forecast - by Application
- 6. undefined Power Ni Mh Battery Analysis, Insights and Forecast, 2019-2031
- 6.1. Market Analysis, Insights and Forecast - by Application
- 6.1.1.
- 6.2. Market Analysis, Insights and Forecast - by Type
- 6.2.1.
- 6.1. Market Analysis, Insights and Forecast - by Application
- 7. undefined Power Ni Mh Battery Analysis, Insights and Forecast, 2019-2031
- 7.1. Market Analysis, Insights and Forecast - by Application
- 7.1.1.
- 7.2. Market Analysis, Insights and Forecast - by Type
- 7.2.1.
- 7.1. Market Analysis, Insights and Forecast - by Application
- 8. undefined Power Ni Mh Battery Analysis, Insights and Forecast, 2019-2031
- 8.1. Market Analysis, Insights and Forecast - by Application
- 8.1.1.
- 8.2. Market Analysis, Insights and Forecast - by Type
- 8.2.1.
- 8.1. Market Analysis, Insights and Forecast - by Application
- 9. undefined Power Ni Mh Battery Analysis, Insights and Forecast, 2019-2031
- 9.1. Market Analysis, Insights and Forecast - by Application
- 9.1.1.
- 9.2. Market Analysis, Insights and Forecast - by Type
- 9.2.1.
- 9.1. Market Analysis, Insights and Forecast - by Application
- 10. undefined Power Ni Mh Battery Analysis, Insights and Forecast, 2019-2031
- 10.1. Market Analysis, Insights and Forecast - by Application
- 10.1.1.
- 10.2. Market Analysis, Insights and Forecast - by Type
- 10.2.1.
- 10.1. Market Analysis, Insights and Forecast - by Application
- 11. Competitive Analysis
- 11.1. Global Market Share Analysis 2024
- 11.2. Company Profiles
- 11.2.1 Primearth EV Energy
- 11.2.1.1. Overview
- 11.2.1.2. Products
- 11.2.1.3. SWOT Analysis
- 11.2.1.4. Recent Developments
- 11.2.1.5. Financials (Based on Availability)
- 11.2.2 FDK
- 11.2.2.1. Overview
- 11.2.2.2. Products
- 11.2.2.3. SWOT Analysis
- 11.2.2.4. Recent Developments
- 11.2.2.5. Financials (Based on Availability)
- 11.2.3 GP Batteries International
- 11.2.3.1. Overview
- 11.2.3.2. Products
- 11.2.3.3. SWOT Analysis
- 11.2.3.4. Recent Developments
- 11.2.3.5. Financials (Based on Availability)
- 11.2.4 Panasonic
- 11.2.4.1. Overview
- 11.2.4.2. Products
- 11.2.4.3. SWOT Analysis
- 11.2.4.4. Recent Developments
- 11.2.4.5. Financials (Based on Availability)
- 11.2.5 GS Yuasa
- 11.2.5.1. Overview
- 11.2.5.2. Products
- 11.2.5.3. SWOT Analysis
- 11.2.5.4. Recent Developments
- 11.2.5.5. Financials (Based on Availability)
- 11.2.6 Spectrum Brands
- 11.2.6.1. Overview
- 11.2.6.2. Products
- 11.2.6.3. SWOT Analysis
- 11.2.6.4. Recent Developments
- 11.2.6.5. Financials (Based on Availability)
- 11.2.7 Energizer
- 11.2.7.1. Overview
- 11.2.7.2. Products
- 11.2.7.3. SWOT Analysis
- 11.2.7.4. Recent Developments
- 11.2.7.5. Financials (Based on Availability)
- 11.2.8 Shenzhen Likexing Battery
- 11.2.8.1. Overview
- 11.2.8.2. Products
- 11.2.8.3. SWOT Analysis
- 11.2.8.4. Recent Developments
- 11.2.8.5. Financials (Based on Availability)
- 11.2.9 Hunan Corun New Energy
- 11.2.9.1. Overview
- 11.2.9.2. Products
- 11.2.9.3. SWOT Analysis
- 11.2.9.4. Recent Developments
- 11.2.9.5. Financials (Based on Availability)
- 11.2.10 Highpower Tech
- 11.2.10.1. Overview
- 11.2.10.2. Products
- 11.2.10.3. SWOT Analysis
- 11.2.10.4. Recent Developments
- 11.2.10.5. Financials (Based on Availability)
- 11.2.11 Shenzhen EPT Battery
- 11.2.11.1. Overview
- 11.2.11.2. Products
- 11.2.11.3. SWOT Analysis
- 11.2.11.4. Recent Developments
- 11.2.11.5. Financials (Based on Availability)
- 11.2.12 Great Power
- 11.2.12.1. Overview
- 11.2.12.2. Products
- 11.2.12.3. SWOT Analysis
- 11.2.12.4. Recent Developments
- 11.2.12.5. Financials (Based on Availability)
- 11.2.13 Chunlan Group
- 11.2.13.1. Overview
- 11.2.13.2. Products
- 11.2.13.3. SWOT Analysis
- 11.2.13.4. Recent Developments
- 11.2.13.5. Financials (Based on Availability)
- 11.2.1 Primearth EV Energy
List of Figures
- Figure 1: Global Power Ni Mh Battery Revenue Breakdown (million, %) by Region 2024 & 2032
- Figure 2: Global Power Ni Mh Battery Volume Breakdown (K, %) by Region 2024 & 2032
- Figure 3: undefined Power Ni Mh Battery Revenue (million), by Application 2024 & 2032
- Figure 4: undefined Power Ni Mh Battery Volume (K), by Application 2024 & 2032
- Figure 5: undefined Power Ni Mh Battery Revenue Share (%), by Application 2024 & 2032
- Figure 6: undefined Power Ni Mh Battery Volume Share (%), by Application 2024 & 2032
- Figure 7: undefined Power Ni Mh Battery Revenue (million), by Type 2024 & 2032
- Figure 8: undefined Power Ni Mh Battery Volume (K), by Type 2024 & 2032
- Figure 9: undefined Power Ni Mh Battery Revenue Share (%), by Type 2024 & 2032
- Figure 10: undefined Power Ni Mh Battery Volume Share (%), by Type 2024 & 2032
- Figure 11: undefined Power Ni Mh Battery Revenue (million), by Country 2024 & 2032
- Figure 12: undefined Power Ni Mh Battery Volume (K), by Country 2024 & 2032
- Figure 13: undefined Power Ni Mh Battery Revenue Share (%), by Country 2024 & 2032
- Figure 14: undefined Power Ni Mh Battery Volume Share (%), by Country 2024 & 2032
- Figure 15: undefined Power Ni Mh Battery Revenue (million), by Application 2024 & 2032
- Figure 16: undefined Power Ni Mh Battery Volume (K), by Application 2024 & 2032
- Figure 17: undefined Power Ni Mh Battery Revenue Share (%), by Application 2024 & 2032
- Figure 18: undefined Power Ni Mh Battery Volume Share (%), by Application 2024 & 2032
- Figure 19: undefined Power Ni Mh Battery Revenue (million), by Type 2024 & 2032
- Figure 20: undefined Power Ni Mh Battery Volume (K), by Type 2024 & 2032
- Figure 21: undefined Power Ni Mh Battery Revenue Share (%), by Type 2024 & 2032
- Figure 22: undefined Power Ni Mh Battery Volume Share (%), by Type 2024 & 2032
- Figure 23: undefined Power Ni Mh Battery Revenue (million), by Country 2024 & 2032
- Figure 24: undefined Power Ni Mh Battery Volume (K), by Country 2024 & 2032
- Figure 25: undefined Power Ni Mh Battery Revenue Share (%), by Country 2024 & 2032
- Figure 26: undefined Power Ni Mh Battery Volume Share (%), by Country 2024 & 2032
- Figure 27: undefined Power Ni Mh Battery Revenue (million), by Application 2024 & 2032
- Figure 28: undefined Power Ni Mh Battery Volume (K), by Application 2024 & 2032
- Figure 29: undefined Power Ni Mh Battery Revenue Share (%), by Application 2024 & 2032
- Figure 30: undefined Power Ni Mh Battery Volume Share (%), by Application 2024 & 2032
- Figure 31: undefined Power Ni Mh Battery Revenue (million), by Type 2024 & 2032
- Figure 32: undefined Power Ni Mh Battery Volume (K), by Type 2024 & 2032
- Figure 33: undefined Power Ni Mh Battery Revenue Share (%), by Type 2024 & 2032
- Figure 34: undefined Power Ni Mh Battery Volume Share (%), by Type 2024 & 2032
- Figure 35: undefined Power Ni Mh Battery Revenue (million), by Country 2024 & 2032
- Figure 36: undefined Power Ni Mh Battery Volume (K), by Country 2024 & 2032
- Figure 37: undefined Power Ni Mh Battery Revenue Share (%), by Country 2024 & 2032
- Figure 38: undefined Power Ni Mh Battery Volume Share (%), by Country 2024 & 2032
- Figure 39: undefined Power Ni Mh Battery Revenue (million), by Application 2024 & 2032
- Figure 40: undefined Power Ni Mh Battery Volume (K), by Application 2024 & 2032
- Figure 41: undefined Power Ni Mh Battery Revenue Share (%), by Application 2024 & 2032
- Figure 42: undefined Power Ni Mh Battery Volume Share (%), by Application 2024 & 2032
- Figure 43: undefined Power Ni Mh Battery Revenue (million), by Type 2024 & 2032
- Figure 44: undefined Power Ni Mh Battery Volume (K), by Type 2024 & 2032
- Figure 45: undefined Power Ni Mh Battery Revenue Share (%), by Type 2024 & 2032
- Figure 46: undefined Power Ni Mh Battery Volume Share (%), by Type 2024 & 2032
- Figure 47: undefined Power Ni Mh Battery Revenue (million), by Country 2024 & 2032
- Figure 48: undefined Power Ni Mh Battery Volume (K), by Country 2024 & 2032
- Figure 49: undefined Power Ni Mh Battery Revenue Share (%), by Country 2024 & 2032
- Figure 50: undefined Power Ni Mh Battery Volume Share (%), by Country 2024 & 2032
- Figure 51: undefined Power Ni Mh Battery Revenue (million), by Application 2024 & 2032
- Figure 52: undefined Power Ni Mh Battery Volume (K), by Application 2024 & 2032
- Figure 53: undefined Power Ni Mh Battery Revenue Share (%), by Application 2024 & 2032
- Figure 54: undefined Power Ni Mh Battery Volume Share (%), by Application 2024 & 2032
- Figure 55: undefined Power Ni Mh Battery Revenue (million), by Type 2024 & 2032
- Figure 56: undefined Power Ni Mh Battery Volume (K), by Type 2024 & 2032
- Figure 57: undefined Power Ni Mh Battery Revenue Share (%), by Type 2024 & 2032
- Figure 58: undefined Power Ni Mh Battery Volume Share (%), by Type 2024 & 2032
- Figure 59: undefined Power Ni Mh Battery Revenue (million), by Country 2024 & 2032
- Figure 60: undefined Power Ni Mh Battery Volume (K), by Country 2024 & 2032
- Figure 61: undefined Power Ni Mh Battery Revenue Share (%), by Country 2024 & 2032
- Figure 62: undefined Power Ni Mh Battery Volume Share (%), by Country 2024 & 2032
List of Tables
- Table 1: Global Power Ni Mh Battery Revenue million Forecast, by Region 2019 & 2032
- Table 2: Global Power Ni Mh Battery Volume K Forecast, by Region 2019 & 2032
- Table 3: Global Power Ni Mh Battery Revenue million Forecast, by Application 2019 & 2032
- Table 4: Global Power Ni Mh Battery Volume K Forecast, by Application 2019 & 2032
- Table 5: Global Power Ni Mh Battery Revenue million Forecast, by Type 2019 & 2032
- Table 6: Global Power Ni Mh Battery Volume K Forecast, by Type 2019 & 2032
- Table 7: Global Power Ni Mh Battery Revenue million Forecast, by Region 2019 & 2032
- Table 8: Global Power Ni Mh Battery Volume K Forecast, by Region 2019 & 2032
- Table 9: Global Power Ni Mh Battery Revenue million Forecast, by Application 2019 & 2032
- Table 10: Global Power Ni Mh Battery Volume K Forecast, by Application 2019 & 2032
- Table 11: Global Power Ni Mh Battery Revenue million Forecast, by Type 2019 & 2032
- Table 12: Global Power Ni Mh Battery Volume K Forecast, by Type 2019 & 2032
- Table 13: Global Power Ni Mh Battery Revenue million Forecast, by Country 2019 & 2032
- Table 14: Global Power Ni Mh Battery Volume K Forecast, by Country 2019 & 2032
- Table 15: Global Power Ni Mh Battery Revenue million Forecast, by Application 2019 & 2032
- Table 16: Global Power Ni Mh Battery Volume K Forecast, by Application 2019 & 2032
- Table 17: Global Power Ni Mh Battery Revenue million Forecast, by Type 2019 & 2032
- Table 18: Global Power Ni Mh Battery Volume K Forecast, by Type 2019 & 2032
- Table 19: Global Power Ni Mh Battery Revenue million Forecast, by Country 2019 & 2032
- Table 20: Global Power Ni Mh Battery Volume K Forecast, by Country 2019 & 2032
- Table 21: Global Power Ni Mh Battery Revenue million Forecast, by Application 2019 & 2032
- Table 22: Global Power Ni Mh Battery Volume K Forecast, by Application 2019 & 2032
- Table 23: Global Power Ni Mh Battery Revenue million Forecast, by Type 2019 & 2032
- Table 24: Global Power Ni Mh Battery Volume K Forecast, by Type 2019 & 2032
- Table 25: Global Power Ni Mh Battery Revenue million Forecast, by Country 2019 & 2032
- Table 26: Global Power Ni Mh Battery Volume K Forecast, by Country 2019 & 2032
- Table 27: Global Power Ni Mh Battery Revenue million Forecast, by Application 2019 & 2032
- Table 28: Global Power Ni Mh Battery Volume K Forecast, by Application 2019 & 2032
- Table 29: Global Power Ni Mh Battery Revenue million Forecast, by Type 2019 & 2032
- Table 30: Global Power Ni Mh Battery Volume K Forecast, by Type 2019 & 2032
- Table 31: Global Power Ni Mh Battery Revenue million Forecast, by Country 2019 & 2032
- Table 32: Global Power Ni Mh Battery Volume K Forecast, by Country 2019 & 2032
- Table 33: Global Power Ni Mh Battery Revenue million Forecast, by Application 2019 & 2032
- Table 34: Global Power Ni Mh Battery Volume K Forecast, by Application 2019 & 2032
- Table 35: Global Power Ni Mh Battery Revenue million Forecast, by Type 2019 & 2032
- Table 36: Global Power Ni Mh Battery Volume K Forecast, by Type 2019 & 2032
- Table 37: Global Power Ni Mh Battery Revenue million Forecast, by Country 2019 & 2032
- Table 38: Global Power Ni Mh Battery Volume K Forecast, by Country 2019 & 2032
Frequently Asked Questions
1. What is the projected Compound Annual Growth Rate (CAGR) of the Power Ni Mh Battery?
The projected CAGR is approximately XXX%.
2. Which companies are prominent players in the Power Ni Mh Battery?
Key companies in the market include Primearth EV Energy, FDK, GP Batteries International, Panasonic, GS Yuasa, Spectrum Brands, Energizer, Shenzhen Likexing Battery, Hunan Corun New Energy, Highpower Tech, Shenzhen EPT Battery, Great Power, Chunlan Group.
3. What are the main segments of the Power Ni Mh Battery?
The market segments include Application, Type.
4. Can you provide details about the market size?
The market size is estimated to be USD XXX million as of 2022.
5. What are some drivers contributing to market growth?
N/A
6. What are the notable trends driving market growth?
N/A
7. Are there any restraints impacting market growth?
N/A
8. Can you provide examples of recent developments in the market?
N/A
9. What pricing options are available for accessing the report?
Pricing options include single-user, multi-user, and enterprise licenses priced at USD 3950.00, USD 5925.00, and USD 7900.00 respectively.
10. Is the market size provided in terms of value or volume?
The market size is provided in terms of value, measured in million and volume, measured in K.
11. Are there any specific market keywords associated with the report?
Yes, the market keyword associated with the report is "Power Ni Mh Battery," which aids in identifying and referencing the specific market segment covered.
12. How do I determine which pricing option suits my needs best?
The pricing options vary based on user requirements and access needs. Individual users may opt for single-user licenses, while businesses requiring broader access may choose multi-user or enterprise licenses for cost-effective access to the report.
13. Are there any additional resources or data provided in the Power Ni Mh Battery report?
While the report offers comprehensive insights, it's advisable to review the specific contents or supplementary materials provided to ascertain if additional resources or data are available.
14. How can I stay updated on further developments or reports in the Power Ni Mh Battery?
To stay informed about further developments, trends, and reports in the Power Ni Mh Battery, consider subscribing to industry newsletters, following relevant companies and organizations, or regularly checking reputable industry news sources and publications.
Methodology
Step 1 - Identification of Relevant Samples Size from Population Database


Step 2 - Approaches for Defining Global Market Size (Value, Volume* & Price*)

Note*: In applicable scenarios
Step 3 - Data Sources
Primary Research
- Web Analytics
- Survey Reports
- Research Institute
- Latest Research Reports
- Opinion Leaders
Secondary Research
- Annual Reports
- White Paper
- Latest Press Release
- Industry Association
- Paid Database
- Investor Presentations

Step 4 - Data Triangulation
Involves using different sources of information in order to increase the validity of a study
These sources are likely to be stakeholders in a program - participants, other researchers, program staff, other community members, and so on.
Then we put all data in single framework & apply various statistical tools to find out the dynamic on the market.
During the analysis stage, feedback from the stakeholder groups would be compared to determine areas of agreement as well as areas of divergence
