

Key Insights
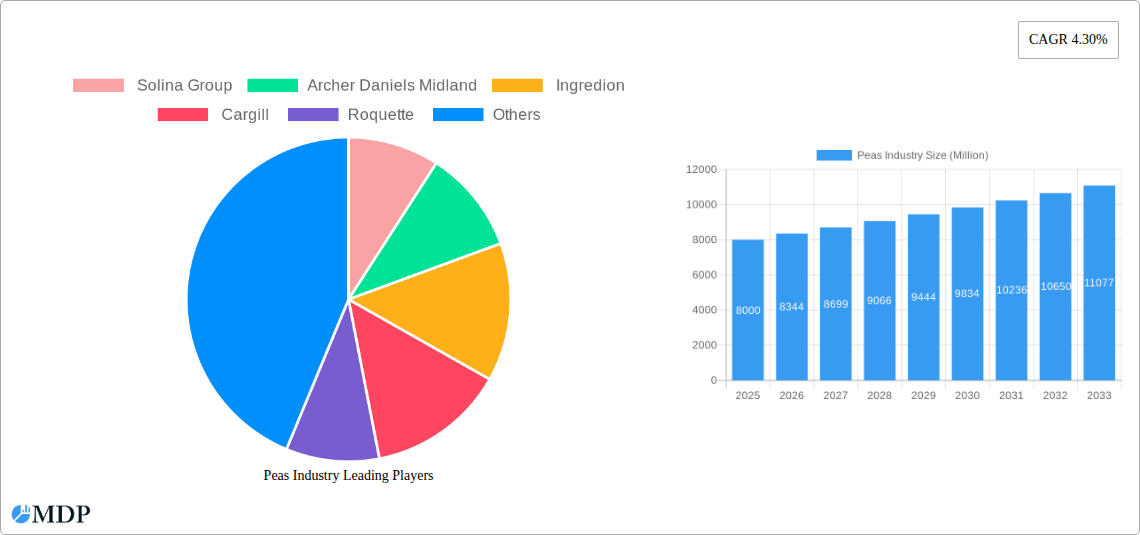
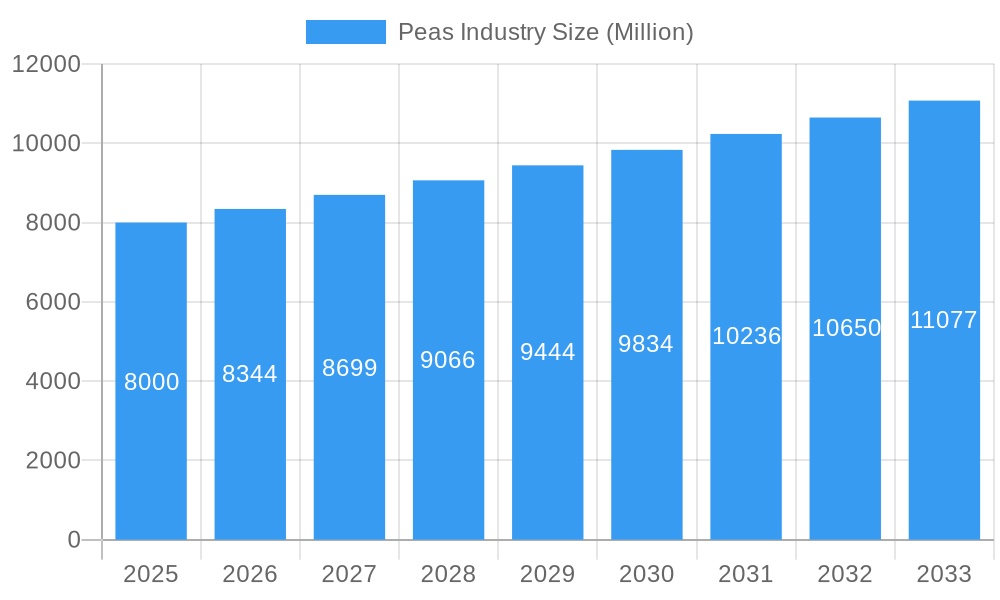
The global peas market, valued at approximately $8 billion in 2025, is projected to experience robust growth, driven by a compound annual growth rate (CAGR) of 4.30% from 2025 to 2033. This expansion is fueled by several key factors. Firstly, the increasing demand for plant-based proteins is significantly boosting the consumption of peas, particularly pea protein, which is a sustainable and nutritious alternative to traditional protein sources. This trend is further amplified by the growing awareness of health and wellness, with consumers actively seeking out plant-based diets. Secondly, the versatility of peas extends beyond direct consumption; its use as an ingredient in various food products, animal feed, and even biofuels contributes significantly to market growth. The food industry's increasing incorporation of peas into processed foods, snacks, and ready meals drives considerable volume, while the feed industry benefits from peas' nutritional value for livestock. Finally, technological advancements in pea processing and the development of new pea-based products are creating further market opportunities. However, factors such as weather conditions affecting crop yields and fluctuations in raw material prices can pose challenges to consistent market growth.
Peas Industry Market Size (In Billion)
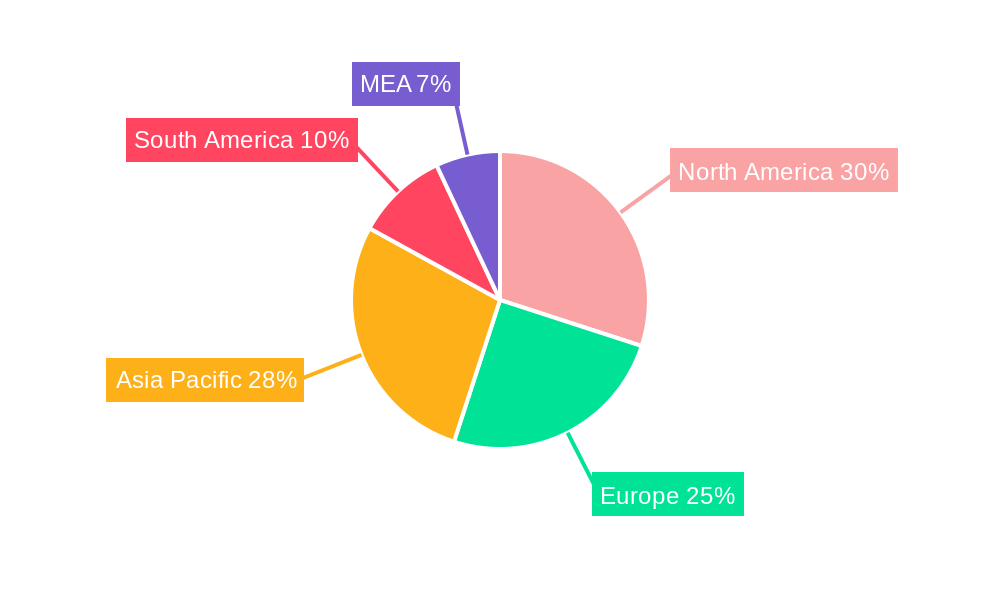
The market is segmented by product type (dry peas, green peas, pea protein, pea starch) and end-use (food, feed, biofuels). The food segment is currently the largest, but the biofuel segment is expected to witness significant growth due to increasing government support for sustainable bioenergy sources. Geographically, North America and Europe are major players, but the Asia-Pacific region is poised for rapid expansion, primarily due to rising disposable incomes and increasing demand for protein-rich diets in developing economies like India and China. Key players like Solina Group, Archer Daniels Midland, Ingredion, Cargill, and Roquette are actively involved in expanding their product portfolios and geographical reach to capitalize on this burgeoning market. Competitive strategies focus on product innovation, efficient supply chains, and sustainable sourcing practices to meet the growing global demand for peas and pea-derived products.
Peas Industry Company Market Share
Peas Industry Market Report: 2019-2033 Forecast
This comprehensive report provides an in-depth analysis of the global peas industry, projecting robust growth from 2025 to 2033. With a focus on market dynamics, leading players, and emerging opportunities, this report is an essential resource for industry stakeholders, investors, and anyone seeking to understand the future of this dynamic sector. The report utilizes data from the historical period (2019-2024), base year (2025), and estimated year (2025) to project market trends through 2033. The report includes detailed analysis of key segments including dry peas, green peas, pea protein, and pea starch, across end-use sectors such as food, feed, and biofuels. The total market value is projected to reach xx Million by 2033.
Peas Industry Market Dynamics & Concentration
The global peas industry is characterized by a moderately concentrated market structure, with a few major players holding significant market share. Companies like Solina Group, Archer Daniels Midland, Ingredion, Cargill, and Roquette dominate the landscape, driving innovation and influencing market trends. The market exhibits significant consolidation through mergers and acquisitions (M&A) activities, with an estimated xx M&A deals recorded between 2019 and 2024. Market share data indicates that the top five players collectively hold approximately xx% of the global market.
- Innovation Drivers: Growing consumer demand for plant-based proteins, sustainable food solutions, and functional ingredients fuels significant R&D investment in pea-based products.
- Regulatory Frameworks: Government regulations concerning food safety, labeling, and sustainability practices influence market dynamics and create opportunities for companies offering compliant products.
- Product Substitutes: The industry faces competition from other plant-based protein sources, such as soy and lentils, requiring continuous innovation to maintain a competitive edge.
- End-User Trends: The shift towards health-conscious diets and increased demand for plant-based alternatives across the food, feed, and biofuel industries are key market drivers.
- M&A Activities: Consolidation through mergers and acquisitions is expected to continue, driven by the desire for increased market share and access to new technologies.
Peas Industry Industry Trends & Analysis
The global peas industry is experiencing robust growth, driven by multiple factors. The Compound Annual Growth Rate (CAGR) is projected at xx% from 2025 to 2033. This growth is fueled by the rising popularity of plant-based diets, coupled with the increasing awareness of the environmental and health benefits associated with pea consumption. Market penetration of pea-based products in food applications is steadily increasing, with significant growth anticipated in the feed and biofuel sectors. Technological advancements in processing and extraction techniques are enabling the development of innovative pea-based products with enhanced nutritional profiles and functional properties. The competitive landscape is dynamic, with companies focusing on product diversification, brand building, and strategic partnerships to maintain market leadership.
Leading Markets & Segments in Peas Industry
The leading segment within the peas industry is currently the food sector, specifically dry peas and green peas, contributing approximately xx Million to the total market value in 2025. The North American and European markets are the dominant regions, driven by strong consumer demand, robust infrastructure, and favorable regulatory frameworks.
Key Drivers:
- Economic Policies: Government support for agriculture and sustainable food systems in North America and Europe stimulates industry growth.
- Infrastructure: Efficient transportation networks and robust food processing infrastructure support large-scale production and distribution of peas and pea-derived products.
- Consumer Preferences: A growing preference for plant-based protein sources, particularly among health-conscious consumers, drives demand for peas and pea-based products.
Peas Industry Product Developments
Recent years have witnessed significant innovations in pea processing and product development. The industry is witnessing a shift towards creating value-added products, including pea protein isolates, concentrates, and flours, tailored to specific applications. These innovations are driven by technological advancements in extraction and processing techniques, expanding the range of applications for pea-based ingredients in food, feed, and biofuel industries.
Key Drivers of Peas Industry Growth
The growth of the peas industry is driven by a confluence of factors. The increasing global population and rising demand for protein-rich foods are major drivers. Technological advancements in processing and extraction techniques are significantly reducing the cost and increasing the efficiency of pea protein production. Furthermore, government initiatives promoting sustainable agriculture and plant-based diets are creating a favorable environment for industry growth.
Challenges in the Peas Industry Market
The peas industry faces several challenges, including fluctuating raw material prices and supply chain disruptions. Competition from other plant-based protein sources and the need for continuous innovation to meet evolving consumer preferences represent significant challenges. Regulatory hurdles in certain markets can also impede growth. These factors contribute to an estimated xx% decline in profitability in 2024 compared to the peak in 2022.
Emerging Opportunities in Peas Industry
The peas industry is poised for significant long-term growth. Emerging opportunities include the development of novel pea-based ingredients with enhanced functionality, expansion into new geographical markets, and strategic partnerships with food and beverage companies seeking to incorporate pea proteins into their product lines. Further research into the health benefits of pea-based products will contribute to sustained market growth.
Leading Players in the Peas Industry Sector
- Solina Group
- Archer Daniels Midland
- Ingredion Incorporated
- Cargill, Incorporated
- Roquette
Key Milestones in Peas Industry Industry
- March 2022: Birsa Agriculture University (BAU) developed Birsa Matar-1, a new pest and disease-resistant pea variety adaptable to Jharkhand, India's climate.
- September 2022: Agriculture Victoria released high-yielding pea varieties PBA Noosa and PBA Taylor, with PBA Taylor offering resistance to pea seed-borne mosaic and bean leafroll viruses.
- October 2022: Roquette launched a new line of organic pea ingredients (starch and protein) in North America and Europe.
Strategic Outlook for Peas Industry Market
The future of the peas industry looks promising, with significant growth potential driven by increasing consumer demand for plant-based foods and technological advancements. Companies pursuing strategic partnerships, focusing on sustainability, and developing innovative products will be best positioned to capture market share and drive long-term growth. The market is expected to witness significant consolidation, with larger players acquiring smaller companies to expand their product portfolios and geographical reach.
Peas Industry Segmentation
- 1. Production Analysis
- 2. Consumption Analysis
- 3. Import Market Analysis (Value & Volume)
- 4. Export Market Analysis (Value & Volume)
- 5. Price Trend Analysis
Peas Industry Segmentation By Geography
-
1. North America
- 1.1. United States
- 1.2. Canada
-
2. Europe
- 2.1. Russia
- 2.2. United Kingdom
- 2.3. France
- 2.4. Ukraine
-
3. Asia Pacific
- 3.1. China
- 3.2. Australia
- 3.3. India
-
4. South America
- 4.1. Brazil
- 4.2. Argentina
-
5. Africa
- 5.1. South Africa
- 5.2. Egypt
Peas Industry Regional Market Share
Geographic Coverage of Peas Industry
Peas Industry REPORT HIGHLIGHTS
| Aspects | Details |
|---|---|
| Study Period | 2020-2034 |
| Base Year | 2025 |
| Estimated Year | 2026 |
| Forecast Period | 2026-2034 |
| Historical Period | 2020-2025 |
| Growth Rate | CAGR of 4.30% from 2020-2034 |
| Segmentation |
|
Table of Contents
- 1. Introduction
- 1.1. Research Scope
- 1.2. Market Segmentation
- 1.3. Research Objective
- 1.4. Definitions and Assumptions
- 2. Executive Summary
- 2.1. Market Snapshot
- 3. Market Dynamics
- 3.1. Market Drivers
- 3.2. Market Restrains
- 3.3. Market Trends
- 3.4. Market Opportunities
- 4. Market Factor Analysis
- 4.1. Porters Five Forces
- 4.1.1. Bargaining Power of Suppliers
- 4.1.2. Bargaining Power of Buyers
- 4.1.3. Threat of New Entrants
- 4.1.4. Threat of Substitutes
- 4.1.5. Competitive Rivalry
- 4.2. PESTEL analysis
- 4.3. BCG Analysis
- 4.3.1. Stars (High Growth, High Market Share)
- 4.3.2. Cash Cows (Low Growth, High Market Share)
- 4.3.3. Question Mark (High Growth, Low Market Share)
- 4.3.4. Dogs (Low Growth, Low Market Share)
- 4.4. Ansoff Matrix Analysis
- 4.5. Supply Chain Analysis
- 4.6. Regulatory Landscape
- 4.7. Current Market Potential and Opportunity Assessment (TAM–SAM–SOM Framework)
- 4.8. MDP Analyst Note
- 4.1. Porters Five Forces
- 5. Market Analysis, Insights and Forecast 2021-2033
- 5.1. Market Analysis, Insights and Forecast - by Production Analysis
- 5.2. Market Analysis, Insights and Forecast - by Consumption Analysis
- 5.3. Market Analysis, Insights and Forecast - by Import Market Analysis (Value & Volume)
- 5.4. Market Analysis, Insights and Forecast - by Export Market Analysis (Value & Volume)
- 5.5. Market Analysis, Insights and Forecast - by Price Trend Analysis
- 5.6. Market Analysis, Insights and Forecast - by Region
- 5.6.1. North America
- 5.6.2. Europe
- 5.6.3. Asia Pacific
- 5.6.4. South America
- 5.6.5. Africa
- 6. Global Peas Industry Analysis, Insights and Forecast, 2021-2033
- 6.1. Market Analysis, Insights and Forecast - by Production Analysis
- 6.2. Market Analysis, Insights and Forecast - by Consumption Analysis
- 6.3. Market Analysis, Insights and Forecast - by Import Market Analysis (Value & Volume)
- 6.4. Market Analysis, Insights and Forecast - by Export Market Analysis (Value & Volume)
- 6.5. Market Analysis, Insights and Forecast - by Price Trend Analysis
- 7. North America Peas Industry Analysis, Insights and Forecast, 2020-2032
- 7.1. Market Analysis, Insights and Forecast - by Production Analysis
- 7.2. Market Analysis, Insights and Forecast - by Consumption Analysis
- 7.3. Market Analysis, Insights and Forecast - by Import Market Analysis (Value & Volume)
- 7.4. Market Analysis, Insights and Forecast - by Export Market Analysis (Value & Volume)
- 7.5. Market Analysis, Insights and Forecast - by Price Trend Analysis
- 8. Europe Peas Industry Analysis, Insights and Forecast, 2020-2032
- 8.1. Market Analysis, Insights and Forecast - by Production Analysis
- 8.2. Market Analysis, Insights and Forecast - by Consumption Analysis
- 8.3. Market Analysis, Insights and Forecast - by Import Market Analysis (Value & Volume)
- 8.4. Market Analysis, Insights and Forecast - by Export Market Analysis (Value & Volume)
- 8.5. Market Analysis, Insights and Forecast - by Price Trend Analysis
- 9. Asia Pacific Peas Industry Analysis, Insights and Forecast, 2020-2032
- 9.1. Market Analysis, Insights and Forecast - by Production Analysis
- 9.2. Market Analysis, Insights and Forecast - by Consumption Analysis
- 9.3. Market Analysis, Insights and Forecast - by Import Market Analysis (Value & Volume)
- 9.4. Market Analysis, Insights and Forecast - by Export Market Analysis (Value & Volume)
- 9.5. Market Analysis, Insights and Forecast - by Price Trend Analysis
- 10. South America Peas Industry Analysis, Insights and Forecast, 2020-2032
- 10.1. Market Analysis, Insights and Forecast - by Production Analysis
- 10.2. Market Analysis, Insights and Forecast - by Consumption Analysis
- 10.3. Market Analysis, Insights and Forecast - by Import Market Analysis (Value & Volume)
- 10.4. Market Analysis, Insights and Forecast - by Export Market Analysis (Value & Volume)
- 10.5. Market Analysis, Insights and Forecast - by Price Trend Analysis
- 11. Africa Peas Industry Analysis, Insights and Forecast, 2020-2032
- 11.1. Market Analysis, Insights and Forecast - by Production Analysis
- 11.2. Market Analysis, Insights and Forecast - by Consumption Analysis
- 11.3. Market Analysis, Insights and Forecast - by Import Market Analysis (Value & Volume)
- 11.4. Market Analysis, Insights and Forecast - by Export Market Analysis (Value & Volume)
- 11.5. Market Analysis, Insights and Forecast - by Price Trend Analysis
- 12. Competitive Analysis
- 12.1. Company Profiles
- 12.1.1 Solina Group
- 12.1.1.1. Company Overview
- 12.1.1.2. Products
- 12.1.1.3. Company Financials
- 12.1.1.4. SWOT Analysis
- 12.1.2 Archer Daniels Midland
- 12.1.2.1. Company Overview
- 12.1.2.2. Products
- 12.1.2.3. Company Financials
- 12.1.2.4. SWOT Analysis
- 12.1.3 Ingredion
- 12.1.3.1. Company Overview
- 12.1.3.2. Products
- 12.1.3.3. Company Financials
- 12.1.3.4. SWOT Analysis
- 12.1.4 Cargill
- 12.1.4.1. Company Overview
- 12.1.4.2. Products
- 12.1.4.3. Company Financials
- 12.1.4.4. SWOT Analysis
- 12.1.5 Roquette
- 12.1.5.1. Company Overview
- 12.1.5.2. Products
- 12.1.5.3. Company Financials
- 12.1.5.4. SWOT Analysis
- 12.1.1 Solina Group
- 12.2. Market Entropy
- 12.2.1 Company's Key Areas Served
- 12.2.2 Recent Developments
- 12.3. Company Market Share Analysis 2025
- 12.3.1 Top 5 Companies Market Share Analysis
- 12.3.2 Top 3 Companies Market Share Analysis
- 12.4. List of Potential Customers
- 13. Research Methodology
List of Figures
- Figure 1: Global Peas Industry Revenue Breakdown (Million, %) by Region 2025 & 2033
- Figure 2: Global Peas Industry Volume Breakdown (Kiloton, %) by Region 2025 & 2033
- Figure 3: North America Peas Industry Revenue (Million), by Production Analysis 2025 & 2033
- Figure 4: North America Peas Industry Volume (Kiloton), by Production Analysis 2025 & 2033
- Figure 5: North America Peas Industry Revenue Share (%), by Production Analysis 2025 & 2033
- Figure 6: North America Peas Industry Volume Share (%), by Production Analysis 2025 & 2033
- Figure 7: North America Peas Industry Revenue (Million), by Consumption Analysis 2025 & 2033
- Figure 8: North America Peas Industry Volume (Kiloton), by Consumption Analysis 2025 & 2033
- Figure 9: North America Peas Industry Revenue Share (%), by Consumption Analysis 2025 & 2033
- Figure 10: North America Peas Industry Volume Share (%), by Consumption Analysis 2025 & 2033
- Figure 11: North America Peas Industry Revenue (Million), by Import Market Analysis (Value & Volume) 2025 & 2033
- Figure 12: North America Peas Industry Volume (Kiloton), by Import Market Analysis (Value & Volume) 2025 & 2033
- Figure 13: North America Peas Industry Revenue Share (%), by Import Market Analysis (Value & Volume) 2025 & 2033
- Figure 14: North America Peas Industry Volume Share (%), by Import Market Analysis (Value & Volume) 2025 & 2033
- Figure 15: North America Peas Industry Revenue (Million), by Export Market Analysis (Value & Volume) 2025 & 2033
- Figure 16: North America Peas Industry Volume (Kiloton), by Export Market Analysis (Value & Volume) 2025 & 2033
- Figure 17: North America Peas Industry Revenue Share (%), by Export Market Analysis (Value & Volume) 2025 & 2033
- Figure 18: North America Peas Industry Volume Share (%), by Export Market Analysis (Value & Volume) 2025 & 2033
- Figure 19: North America Peas Industry Revenue (Million), by Price Trend Analysis 2025 & 2033
- Figure 20: North America Peas Industry Volume (Kiloton), by Price Trend Analysis 2025 & 2033
- Figure 21: North America Peas Industry Revenue Share (%), by Price Trend Analysis 2025 & 2033
- Figure 22: North America Peas Industry Volume Share (%), by Price Trend Analysis 2025 & 2033
- Figure 23: North America Peas Industry Revenue (Million), by Country 2025 & 2033
- Figure 24: North America Peas Industry Volume (Kiloton), by Country 2025 & 2033
- Figure 25: North America Peas Industry Revenue Share (%), by Country 2025 & 2033
- Figure 26: North America Peas Industry Volume Share (%), by Country 2025 & 2033
- Figure 27: Europe Peas Industry Revenue (Million), by Production Analysis 2025 & 2033
- Figure 28: Europe Peas Industry Volume (Kiloton), by Production Analysis 2025 & 2033
- Figure 29: Europe Peas Industry Revenue Share (%), by Production Analysis 2025 & 2033
- Figure 30: Europe Peas Industry Volume Share (%), by Production Analysis 2025 & 2033
- Figure 31: Europe Peas Industry Revenue (Million), by Consumption Analysis 2025 & 2033
- Figure 32: Europe Peas Industry Volume (Kiloton), by Consumption Analysis 2025 & 2033
- Figure 33: Europe Peas Industry Revenue Share (%), by Consumption Analysis 2025 & 2033
- Figure 34: Europe Peas Industry Volume Share (%), by Consumption Analysis 2025 & 2033
- Figure 35: Europe Peas Industry Revenue (Million), by Import Market Analysis (Value & Volume) 2025 & 2033
- Figure 36: Europe Peas Industry Volume (Kiloton), by Import Market Analysis (Value & Volume) 2025 & 2033
- Figure 37: Europe Peas Industry Revenue Share (%), by Import Market Analysis (Value & Volume) 2025 & 2033
- Figure 38: Europe Peas Industry Volume Share (%), by Import Market Analysis (Value & Volume) 2025 & 2033
- Figure 39: Europe Peas Industry Revenue (Million), by Export Market Analysis (Value & Volume) 2025 & 2033
- Figure 40: Europe Peas Industry Volume (Kiloton), by Export Market Analysis (Value & Volume) 2025 & 2033
- Figure 41: Europe Peas Industry Revenue Share (%), by Export Market Analysis (Value & Volume) 2025 & 2033
- Figure 42: Europe Peas Industry Volume Share (%), by Export Market Analysis (Value & Volume) 2025 & 2033
- Figure 43: Europe Peas Industry Revenue (Million), by Price Trend Analysis 2025 & 2033
- Figure 44: Europe Peas Industry Volume (Kiloton), by Price Trend Analysis 2025 & 2033
- Figure 45: Europe Peas Industry Revenue Share (%), by Price Trend Analysis 2025 & 2033
- Figure 46: Europe Peas Industry Volume Share (%), by Price Trend Analysis 2025 & 2033
- Figure 47: Europe Peas Industry Revenue (Million), by Country 2025 & 2033
- Figure 48: Europe Peas Industry Volume (Kiloton), by Country 2025 & 2033
- Figure 49: Europe Peas Industry Revenue Share (%), by Country 2025 & 2033
- Figure 50: Europe Peas Industry Volume Share (%), by Country 2025 & 2033
- Figure 51: Asia Pacific Peas Industry Revenue (Million), by Production Analysis 2025 & 2033
- Figure 52: Asia Pacific Peas Industry Volume (Kiloton), by Production Analysis 2025 & 2033
- Figure 53: Asia Pacific Peas Industry Revenue Share (%), by Production Analysis 2025 & 2033
- Figure 54: Asia Pacific Peas Industry Volume Share (%), by Production Analysis 2025 & 2033
- Figure 55: Asia Pacific Peas Industry Revenue (Million), by Consumption Analysis 2025 & 2033
- Figure 56: Asia Pacific Peas Industry Volume (Kiloton), by Consumption Analysis 2025 & 2033
- Figure 57: Asia Pacific Peas Industry Revenue Share (%), by Consumption Analysis 2025 & 2033
- Figure 58: Asia Pacific Peas Industry Volume Share (%), by Consumption Analysis 2025 & 2033
- Figure 59: Asia Pacific Peas Industry Revenue (Million), by Import Market Analysis (Value & Volume) 2025 & 2033
- Figure 60: Asia Pacific Peas Industry Volume (Kiloton), by Import Market Analysis (Value & Volume) 2025 & 2033
- Figure 61: Asia Pacific Peas Industry Revenue Share (%), by Import Market Analysis (Value & Volume) 2025 & 2033
- Figure 62: Asia Pacific Peas Industry Volume Share (%), by Import Market Analysis (Value & Volume) 2025 & 2033
- Figure 63: Asia Pacific Peas Industry Revenue (Million), by Export Market Analysis (Value & Volume) 2025 & 2033
- Figure 64: Asia Pacific Peas Industry Volume (Kiloton), by Export Market Analysis (Value & Volume) 2025 & 2033
- Figure 65: Asia Pacific Peas Industry Revenue Share (%), by Export Market Analysis (Value & Volume) 2025 & 2033
- Figure 66: Asia Pacific Peas Industry Volume Share (%), by Export Market Analysis (Value & Volume) 2025 & 2033
- Figure 67: Asia Pacific Peas Industry Revenue (Million), by Price Trend Analysis 2025 & 2033
- Figure 68: Asia Pacific Peas Industry Volume (Kiloton), by Price Trend Analysis 2025 & 2033
- Figure 69: Asia Pacific Peas Industry Revenue Share (%), by Price Trend Analysis 2025 & 2033
- Figure 70: Asia Pacific Peas Industry Volume Share (%), by Price Trend Analysis 2025 & 2033
- Figure 71: Asia Pacific Peas Industry Revenue (Million), by Country 2025 & 2033
- Figure 72: Asia Pacific Peas Industry Volume (Kiloton), by Country 2025 & 2033
- Figure 73: Asia Pacific Peas Industry Revenue Share (%), by Country 2025 & 2033
- Figure 74: Asia Pacific Peas Industry Volume Share (%), by Country 2025 & 2033
- Figure 75: South America Peas Industry Revenue (Million), by Production Analysis 2025 & 2033
- Figure 76: South America Peas Industry Volume (Kiloton), by Production Analysis 2025 & 2033
- Figure 77: South America Peas Industry Revenue Share (%), by Production Analysis 2025 & 2033
- Figure 78: South America Peas Industry Volume Share (%), by Production Analysis 2025 & 2033
- Figure 79: South America Peas Industry Revenue (Million), by Consumption Analysis 2025 & 2033
- Figure 80: South America Peas Industry Volume (Kiloton), by Consumption Analysis 2025 & 2033
- Figure 81: South America Peas Industry Revenue Share (%), by Consumption Analysis 2025 & 2033
- Figure 82: South America Peas Industry Volume Share (%), by Consumption Analysis 2025 & 2033
- Figure 83: South America Peas Industry Revenue (Million), by Import Market Analysis (Value & Volume) 2025 & 2033
- Figure 84: South America Peas Industry Volume (Kiloton), by Import Market Analysis (Value & Volume) 2025 & 2033
- Figure 85: South America Peas Industry Revenue Share (%), by Import Market Analysis (Value & Volume) 2025 & 2033
- Figure 86: South America Peas Industry Volume Share (%), by Import Market Analysis (Value & Volume) 2025 & 2033
- Figure 87: South America Peas Industry Revenue (Million), by Export Market Analysis (Value & Volume) 2025 & 2033
- Figure 88: South America Peas Industry Volume (Kiloton), by Export Market Analysis (Value & Volume) 2025 & 2033
- Figure 89: South America Peas Industry Revenue Share (%), by Export Market Analysis (Value & Volume) 2025 & 2033
- Figure 90: South America Peas Industry Volume Share (%), by Export Market Analysis (Value & Volume) 2025 & 2033
- Figure 91: South America Peas Industry Revenue (Million), by Price Trend Analysis 2025 & 2033
- Figure 92: South America Peas Industry Volume (Kiloton), by Price Trend Analysis 2025 & 2033
- Figure 93: South America Peas Industry Revenue Share (%), by Price Trend Analysis 2025 & 2033
- Figure 94: South America Peas Industry Volume Share (%), by Price Trend Analysis 2025 & 2033
- Figure 95: South America Peas Industry Revenue (Million), by Country 2025 & 2033
- Figure 96: South America Peas Industry Volume (Kiloton), by Country 2025 & 2033
- Figure 97: South America Peas Industry Revenue Share (%), by Country 2025 & 2033
- Figure 98: South America Peas Industry Volume Share (%), by Country 2025 & 2033
- Figure 99: Africa Peas Industry Revenue (Million), by Production Analysis 2025 & 2033
- Figure 100: Africa Peas Industry Volume (Kiloton), by Production Analysis 2025 & 2033
- Figure 101: Africa Peas Industry Revenue Share (%), by Production Analysis 2025 & 2033
- Figure 102: Africa Peas Industry Volume Share (%), by Production Analysis 2025 & 2033
- Figure 103: Africa Peas Industry Revenue (Million), by Consumption Analysis 2025 & 2033
- Figure 104: Africa Peas Industry Volume (Kiloton), by Consumption Analysis 2025 & 2033
- Figure 105: Africa Peas Industry Revenue Share (%), by Consumption Analysis 2025 & 2033
- Figure 106: Africa Peas Industry Volume Share (%), by Consumption Analysis 2025 & 2033
- Figure 107: Africa Peas Industry Revenue (Million), by Import Market Analysis (Value & Volume) 2025 & 2033
- Figure 108: Africa Peas Industry Volume (Kiloton), by Import Market Analysis (Value & Volume) 2025 & 2033
- Figure 109: Africa Peas Industry Revenue Share (%), by Import Market Analysis (Value & Volume) 2025 & 2033
- Figure 110: Africa Peas Industry Volume Share (%), by Import Market Analysis (Value & Volume) 2025 & 2033
- Figure 111: Africa Peas Industry Revenue (Million), by Export Market Analysis (Value & Volume) 2025 & 2033
- Figure 112: Africa Peas Industry Volume (Kiloton), by Export Market Analysis (Value & Volume) 2025 & 2033
- Figure 113: Africa Peas Industry Revenue Share (%), by Export Market Analysis (Value & Volume) 2025 & 2033
- Figure 114: Africa Peas Industry Volume Share (%), by Export Market Analysis (Value & Volume) 2025 & 2033
- Figure 115: Africa Peas Industry Revenue (Million), by Price Trend Analysis 2025 & 2033
- Figure 116: Africa Peas Industry Volume (Kiloton), by Price Trend Analysis 2025 & 2033
- Figure 117: Africa Peas Industry Revenue Share (%), by Price Trend Analysis 2025 & 2033
- Figure 118: Africa Peas Industry Volume Share (%), by Price Trend Analysis 2025 & 2033
- Figure 119: Africa Peas Industry Revenue (Million), by Country 2025 & 2033
- Figure 120: Africa Peas Industry Volume (Kiloton), by Country 2025 & 2033
- Figure 121: Africa Peas Industry Revenue Share (%), by Country 2025 & 2033
- Figure 122: Africa Peas Industry Volume Share (%), by Country 2025 & 2033
List of Tables
- Table 1: Global Peas Industry Revenue Million Forecast, by Production Analysis 2020 & 2033
- Table 2: Global Peas Industry Volume Kiloton Forecast, by Production Analysis 2020 & 2033
- Table 3: Global Peas Industry Revenue Million Forecast, by Consumption Analysis 2020 & 2033
- Table 4: Global Peas Industry Volume Kiloton Forecast, by Consumption Analysis 2020 & 2033
- Table 5: Global Peas Industry Revenue Million Forecast, by Import Market Analysis (Value & Volume) 2020 & 2033
- Table 6: Global Peas Industry Volume Kiloton Forecast, by Import Market Analysis (Value & Volume) 2020 & 2033
- Table 7: Global Peas Industry Revenue Million Forecast, by Export Market Analysis (Value & Volume) 2020 & 2033
- Table 8: Global Peas Industry Volume Kiloton Forecast, by Export Market Analysis (Value & Volume) 2020 & 2033
- Table 9: Global Peas Industry Revenue Million Forecast, by Price Trend Analysis 2020 & 2033
- Table 10: Global Peas Industry Volume Kiloton Forecast, by Price Trend Analysis 2020 & 2033
- Table 11: Global Peas Industry Revenue Million Forecast, by Region 2020 & 2033
- Table 12: Global Peas Industry Volume Kiloton Forecast, by Region 2020 & 2033
- Table 13: Global Peas Industry Revenue Million Forecast, by Production Analysis 2020 & 2033
- Table 14: Global Peas Industry Volume Kiloton Forecast, by Production Analysis 2020 & 2033
- Table 15: Global Peas Industry Revenue Million Forecast, by Consumption Analysis 2020 & 2033
- Table 16: Global Peas Industry Volume Kiloton Forecast, by Consumption Analysis 2020 & 2033
- Table 17: Global Peas Industry Revenue Million Forecast, by Import Market Analysis (Value & Volume) 2020 & 2033
- Table 18: Global Peas Industry Volume Kiloton Forecast, by Import Market Analysis (Value & Volume) 2020 & 2033
- Table 19: Global Peas Industry Revenue Million Forecast, by Export Market Analysis (Value & Volume) 2020 & 2033
- Table 20: Global Peas Industry Volume Kiloton Forecast, by Export Market Analysis (Value & Volume) 2020 & 2033
- Table 21: Global Peas Industry Revenue Million Forecast, by Price Trend Analysis 2020 & 2033
- Table 22: Global Peas Industry Volume Kiloton Forecast, by Price Trend Analysis 2020 & 2033
- Table 23: Global Peas Industry Revenue Million Forecast, by Country 2020 & 2033
- Table 24: Global Peas Industry Volume Kiloton Forecast, by Country 2020 & 2033
- Table 25: United States Peas Industry Revenue (Million) Forecast, by Application 2020 & 2033
- Table 26: United States Peas Industry Volume (Kiloton) Forecast, by Application 2020 & 2033
- Table 27: Canada Peas Industry Revenue (Million) Forecast, by Application 2020 & 2033
- Table 28: Canada Peas Industry Volume (Kiloton) Forecast, by Application 2020 & 2033
- Table 29: Global Peas Industry Revenue Million Forecast, by Production Analysis 2020 & 2033
- Table 30: Global Peas Industry Volume Kiloton Forecast, by Production Analysis 2020 & 2033
- Table 31: Global Peas Industry Revenue Million Forecast, by Consumption Analysis 2020 & 2033
- Table 32: Global Peas Industry Volume Kiloton Forecast, by Consumption Analysis 2020 & 2033
- Table 33: Global Peas Industry Revenue Million Forecast, by Import Market Analysis (Value & Volume) 2020 & 2033
- Table 34: Global Peas Industry Volume Kiloton Forecast, by Import Market Analysis (Value & Volume) 2020 & 2033
- Table 35: Global Peas Industry Revenue Million Forecast, by Export Market Analysis (Value & Volume) 2020 & 2033
- Table 36: Global Peas Industry Volume Kiloton Forecast, by Export Market Analysis (Value & Volume) 2020 & 2033
- Table 37: Global Peas Industry Revenue Million Forecast, by Price Trend Analysis 2020 & 2033
- Table 38: Global Peas Industry Volume Kiloton Forecast, by Price Trend Analysis 2020 & 2033
- Table 39: Global Peas Industry Revenue Million Forecast, by Country 2020 & 2033
- Table 40: Global Peas Industry Volume Kiloton Forecast, by Country 2020 & 2033
- Table 41: Russia Peas Industry Revenue (Million) Forecast, by Application 2020 & 2033
- Table 42: Russia Peas Industry Volume (Kiloton) Forecast, by Application 2020 & 2033
- Table 43: United Kingdom Peas Industry Revenue (Million) Forecast, by Application 2020 & 2033
- Table 44: United Kingdom Peas Industry Volume (Kiloton) Forecast, by Application 2020 & 2033
- Table 45: France Peas Industry Revenue (Million) Forecast, by Application 2020 & 2033
- Table 46: France Peas Industry Volume (Kiloton) Forecast, by Application 2020 & 2033
- Table 47: Ukraine Peas Industry Revenue (Million) Forecast, by Application 2020 & 2033
- Table 48: Ukraine Peas Industry Volume (Kiloton) Forecast, by Application 2020 & 2033
- Table 49: Global Peas Industry Revenue Million Forecast, by Production Analysis 2020 & 2033
- Table 50: Global Peas Industry Volume Kiloton Forecast, by Production Analysis 2020 & 2033
- Table 51: Global Peas Industry Revenue Million Forecast, by Consumption Analysis 2020 & 2033
- Table 52: Global Peas Industry Volume Kiloton Forecast, by Consumption Analysis 2020 & 2033
- Table 53: Global Peas Industry Revenue Million Forecast, by Import Market Analysis (Value & Volume) 2020 & 2033
- Table 54: Global Peas Industry Volume Kiloton Forecast, by Import Market Analysis (Value & Volume) 2020 & 2033
- Table 55: Global Peas Industry Revenue Million Forecast, by Export Market Analysis (Value & Volume) 2020 & 2033
- Table 56: Global Peas Industry Volume Kiloton Forecast, by Export Market Analysis (Value & Volume) 2020 & 2033
- Table 57: Global Peas Industry Revenue Million Forecast, by Price Trend Analysis 2020 & 2033
- Table 58: Global Peas Industry Volume Kiloton Forecast, by Price Trend Analysis 2020 & 2033
- Table 59: Global Peas Industry Revenue Million Forecast, by Country 2020 & 2033
- Table 60: Global Peas Industry Volume Kiloton Forecast, by Country 2020 & 2033
- Table 61: China Peas Industry Revenue (Million) Forecast, by Application 2020 & 2033
- Table 62: China Peas Industry Volume (Kiloton) Forecast, by Application 2020 & 2033
- Table 63: Australia Peas Industry Revenue (Million) Forecast, by Application 2020 & 2033
- Table 64: Australia Peas Industry Volume (Kiloton) Forecast, by Application 2020 & 2033
- Table 65: India Peas Industry Revenue (Million) Forecast, by Application 2020 & 2033
- Table 66: India Peas Industry Volume (Kiloton) Forecast, by Application 2020 & 2033
- Table 67: Global Peas Industry Revenue Million Forecast, by Production Analysis 2020 & 2033
- Table 68: Global Peas Industry Volume Kiloton Forecast, by Production Analysis 2020 & 2033
- Table 69: Global Peas Industry Revenue Million Forecast, by Consumption Analysis 2020 & 2033
- Table 70: Global Peas Industry Volume Kiloton Forecast, by Consumption Analysis 2020 & 2033
- Table 71: Global Peas Industry Revenue Million Forecast, by Import Market Analysis (Value & Volume) 2020 & 2033
- Table 72: Global Peas Industry Volume Kiloton Forecast, by Import Market Analysis (Value & Volume) 2020 & 2033
- Table 73: Global Peas Industry Revenue Million Forecast, by Export Market Analysis (Value & Volume) 2020 & 2033
- Table 74: Global Peas Industry Volume Kiloton Forecast, by Export Market Analysis (Value & Volume) 2020 & 2033
- Table 75: Global Peas Industry Revenue Million Forecast, by Price Trend Analysis 2020 & 2033
- Table 76: Global Peas Industry Volume Kiloton Forecast, by Price Trend Analysis 2020 & 2033
- Table 77: Global Peas Industry Revenue Million Forecast, by Country 2020 & 2033
- Table 78: Global Peas Industry Volume Kiloton Forecast, by Country 2020 & 2033
- Table 79: Brazil Peas Industry Revenue (Million) Forecast, by Application 2020 & 2033
- Table 80: Brazil Peas Industry Volume (Kiloton) Forecast, by Application 2020 & 2033
- Table 81: Argentina Peas Industry Revenue (Million) Forecast, by Application 2020 & 2033
- Table 82: Argentina Peas Industry Volume (Kiloton) Forecast, by Application 2020 & 2033
- Table 83: Global Peas Industry Revenue Million Forecast, by Production Analysis 2020 & 2033
- Table 84: Global Peas Industry Volume Kiloton Forecast, by Production Analysis 2020 & 2033
- Table 85: Global Peas Industry Revenue Million Forecast, by Consumption Analysis 2020 & 2033
- Table 86: Global Peas Industry Volume Kiloton Forecast, by Consumption Analysis 2020 & 2033
- Table 87: Global Peas Industry Revenue Million Forecast, by Import Market Analysis (Value & Volume) 2020 & 2033
- Table 88: Global Peas Industry Volume Kiloton Forecast, by Import Market Analysis (Value & Volume) 2020 & 2033
- Table 89: Global Peas Industry Revenue Million Forecast, by Export Market Analysis (Value & Volume) 2020 & 2033
- Table 90: Global Peas Industry Volume Kiloton Forecast, by Export Market Analysis (Value & Volume) 2020 & 2033
- Table 91: Global Peas Industry Revenue Million Forecast, by Price Trend Analysis 2020 & 2033
- Table 92: Global Peas Industry Volume Kiloton Forecast, by Price Trend Analysis 2020 & 2033
- Table 93: Global Peas Industry Revenue Million Forecast, by Country 2020 & 2033
- Table 94: Global Peas Industry Volume Kiloton Forecast, by Country 2020 & 2033
- Table 95: South Africa Peas Industry Revenue (Million) Forecast, by Application 2020 & 2033
- Table 96: South Africa Peas Industry Volume (Kiloton) Forecast, by Application 2020 & 2033
- Table 97: Egypt Peas Industry Revenue (Million) Forecast, by Application 2020 & 2033
- Table 98: Egypt Peas Industry Volume (Kiloton) Forecast, by Application 2020 & 2033
Frequently Asked Questions
1. What is the projected Compound Annual Growth Rate (CAGR) of the Peas Industry?
The projected CAGR is approximately 4.30%.
2. Which companies are prominent players in the Peas Industry?
Key companies in the market include Solina Group, Archer Daniels Midland, Ingredion, Cargill , Roquette .
3. What are the main segments of the Peas Industry?
The market segments include Production Analysis, Consumption Analysis, Import Market Analysis (Value & Volume), Export Market Analysis (Value & Volume), Price Trend Analysis.
4. Can you provide details about the market size?
The market size is estimated to be USD XXX Million as of 2022.
5. What are some drivers contributing to market growth?
Rising Consumption of Cashew Nuts in the Country; Favorable Government Initiatives.
6. What are the notable trends driving market growth?
Growing Demand for Pea Protein Consumption.
7. Are there any restraints impacting market growth?
Hazardous Climatic Condition Hinders Cashew Production; Stringent Regulations Related to Food Quality Standards.
8. Can you provide examples of recent developments in the market?
October 2022: Roquette, a global leader in plant-based ingredients and a pioneer of plant proteins, launched a new line of organic pea ingredients, organic pea starch, and organic pea protein in the North American and Europe markets to meet customer demand.
9. What pricing options are available for accessing the report?
Pricing options include single-user, multi-user, and enterprise licenses priced at USD 4750, USD 5250, and USD 8750 respectively.
10. Is the market size provided in terms of value or volume?
The market size is provided in terms of value, measured in Million and volume, measured in Kiloton.
11. Are there any specific market keywords associated with the report?
Yes, the market keyword associated with the report is "Peas Industry," which aids in identifying and referencing the specific market segment covered.
12. How do I determine which pricing option suits my needs best?
The pricing options vary based on user requirements and access needs. Individual users may opt for single-user licenses, while businesses requiring broader access may choose multi-user or enterprise licenses for cost-effective access to the report.
13. Are there any additional resources or data provided in the Peas Industry report?
While the report offers comprehensive insights, it's advisable to review the specific contents or supplementary materials provided to ascertain if additional resources or data are available.
14. How can I stay updated on further developments or reports in the Peas Industry?
To stay informed about further developments, trends, and reports in the Peas Industry, consider subscribing to industry newsletters, following relevant companies and organizations, or regularly checking reputable industry news sources and publications.
Methodology
Step 1 - Identification of Relevant Samples Size from Population Database


Step 2 - Approaches for Defining Global Market Size (Value, Volume* & Price*)

Note*: In applicable scenarios
Step 3 - Data Sources
Primary Research
- Web Analytics
- Survey Reports
- Research Institute
- Latest Research Reports
- Opinion Leaders
Secondary Research
- Annual Reports
- White Paper
- Latest Press Release
- Industry Association
- Paid Database
- Investor Presentations

Step 4 - Data Triangulation
Involves using different sources of information in order to increase the validity of a study
These sources are likely to be stakeholders in a program - participants, other researchers, program staff, other community members, and so on.
Then we put all data in single framework & apply various statistical tools to find out the dynamic on the market.
During the analysis stage, feedback from the stakeholder groups would be compared to determine areas of agreement as well as areas of divergence