

Key Insights
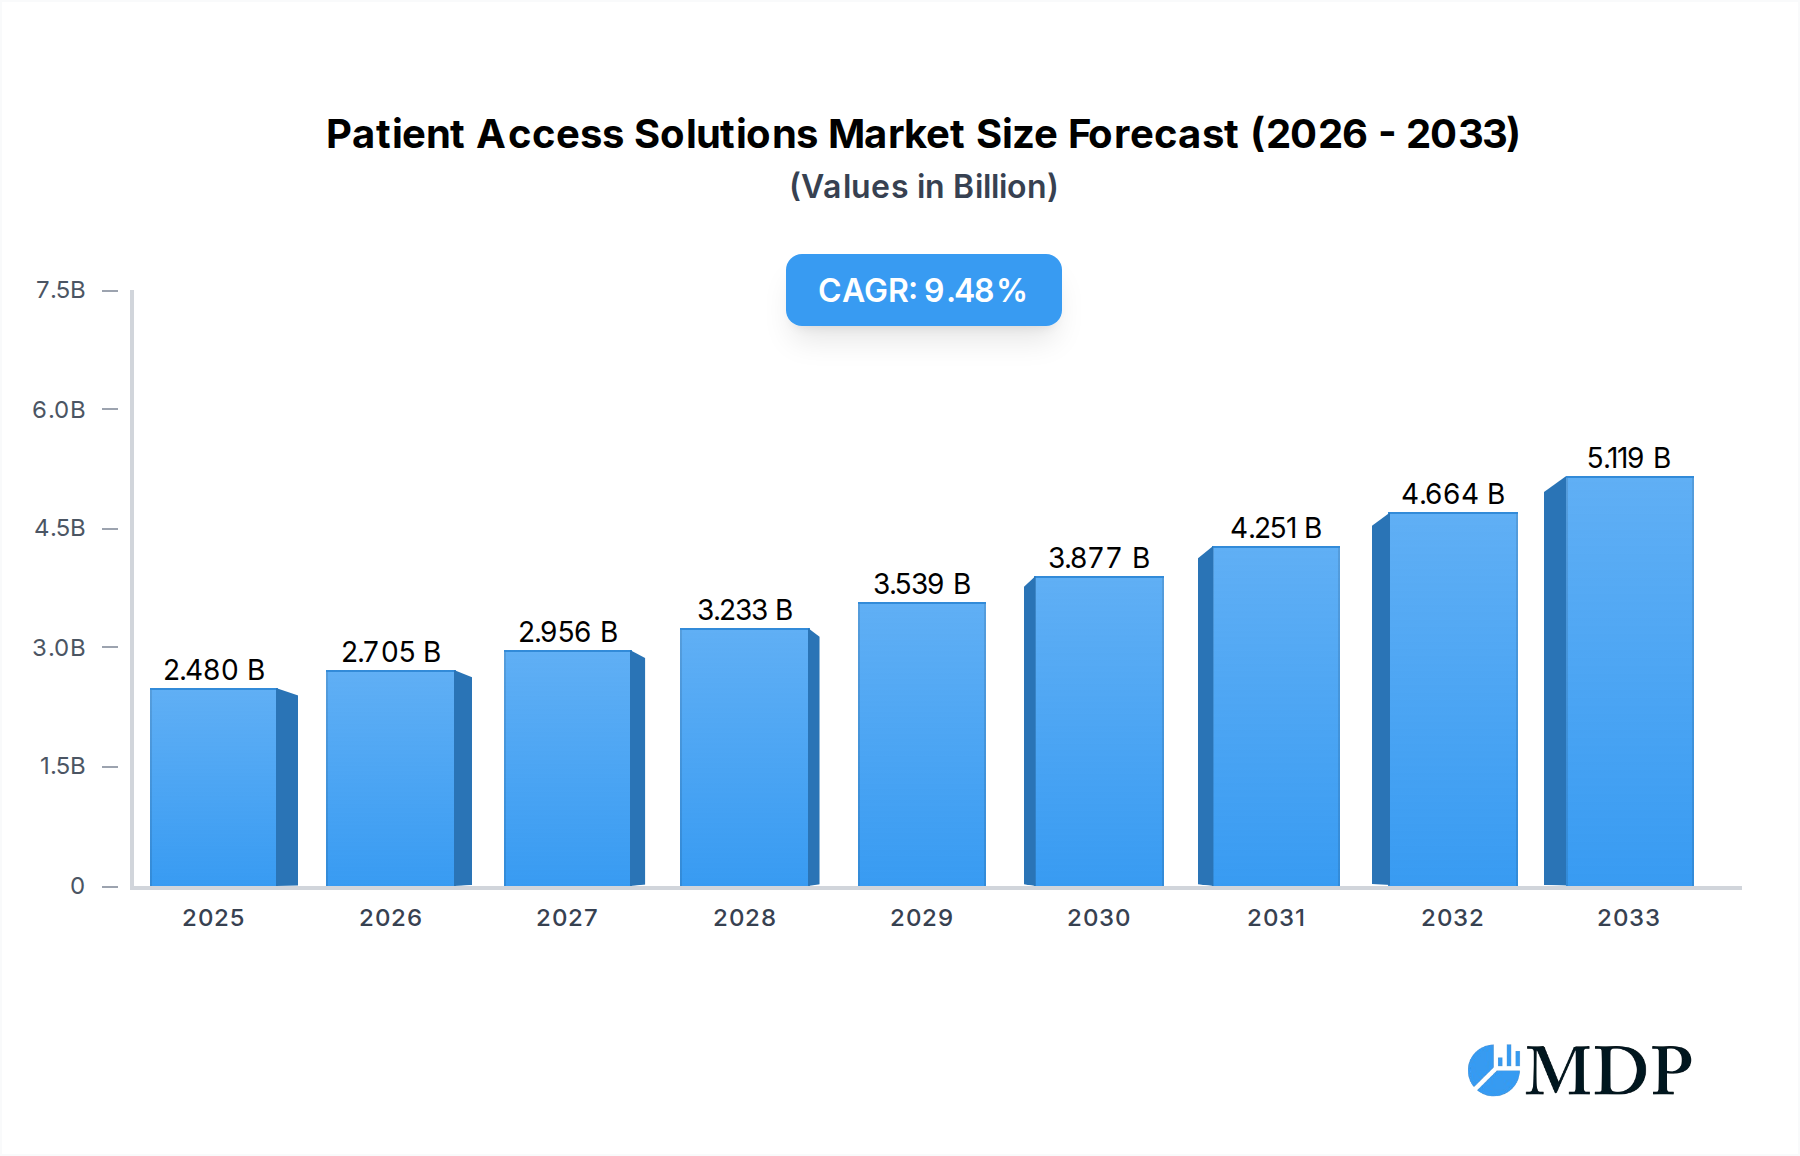
The global Patient Access Solutions market is poised for substantial growth, projected to reach $2.48 billion in 2025. This expansion is driven by a robust CAGR of 9.1% through 2033, indicating a dynamic and evolving landscape. A primary catalyst for this growth is the increasing demand for streamlined healthcare workflows and improved patient experiences. Healthcare providers, hospitals, and clinics are increasingly adopting web-based and cloud-based patient access solutions to enhance efficiency in patient registration, scheduling, eligibility verification, and financial counseling. These solutions are instrumental in reducing administrative burdens, minimizing claim denials, and ultimately improving revenue cycles for healthcare organizations. The growing emphasis on patient-centric care and the need for seamless pre-visit and post-visit interactions further underscore the importance of these technologies.

Patient Access Solutions Market Size (In Billion)
The market's expansion is further fueled by technological advancements, including the integration of AI and machine learning for predictive analytics in patient flow and resource allocation. The shift towards value-based care models necessitates greater efficiency and transparency in patient access processes, making these solutions indispensable. While the market demonstrates strong growth potential, certain factors could influence its trajectory. These include the initial implementation costs and the need for robust cybersecurity measures to protect sensitive patient data. However, the undeniable benefits in terms of operational efficiency, enhanced patient satisfaction, and improved financial outcomes are expected to outweigh these challenges, propelling the Patient Access Solutions market forward. Leading companies are actively investing in innovative solutions to cater to the diverse needs of healthcare providers across various segments.
Patient Access Solutions Company Market Share
Unlocking Seamless Healthcare Journeys: Patient Access Solutions Market Report (2019-2033)
This comprehensive report delves into the dynamic patient access solutions market, a critical sector poised for significant expansion as healthcare organizations worldwide strive for enhanced patient experience, operational efficiency, and revenue cycle optimization. Valued in the billions, the market is segmented by application, including healthcare providers, hospitals, clinics, and others, and by type, encompassing web-based and cloud-based solutions. This in-depth analysis, covering the study period of 2019–2033 with a base year of 2025, provides actionable insights for stakeholders, from technology providers and healthcare administrators to investors and policymakers.
Patient Access Solutions Market Dynamics & Concentration
The patient access solutions market exhibits moderate to high concentration, driven by the strategic investments and expansive portfolios of key players. Innovation serves as a primary driver, with companies continuously developing advanced functionalities such as AI-powered appointment scheduling, intelligent eligibility verification, and automated pre-authorization processes. Regulatory frameworks, particularly those focused on patient data privacy (e.g., HIPAA) and interoperability standards, shape market entry and product development, encouraging compliance and secure data exchange. Product substitutes, while present in the form of manual processes or fragmented legacy systems, are increasingly being displaced by integrated digital solutions. End-user trends underscore a growing demand for self-service options, personalized patient communication, and streamlined financial clearance. Mergers and acquisitions (M&A) are prevalent, indicating a consolidation phase where larger entities acquire innovative startups to broaden their service offerings and market reach. For instance, recent M&A activity indicates a substantial number of deals, with total transaction values in the billions. Market share is predominantly held by leading providers, with the top five companies accounting for an estimated 70% of the global market share.
Patient Access Solutions Industry Trends & Analysis
The patient access solutions market is experiencing robust growth, fueled by an escalating demand for efficient and patient-centric healthcare delivery models. The Compound Annual Growth Rate (CAGR) for this sector is projected to be a significant XX% over the forecast period of 2025–2033. Technological disruptions, including the widespread adoption of artificial intelligence (AI), machine learning (ML), and cloud computing, are revolutionizing patient access workflows. These technologies enable predictive analytics for appointment no-shows, real-time eligibility checks, and personalized patient engagement strategies, significantly improving operational efficiency for healthcare providers. Consumer preferences are shifting towards digital-first healthcare experiences, with patients expecting seamless online appointment booking, convenient payment options, and proactive communication regarding their care journey. This has led to a surge in demand for user-friendly web-based and cloud-based patient access platforms. The competitive landscape is intensifying, with established giants like McKesson, Epic Systems, Cerner, Cognizant, Experian, 3M, Conifer Health, and Optum vying for market dominance against agile innovators. Market penetration of advanced patient access solutions is rapidly increasing across all segments, with an estimated XX% of hospitals and clinics now utilizing integrated digital platforms. The ongoing digital transformation within the healthcare industry, coupled with increasing healthcare expenditure and a growing emphasis on patient satisfaction, positions the patient access solutions market for sustained and substantial expansion. Industry developments, such as the increasing focus on value-based care, further propel the adoption of solutions that demonstrably improve patient outcomes and reduce administrative costs. The evolving regulatory environment, pushing for greater data interoperability and patient access to their health information, also acts as a significant growth catalyst.
Leading Markets & Segments in Patient Access Solutions
The patient access solutions market is experiencing dominant growth and adoption across North America, driven by its advanced healthcare infrastructure, high adoption rate of digital health technologies, and a strong emphasis on patient experience. Within this region, the Hospital segment represents the largest market share, accounting for approximately 60% of the total market value.
Dominant Region: North America
- Economic Policies: Favorable government initiatives and reimbursement models incentivize the adoption of innovative healthcare technologies, including patient access solutions.
- Infrastructure: A well-established digital healthcare ecosystem, characterized by widespread EHR adoption and robust internet connectivity, facilitates the seamless integration and deployment of web-based and cloud-based solutions.
- Technological Advancement: Early and rapid adoption of cutting-edge technologies like AI and ML in healthcare workflows drives the demand for sophisticated patient access tools.
- Patient Expectations: High consumer expectations for convenient and personalized healthcare services push providers to invest in solutions that streamline the patient journey.
Dominant Segment: Hospitals
- Complexity of Operations: Hospitals, with their large patient volumes, complex scheduling needs, and intricate billing processes, benefit immensely from comprehensive patient access solutions that automate and optimize these workflows.
- Revenue Cycle Management: Effective patient access solutions directly impact revenue cycle management by reducing claim denials, improving upfront collections, and minimizing patient financial distress.
- Regulatory Compliance: Hospitals are under increasing pressure to comply with stringent regulatory requirements related to patient registration, consent management, and data security, which integrated access solutions help address.
- Integration Capabilities: The ability of patient access solutions to integrate with existing Electronic Health Record (EHR) systems and other hospital information systems is crucial, and hospitals often have the resources and IT infrastructure to facilitate these integrations.
Type: Cloud-Based Solutions
- Scalability and Flexibility: Cloud-based solutions offer unparalleled scalability, allowing healthcare providers to adapt to fluctuating patient volumes and evolving needs without significant upfront hardware investments.
- Cost-Effectiveness: The subscription-based model of cloud solutions often proves more cost-effective than traditional on-premise systems, especially for smaller clinics and emerging healthcare entities.
- Accessibility: Cloud-based platforms enable secure access to patient data and functionalities from any location with an internet connection, enhancing remote work capabilities for healthcare staff and improving patient convenience.
- Automatic Updates and Maintenance: Vendors manage updates and maintenance for cloud solutions, reducing the IT burden on healthcare organizations and ensuring access to the latest features and security patches.
The Clinic segment also presents significant growth potential, driven by the increasing prevalence of outpatient care and the need for efficient patient management in smaller healthcare settings. "Others," encompassing various healthcare facilities and emerging care models, represent a rapidly growing niche as well.
Patient Access Solutions Product Developments
Product innovations in the patient access solutions market are rapidly evolving, focusing on enhancing user experience and operational efficiency. Key developments include AI-driven chatbots for initial patient inquiries and appointment scheduling, intelligent eligibility verification systems that provide real-time insurance status and estimated patient responsibility, and advanced pre-authorization tools that automate the cumbersome approval process. These advancements offer significant competitive advantages by reducing administrative overhead, minimizing claim denials, and improving patient satisfaction. Furthermore, the integration of patient portals with mobile applications and telehealth platforms is creating a more unified and accessible patient journey, reflecting the growing trend towards digital health engagement and personalized care.
Key Drivers of Patient Access Solutions Growth
Several key drivers are propelling the growth of the patient access solutions market. Technologically, the widespread adoption of AI and ML is enabling more sophisticated automation in scheduling, eligibility verification, and patient communication. Economically, increasing healthcare expenditures and the growing emphasis on revenue cycle management are pushing providers to invest in solutions that optimize financial performance and reduce administrative costs. Regulatory factors, such as mandates for interoperability and patient data access, further encourage the adoption of integrated digital platforms. The shift towards value-based care models also incentivizes the use of patient access solutions that demonstrably improve patient outcomes and satisfaction while controlling costs.
Challenges in the Patient Access Solutions Market
Despite the robust growth, the patient access solutions market faces several challenges. Regulatory hurdles, particularly concerning data privacy and security compliance across different jurisdictions, can complicate implementation and integration. Supply chain issues, though less pronounced for software solutions, can impact the integration of hardware components or third-party services. Competitive pressures from both established players and new entrants necessitate continuous innovation and aggressive pricing strategies. Furthermore, the significant upfront investment required for some comprehensive solutions can be a barrier for smaller healthcare providers, and the integration with legacy IT systems within existing healthcare organizations often presents technical complexities and requires substantial IT resources.
Emerging Opportunities in Patient Access Solutions
The patient access solutions market is ripe with emerging opportunities. Technological breakthroughs in predictive analytics can further optimize appointment scheduling by anticipating patient no-shows and enabling proactive re-engagement. Strategic partnerships between patient access solution providers and telehealth platforms, wearable device manufacturers, and remote patient monitoring services can create comprehensive, end-to-end patient care ecosystems. Market expansion into underserved regions and the development of specialized solutions for niche healthcare segments, such as behavioral health or chronic disease management, offer significant growth potential. The increasing focus on patient empowerment and personalized medicine will also drive the demand for solutions that facilitate seamless patient engagement and self-management.
Leading Players in the Patient Access Solutions Sector
- McKesson
- Epic Systems
- Cerner
- Cognizant
- Experian
- 3M
- Conifer Health
- Optum
- Advisory Board
- Craneware
- Zirmed
- The SSI Group
- Cirius Group
- AccuReg Software
Key Milestones in Patient Access Solutions Industry
- 2019: Increased focus on AI integration in patient scheduling and eligibility verification.
- 2020: Accelerated adoption of cloud-based patient access solutions due to remote work trends.
- 2021: Launch of enhanced patient portals with self-service appointment booking and payment options.
- 2022: Significant M&A activity as larger players acquire innovative patient access technology firms, bolstering market consolidation and service portfolios.
- 2023: Growing emphasis on data analytics for patient engagement and revenue cycle optimization.
- 2024: Expansion of integrated solutions encompassing telehealth and remote patient monitoring.
- 2025: Projected widespread adoption of AI-powered pre-authorization and intelligent consent management.
Strategic Outlook for Patient Access Solutions Market
The strategic outlook for the patient access solutions market is exceptionally positive, characterized by continued innovation and expanding adoption. Growth will be accelerated by the ongoing digital transformation within healthcare, driven by a persistent demand for improved patient experience and operational efficiency. Strategic opportunities lie in developing hyper-personalized patient engagement tools, leveraging AI for predictive patient journey mapping, and fostering deeper integration with emerging care delivery models like home-based care and virtual hospitals. Partnerships with health insurance providers and payers to streamline pre-authorization and claims processing will further enhance value propositions. The market's trajectory indicates a future where seamless, digital-first patient access becomes the standard of care, driving significant value for both providers and patients.
Patient Access Solutions Segmentation
-
1. Application
- 1.1. Healthcare Providers
- 1.2. Hospital
- 1.3. Clinic
- 1.4. Others
-
2. Type
- 2.1. Web Based
- 2.2. Cloud Based
Patient Access Solutions Segmentation By Geography
-
1. North America
- 1.1. United States
- 1.2. Canada
- 1.3. Mexico
-
2. South America
- 2.1. Brazil
- 2.2. Argentina
- 2.3. Rest of South America
-
3. Europe
- 3.1. United Kingdom
- 3.2. Germany
- 3.3. France
- 3.4. Italy
- 3.5. Spain
- 3.6. Russia
- 3.7. Benelux
- 3.8. Nordics
- 3.9. Rest of Europe
-
4. Middle East & Africa
- 4.1. Turkey
- 4.2. Israel
- 4.3. GCC
- 4.4. North Africa
- 4.5. South Africa
- 4.6. Rest of Middle East & Africa
-
5. Asia Pacific
- 5.1. China
- 5.2. India
- 5.3. Japan
- 5.4. South Korea
- 5.5. ASEAN
- 5.6. Oceania
- 5.7. Rest of Asia Pacific
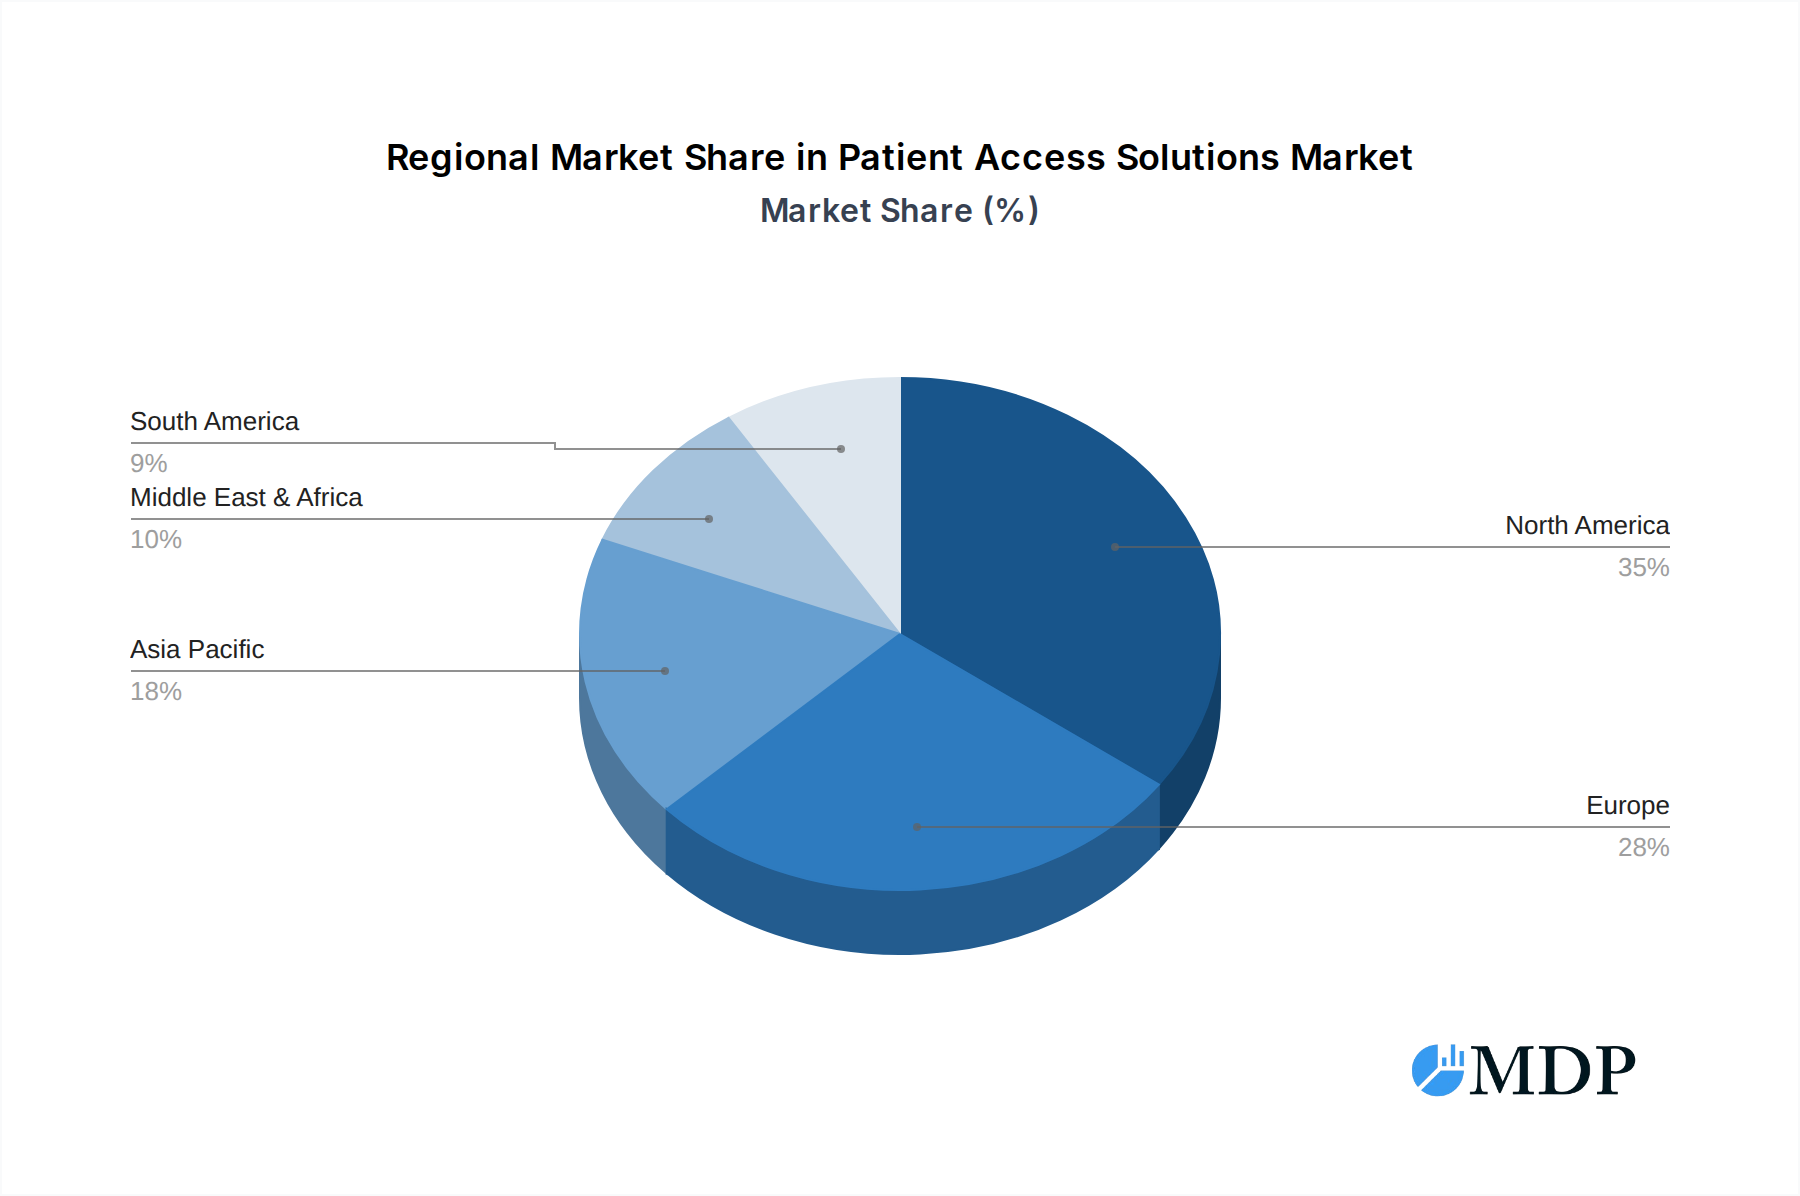
Patient Access Solutions Regional Market Share
Geographic Coverage of Patient Access Solutions
Patient Access Solutions REPORT HIGHLIGHTS
| Aspects | Details |
|---|---|
| Study Period | 2020-2034 |
| Base Year | 2025 |
| Estimated Year | 2026 |
| Forecast Period | 2026-2034 |
| Historical Period | 2020-2025 |
| Growth Rate | CAGR of 9.1% from 2020-2034 |
| Segmentation |
|
Table of Contents
- 1. Introduction
- 1.1. Research Scope
- 1.2. Market Segmentation
- 1.3. Research Methodology
- 1.4. Definitions and Assumptions
- 2. Executive Summary
- 2.1. Introduction
- 3. Market Dynamics
- 3.1. Introduction
- 3.2. Market Drivers
- 3.3. Market Restrains
- 3.4. Market Trends
- 4. Market Factor Analysis
- 4.1. Porters Five Forces
- 4.2. Supply/Value Chain
- 4.3. PESTEL analysis
- 4.4. Market Entropy
- 4.5. Patent/Trademark Analysis
- 5. Global Patient Access Solutions Analysis, Insights and Forecast, 2020-2032
- 5.1. Market Analysis, Insights and Forecast - by Application
- 5.1.1. Healthcare Providers
- 5.1.2. Hospital
- 5.1.3. Clinic
- 5.1.4. Others
- 5.2. Market Analysis, Insights and Forecast - by Type
- 5.2.1. Web Based
- 5.2.2. Cloud Based
- 5.3. Market Analysis, Insights and Forecast - by Region
- 5.3.1. North America
- 5.3.2. South America
- 5.3.3. Europe
- 5.3.4. Middle East & Africa
- 5.3.5. Asia Pacific
- 5.1. Market Analysis, Insights and Forecast - by Application
- 6. North America Patient Access Solutions Analysis, Insights and Forecast, 2020-2032
- 6.1. Market Analysis, Insights and Forecast - by Application
- 6.1.1. Healthcare Providers
- 6.1.2. Hospital
- 6.1.3. Clinic
- 6.1.4. Others
- 6.2. Market Analysis, Insights and Forecast - by Type
- 6.2.1. Web Based
- 6.2.2. Cloud Based
- 6.1. Market Analysis, Insights and Forecast - by Application
- 7. South America Patient Access Solutions Analysis, Insights and Forecast, 2020-2032
- 7.1. Market Analysis, Insights and Forecast - by Application
- 7.1.1. Healthcare Providers
- 7.1.2. Hospital
- 7.1.3. Clinic
- 7.1.4. Others
- 7.2. Market Analysis, Insights and Forecast - by Type
- 7.2.1. Web Based
- 7.2.2. Cloud Based
- 7.1. Market Analysis, Insights and Forecast - by Application
- 8. Europe Patient Access Solutions Analysis, Insights and Forecast, 2020-2032
- 8.1. Market Analysis, Insights and Forecast - by Application
- 8.1.1. Healthcare Providers
- 8.1.2. Hospital
- 8.1.3. Clinic
- 8.1.4. Others
- 8.2. Market Analysis, Insights and Forecast - by Type
- 8.2.1. Web Based
- 8.2.2. Cloud Based
- 8.1. Market Analysis, Insights and Forecast - by Application
- 9. Middle East & Africa Patient Access Solutions Analysis, Insights and Forecast, 2020-2032
- 9.1. Market Analysis, Insights and Forecast - by Application
- 9.1.1. Healthcare Providers
- 9.1.2. Hospital
- 9.1.3. Clinic
- 9.1.4. Others
- 9.2. Market Analysis, Insights and Forecast - by Type
- 9.2.1. Web Based
- 9.2.2. Cloud Based
- 9.1. Market Analysis, Insights and Forecast - by Application
- 10. Asia Pacific Patient Access Solutions Analysis, Insights and Forecast, 2020-2032
- 10.1. Market Analysis, Insights and Forecast - by Application
- 10.1.1. Healthcare Providers
- 10.1.2. Hospital
- 10.1.3. Clinic
- 10.1.4. Others
- 10.2. Market Analysis, Insights and Forecast - by Type
- 10.2.1. Web Based
- 10.2.2. Cloud Based
- 10.1. Market Analysis, Insights and Forecast - by Application
- 11. Competitive Analysis
- 11.1. Global Market Share Analysis 2025
- 11.2. Company Profiles
- 11.2.1 Mckesson
- 11.2.1.1. Overview
- 11.2.1.2. Products
- 11.2.1.3. SWOT Analysis
- 11.2.1.4. Recent Developments
- 11.2.1.5. Financials (Based on Availability)
- 11.2.2 Epic Systems
- 11.2.2.1. Overview
- 11.2.2.2. Products
- 11.2.2.3. SWOT Analysis
- 11.2.2.4. Recent Developments
- 11.2.2.5. Financials (Based on Availability)
- 11.2.3 Cerner
- 11.2.3.1. Overview
- 11.2.3.2. Products
- 11.2.3.3. SWOT Analysis
- 11.2.3.4. Recent Developments
- 11.2.3.5. Financials (Based on Availability)
- 11.2.4 Cognizant
- 11.2.4.1. Overview
- 11.2.4.2. Products
- 11.2.4.3. SWOT Analysis
- 11.2.4.4. Recent Developments
- 11.2.4.5. Financials (Based on Availability)
- 11.2.5 Experian
- 11.2.5.1. Overview
- 11.2.5.2. Products
- 11.2.5.3. SWOT Analysis
- 11.2.5.4. Recent Developments
- 11.2.5.5. Financials (Based on Availability)
- 11.2.6 3M
- 11.2.6.1. Overview
- 11.2.6.2. Products
- 11.2.6.3. SWOT Analysis
- 11.2.6.4. Recent Developments
- 11.2.6.5. Financials (Based on Availability)
- 11.2.7 Conifer Health
- 11.2.7.1. Overview
- 11.2.7.2. Products
- 11.2.7.3. SWOT Analysis
- 11.2.7.4. Recent Developments
- 11.2.7.5. Financials (Based on Availability)
- 11.2.8 Optum
- 11.2.8.1. Overview
- 11.2.8.2. Products
- 11.2.8.3. SWOT Analysis
- 11.2.8.4. Recent Developments
- 11.2.8.5. Financials (Based on Availability)
- 11.2.9 Advisory Board
- 11.2.9.1. Overview
- 11.2.9.2. Products
- 11.2.9.3. SWOT Analysis
- 11.2.9.4. Recent Developments
- 11.2.9.5. Financials (Based on Availability)
- 11.2.10 Craneware
- 11.2.10.1. Overview
- 11.2.10.2. Products
- 11.2.10.3. SWOT Analysis
- 11.2.10.4. Recent Developments
- 11.2.10.5. Financials (Based on Availability)
- 11.2.11 Zirmed
- 11.2.11.1. Overview
- 11.2.11.2. Products
- 11.2.11.3. SWOT Analysis
- 11.2.11.4. Recent Developments
- 11.2.11.5. Financials (Based on Availability)
- 11.2.12 The Ssi Group
- 11.2.12.1. Overview
- 11.2.12.2. Products
- 11.2.12.3. SWOT Analysis
- 11.2.12.4. Recent Developments
- 11.2.12.5. Financials (Based on Availability)
- 11.2.13 Cirius Group
- 11.2.13.1. Overview
- 11.2.13.2. Products
- 11.2.13.3. SWOT Analysis
- 11.2.13.4. Recent Developments
- 11.2.13.5. Financials (Based on Availability)
- 11.2.14 AccuReg Software
- 11.2.14.1. Overview
- 11.2.14.2. Products
- 11.2.14.3. SWOT Analysis
- 11.2.14.4. Recent Developments
- 11.2.14.5. Financials (Based on Availability)
- 11.2.1 Mckesson
List of Figures
- Figure 1: Global Patient Access Solutions Revenue Breakdown (billion, %) by Region 2025 & 2033
- Figure 2: North America Patient Access Solutions Revenue (billion), by Application 2025 & 2033
- Figure 3: North America Patient Access Solutions Revenue Share (%), by Application 2025 & 2033
- Figure 4: North America Patient Access Solutions Revenue (billion), by Type 2025 & 2033
- Figure 5: North America Patient Access Solutions Revenue Share (%), by Type 2025 & 2033
- Figure 6: North America Patient Access Solutions Revenue (billion), by Country 2025 & 2033
- Figure 7: North America Patient Access Solutions Revenue Share (%), by Country 2025 & 2033
- Figure 8: South America Patient Access Solutions Revenue (billion), by Application 2025 & 2033
- Figure 9: South America Patient Access Solutions Revenue Share (%), by Application 2025 & 2033
- Figure 10: South America Patient Access Solutions Revenue (billion), by Type 2025 & 2033
- Figure 11: South America Patient Access Solutions Revenue Share (%), by Type 2025 & 2033
- Figure 12: South America Patient Access Solutions Revenue (billion), by Country 2025 & 2033
- Figure 13: South America Patient Access Solutions Revenue Share (%), by Country 2025 & 2033
- Figure 14: Europe Patient Access Solutions Revenue (billion), by Application 2025 & 2033
- Figure 15: Europe Patient Access Solutions Revenue Share (%), by Application 2025 & 2033
- Figure 16: Europe Patient Access Solutions Revenue (billion), by Type 2025 & 2033
- Figure 17: Europe Patient Access Solutions Revenue Share (%), by Type 2025 & 2033
- Figure 18: Europe Patient Access Solutions Revenue (billion), by Country 2025 & 2033
- Figure 19: Europe Patient Access Solutions Revenue Share (%), by Country 2025 & 2033
- Figure 20: Middle East & Africa Patient Access Solutions Revenue (billion), by Application 2025 & 2033
- Figure 21: Middle East & Africa Patient Access Solutions Revenue Share (%), by Application 2025 & 2033
- Figure 22: Middle East & Africa Patient Access Solutions Revenue (billion), by Type 2025 & 2033
- Figure 23: Middle East & Africa Patient Access Solutions Revenue Share (%), by Type 2025 & 2033
- Figure 24: Middle East & Africa Patient Access Solutions Revenue (billion), by Country 2025 & 2033
- Figure 25: Middle East & Africa Patient Access Solutions Revenue Share (%), by Country 2025 & 2033
- Figure 26: Asia Pacific Patient Access Solutions Revenue (billion), by Application 2025 & 2033
- Figure 27: Asia Pacific Patient Access Solutions Revenue Share (%), by Application 2025 & 2033
- Figure 28: Asia Pacific Patient Access Solutions Revenue (billion), by Type 2025 & 2033
- Figure 29: Asia Pacific Patient Access Solutions Revenue Share (%), by Type 2025 & 2033
- Figure 30: Asia Pacific Patient Access Solutions Revenue (billion), by Country 2025 & 2033
- Figure 31: Asia Pacific Patient Access Solutions Revenue Share (%), by Country 2025 & 2033
List of Tables
- Table 1: Global Patient Access Solutions Revenue billion Forecast, by Application 2020 & 2033
- Table 2: Global Patient Access Solutions Revenue billion Forecast, by Type 2020 & 2033
- Table 3: Global Patient Access Solutions Revenue billion Forecast, by Region 2020 & 2033
- Table 4: Global Patient Access Solutions Revenue billion Forecast, by Application 2020 & 2033
- Table 5: Global Patient Access Solutions Revenue billion Forecast, by Type 2020 & 2033
- Table 6: Global Patient Access Solutions Revenue billion Forecast, by Country 2020 & 2033
- Table 7: United States Patient Access Solutions Revenue (billion) Forecast, by Application 2020 & 2033
- Table 8: Canada Patient Access Solutions Revenue (billion) Forecast, by Application 2020 & 2033
- Table 9: Mexico Patient Access Solutions Revenue (billion) Forecast, by Application 2020 & 2033
- Table 10: Global Patient Access Solutions Revenue billion Forecast, by Application 2020 & 2033
- Table 11: Global Patient Access Solutions Revenue billion Forecast, by Type 2020 & 2033
- Table 12: Global Patient Access Solutions Revenue billion Forecast, by Country 2020 & 2033
- Table 13: Brazil Patient Access Solutions Revenue (billion) Forecast, by Application 2020 & 2033
- Table 14: Argentina Patient Access Solutions Revenue (billion) Forecast, by Application 2020 & 2033
- Table 15: Rest of South America Patient Access Solutions Revenue (billion) Forecast, by Application 2020 & 2033
- Table 16: Global Patient Access Solutions Revenue billion Forecast, by Application 2020 & 2033
- Table 17: Global Patient Access Solutions Revenue billion Forecast, by Type 2020 & 2033
- Table 18: Global Patient Access Solutions Revenue billion Forecast, by Country 2020 & 2033
- Table 19: United Kingdom Patient Access Solutions Revenue (billion) Forecast, by Application 2020 & 2033
- Table 20: Germany Patient Access Solutions Revenue (billion) Forecast, by Application 2020 & 2033
- Table 21: France Patient Access Solutions Revenue (billion) Forecast, by Application 2020 & 2033
- Table 22: Italy Patient Access Solutions Revenue (billion) Forecast, by Application 2020 & 2033
- Table 23: Spain Patient Access Solutions Revenue (billion) Forecast, by Application 2020 & 2033
- Table 24: Russia Patient Access Solutions Revenue (billion) Forecast, by Application 2020 & 2033
- Table 25: Benelux Patient Access Solutions Revenue (billion) Forecast, by Application 2020 & 2033
- Table 26: Nordics Patient Access Solutions Revenue (billion) Forecast, by Application 2020 & 2033
- Table 27: Rest of Europe Patient Access Solutions Revenue (billion) Forecast, by Application 2020 & 2033
- Table 28: Global Patient Access Solutions Revenue billion Forecast, by Application 2020 & 2033
- Table 29: Global Patient Access Solutions Revenue billion Forecast, by Type 2020 & 2033
- Table 30: Global Patient Access Solutions Revenue billion Forecast, by Country 2020 & 2033
- Table 31: Turkey Patient Access Solutions Revenue (billion) Forecast, by Application 2020 & 2033
- Table 32: Israel Patient Access Solutions Revenue (billion) Forecast, by Application 2020 & 2033
- Table 33: GCC Patient Access Solutions Revenue (billion) Forecast, by Application 2020 & 2033
- Table 34: North Africa Patient Access Solutions Revenue (billion) Forecast, by Application 2020 & 2033
- Table 35: South Africa Patient Access Solutions Revenue (billion) Forecast, by Application 2020 & 2033
- Table 36: Rest of Middle East & Africa Patient Access Solutions Revenue (billion) Forecast, by Application 2020 & 2033
- Table 37: Global Patient Access Solutions Revenue billion Forecast, by Application 2020 & 2033
- Table 38: Global Patient Access Solutions Revenue billion Forecast, by Type 2020 & 2033
- Table 39: Global Patient Access Solutions Revenue billion Forecast, by Country 2020 & 2033
- Table 40: China Patient Access Solutions Revenue (billion) Forecast, by Application 2020 & 2033
- Table 41: India Patient Access Solutions Revenue (billion) Forecast, by Application 2020 & 2033
- Table 42: Japan Patient Access Solutions Revenue (billion) Forecast, by Application 2020 & 2033
- Table 43: South Korea Patient Access Solutions Revenue (billion) Forecast, by Application 2020 & 2033
- Table 44: ASEAN Patient Access Solutions Revenue (billion) Forecast, by Application 2020 & 2033
- Table 45: Oceania Patient Access Solutions Revenue (billion) Forecast, by Application 2020 & 2033
- Table 46: Rest of Asia Pacific Patient Access Solutions Revenue (billion) Forecast, by Application 2020 & 2033
Frequently Asked Questions
1. What is the projected Compound Annual Growth Rate (CAGR) of the Patient Access Solutions?
The projected CAGR is approximately 9.1%.
2. Which companies are prominent players in the Patient Access Solutions?
Key companies in the market include Mckesson, Epic Systems, Cerner, Cognizant, Experian, 3M, Conifer Health, Optum, Advisory Board, Craneware, Zirmed, The Ssi Group, Cirius Group, AccuReg Software.
3. What are the main segments of the Patient Access Solutions?
The market segments include Application, Type.
4. Can you provide details about the market size?
The market size is estimated to be USD 2.48 billion as of 2022.
5. What are some drivers contributing to market growth?
N/A
6. What are the notable trends driving market growth?
N/A
7. Are there any restraints impacting market growth?
N/A
8. Can you provide examples of recent developments in the market?
N/A
9. What pricing options are available for accessing the report?
Pricing options include single-user, multi-user, and enterprise licenses priced at USD 3950.00, USD 5925.00, and USD 7900.00 respectively.
10. Is the market size provided in terms of value or volume?
The market size is provided in terms of value, measured in billion.
11. Are there any specific market keywords associated with the report?
Yes, the market keyword associated with the report is "Patient Access Solutions," which aids in identifying and referencing the specific market segment covered.
12. How do I determine which pricing option suits my needs best?
The pricing options vary based on user requirements and access needs. Individual users may opt for single-user licenses, while businesses requiring broader access may choose multi-user or enterprise licenses for cost-effective access to the report.
13. Are there any additional resources or data provided in the Patient Access Solutions report?
While the report offers comprehensive insights, it's advisable to review the specific contents or supplementary materials provided to ascertain if additional resources or data are available.
14. How can I stay updated on further developments or reports in the Patient Access Solutions?
To stay informed about further developments, trends, and reports in the Patient Access Solutions, consider subscribing to industry newsletters, following relevant companies and organizations, or regularly checking reputable industry news sources and publications.
Methodology
Step 1 - Identification of Relevant Samples Size from Population Database


Step 2 - Approaches for Defining Global Market Size (Value, Volume* & Price*)

Note*: In applicable scenarios
Step 3 - Data Sources
Primary Research
- Web Analytics
- Survey Reports
- Research Institute
- Latest Research Reports
- Opinion Leaders
Secondary Research
- Annual Reports
- White Paper
- Latest Press Release
- Industry Association
- Paid Database
- Investor Presentations

Step 4 - Data Triangulation
Involves using different sources of information in order to increase the validity of a study
These sources are likely to be stakeholders in a program - participants, other researchers, program staff, other community members, and so on.
Then we put all data in single framework & apply various statistical tools to find out the dynamic on the market.
During the analysis stage, feedback from the stakeholder groups would be compared to determine areas of agreement as well as areas of divergence