

Key Insights
The organic chili powder market is experiencing significant expansion, propelled by escalating consumer preference for natural and health-promoting food products. Growing awareness of the health advantages of organic spices, alongside a strong inclination towards clean-label ingredients, is a key driver. Consumers are actively choosing organic options to circumvent artificial additives, pesticides, and genetically modified organisms (GMOs). This trend is particularly evident among health-focused millennials and Gen Z, who are instrumental in the organic food sector's growth. Furthermore, the rising popularity of global cuisines, especially Mexican and Southwestern American, is boosting demand for organic chili powder, a staple ingredient in these culinary traditions. The market is segmented by distribution channels (supermarkets, online retailers, specialty stores), product types (ground, flakes), and geographic regions. The global organic chili powder market is estimated at $0.5 billion in 2024, with a projected Compound Annual Growth Rate (CAGR) of 12.3%.
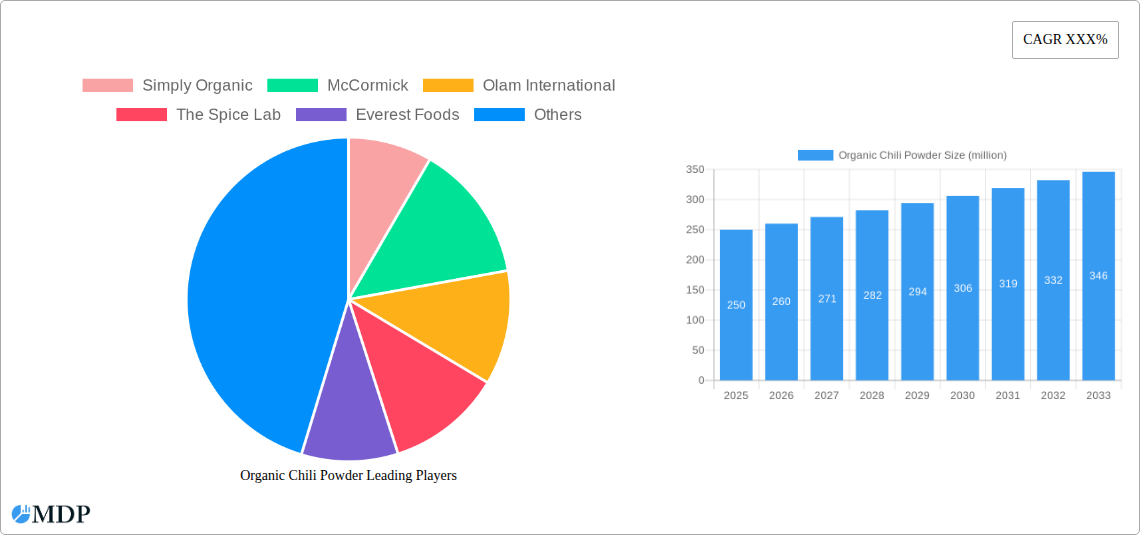
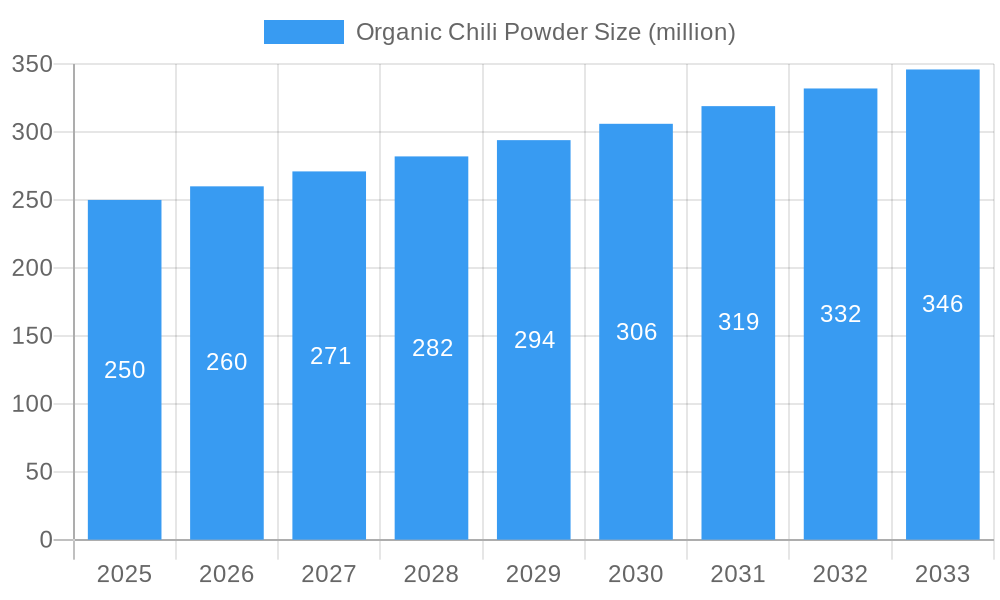
Organic Chili Powder Market Size (In Million)
The competitive landscape for organic chili powder is moderately intense, featuring a blend of major multinational corporations and specialized niche providers. Established brands like McCormick and Olam International utilize their broad distribution networks and strong brand equity to retain market positions. Conversely, smaller organic spice brands, such as Simply Organic and Spicely Organics, are gaining traction by highlighting sustainability, ethical sourcing, and premium product quality. Regional players also contribute to the competitive dynamic. Despite positive growth trajectories, potential challenges include raw material price fluctuations, variable agricultural yields, and maintaining consistent product quality. Nonetheless, the long-term outlook for the organic chili powder market remains positive, supported by enduring consumer demand and consistent growth in the overall organic food sector. Strategic imperatives for companies in this market should center on product innovation, sustainable procurement, and impactful branding to resonate with the evolving preferences of health-conscious consumers.
Organic Chili Powder Company Market Share
Organic Chili Powder Market Report: A Comprehensive Analysis (2019-2033)
This in-depth report provides a comprehensive analysis of the global organic chili powder market, projecting a market value exceeding $XX million by 2033. The study covers the period from 2019 to 2033, with a focus on the forecast period of 2025-2033 and a base year of 2025. This report is essential for industry stakeholders, investors, and anyone seeking to understand the dynamics and future potential of this rapidly growing market segment. The report offers actionable insights and strategic recommendations based on extensive market research and data analysis.
Organic Chili Powder Market Dynamics & Concentration
The organic chili powder market exhibits a moderately consolidated structure, with key players like McCormick, Olam International, and Simply Organic holding significant market share. However, a multitude of smaller, specialized companies, such as The Spice Lab, Everest Foods, and Spicely Organics, contribute to the market's diversity and dynamism. The market share of the top five players in 2024 is estimated at xx%, indicating potential for both consolidation and expansion.
Key Market Dynamics:
- Innovation Drivers: Growing consumer demand for high-quality, organic spices drives innovation in processing techniques, packaging, and product formulations (e.g., blends with other organic spices).
- Regulatory Frameworks: Stringent regulations regarding organic certification and labeling influence the market's growth trajectory, favoring established players with robust compliance mechanisms.
- Product Substitutes: Competition from conventional chili powders necessitates the development of unique product offerings, highlighting the organic benefits and superior taste profiles.
- End-User Trends: The increasing popularity of ethnic cuisines and home cooking fuels demand for versatile spices like organic chili powder.
- M&A Activities: The market has witnessed xx M&A deals in the historical period (2019-2024), suggesting a trend towards consolidation and expansion by larger players.
Organic Chili Powder Industry Trends & Analysis
The global organic chili powder market demonstrates robust growth, projected to achieve a CAGR of xx% during the forecast period (2025-2033). This growth is fueled by increasing health consciousness, rising disposable incomes in developing economies, and a growing preference for natural and organic food products. Market penetration of organic chili powder remains relatively low compared to conventional alternatives, presenting significant opportunities for expansion.
Key factors contributing to market growth include:
- Health and Wellness: Consumers are increasingly aware of the health benefits of organic food, driving demand for naturally sourced, pesticide-free spices.
- Changing Consumer Preferences: A shift towards convenient and flavorful food options enhances the appeal of organic chili powder in ready-to-eat meals and snacks.
- Technological Disruptions: Automation in spice processing and packaging improves efficiency and reduces costs, driving market expansion.
- Competitive Dynamics: Intense competition among players fosters innovation and product diversification, ultimately benefiting consumers.
Leading Markets & Segments in Organic Chili Powder
The North American market currently dominates the global organic chili powder market, driven by high consumer demand for organic food products and established distribution channels. The European market also shows significant potential for growth, although regulatory complexities might pose some challenges. Specific country-level analysis reveals that the U.S. holds the largest market share, followed by Canada and Germany.
Key Drivers of Market Dominance:
- Economic Policies: Government support for organic farming and sustainable agriculture fosters market growth in leading regions.
- Infrastructure: Efficient supply chains and well-developed distribution networks ensure effective product delivery to consumers.
- Consumer Awareness: High levels of consumer awareness about the health benefits of organic food and food safety regulations drive market growth.
Organic Chili Powder Product Developments
Recent product innovations focus on enhancing flavor profiles, extending shelf life through improved packaging, and offering convenient formats (e.g., pre-blended spice mixes). Companies are also emphasizing sustainability by sourcing organic chili peppers from environmentally responsible farms. Technological advancements in processing and packaging technologies further enhance the product quality and appeal. These innovations aim to cater to evolving consumer preferences and compete effectively in a dynamic market.
Key Drivers of Organic Chili Powder Growth
Several factors are fueling the growth of the organic chili powder market. Increased consumer awareness of health and wellness is a primary driver, along with growing demand for convenient and flavorful food options. Technological advancements in farming and processing improve efficiency and product quality. Favorable government regulations supporting organic agriculture also contribute positively to market expansion.
Challenges in the Organic Chili Powder Market
The organic chili powder market faces challenges such as fluctuations in raw material prices, stringent regulations, and intense competition. Supply chain disruptions can impact production and distribution, while maintaining consistent organic certification can be costly. Furthermore, competition from conventional chili powders and other spice alternatives requires continuous innovation and competitive pricing strategies. The market's reliance on weather conditions for raw material supply poses a further risk to production predictability.
Emerging Opportunities in Organic Chili Powder
Growing consumer interest in ethnic cuisines, health-conscious eating, and innovative food applications presents lucrative opportunities. Strategic partnerships and collaborations between spice producers and food manufacturers can expand market reach. Technological breakthroughs in spice processing and packaging offer the potential for increased efficiency and product differentiation. Furthermore, exploring new markets with high growth potential can further stimulate market expansion.
Leading Players in the Organic Chili Powder Sector
- Simply Organic
- McCormick
- Olam International
- The Spice Lab
- Everest Foods
- Woodland Gourmet
- Oregon's Wild Harvest
- Spicely Organics
- Frontier Co-op
- The Watkins Co
- Spices, Inc
- Mountain Rose Herbs
- Wild Harvest
- Farmer John's Herbs
Key Milestones in Organic Chili Powder Industry
- 2020: Increased demand for organic spices during the COVID-19 pandemic boosted market growth.
- 2021: Several key players invested in sustainable sourcing initiatives and improved packaging technologies.
- 2022: Launch of innovative organic chili powder blends with added health benefits.
- 2023: New certifications and standards for organic chili powder further enhanced product quality and credibility.
- 2024: Several mergers and acquisitions consolidated market share among major players. (Specific details of M&A activities to be added in the full report)
Strategic Outlook for Organic Chili Powder Market
The organic chili powder market exhibits substantial growth potential, driven by sustained demand for organic and healthy food options. Strategic opportunities lie in expanding into new geographical markets, developing innovative product offerings, and strengthening supply chain resilience. Focusing on sustainability and ethical sourcing will further enhance brand image and attract environmentally conscious consumers. The market’s future growth hinges on adapting to evolving consumer preferences and maintaining competitiveness in a dynamic market landscape.
Organic Chili Powder Segmentation
-
1. Application
- 1.1. Food Processing
- 1.2. Catering
- 1.3. Household
- 1.4. Other
-
2. Type
- 2.1. Bagged Organic Chili Powder
- 2.2. Jarred Organic Chili Powder
Organic Chili Powder Segmentation By Geography
-
1. North America
- 1.1. United States
- 1.2. Canada
- 1.3. Mexico
-
2. South America
- 2.1. Brazil
- 2.2. Argentina
- 2.3. Rest of South America
-
3. Europe
- 3.1. United Kingdom
- 3.2. Germany
- 3.3. France
- 3.4. Italy
- 3.5. Spain
- 3.6. Russia
- 3.7. Benelux
- 3.8. Nordics
- 3.9. Rest of Europe
-
4. Middle East & Africa
- 4.1. Turkey
- 4.2. Israel
- 4.3. GCC
- 4.4. North Africa
- 4.5. South Africa
- 4.6. Rest of Middle East & Africa
-
5. Asia Pacific
- 5.1. China
- 5.2. India
- 5.3. Japan
- 5.4. South Korea
- 5.5. ASEAN
- 5.6. Oceania
- 5.7. Rest of Asia Pacific
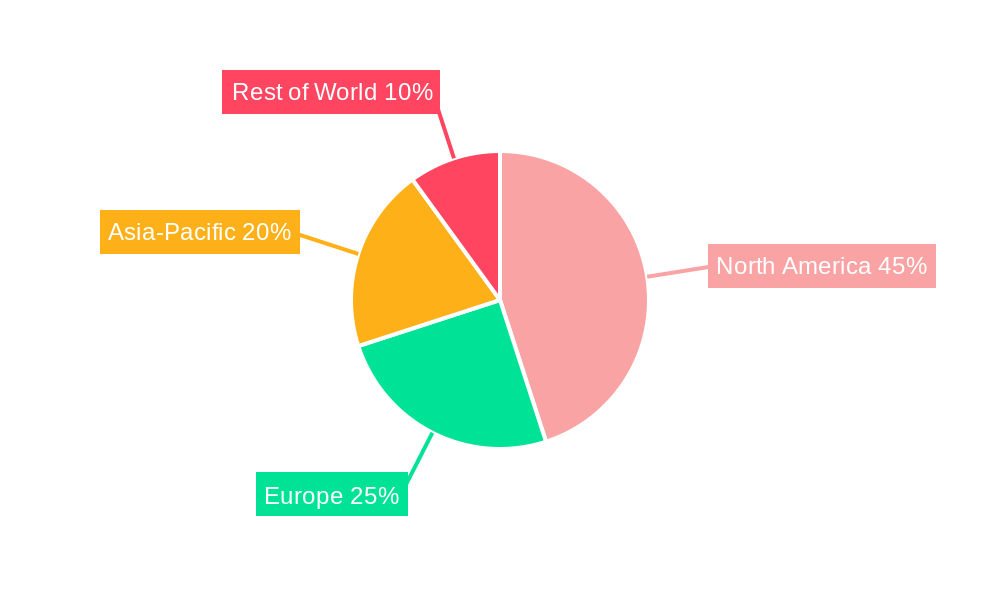
Organic Chili Powder Regional Market Share
Geographic Coverage of Organic Chili Powder
Organic Chili Powder REPORT HIGHLIGHTS
| Aspects | Details |
|---|---|
| Study Period | 2020-2034 |
| Base Year | 2025 |
| Estimated Year | 2026 |
| Forecast Period | 2026-2034 |
| Historical Period | 2020-2025 |
| Growth Rate | CAGR of 12.3% from 2020-2034 |
| Segmentation |
|
Table of Contents
- 1. Introduction
- 1.1. Research Scope
- 1.2. Market Segmentation
- 1.3. Research Methodology
- 1.4. Definitions and Assumptions
- 2. Executive Summary
- 2.1. Introduction
- 3. Market Dynamics
- 3.1. Introduction
- 3.2. Market Drivers
- 3.3. Market Restrains
- 3.4. Market Trends
- 4. Market Factor Analysis
- 4.1. Porters Five Forces
- 4.2. Supply/Value Chain
- 4.3. PESTEL analysis
- 4.4. Market Entropy
- 4.5. Patent/Trademark Analysis
- 5. Global Organic Chili Powder Analysis, Insights and Forecast, 2020-2032
- 5.1. Market Analysis, Insights and Forecast - by Application
- 5.1.1. Food Processing
- 5.1.2. Catering
- 5.1.3. Household
- 5.1.4. Other
- 5.2. Market Analysis, Insights and Forecast - by Type
- 5.2.1. Bagged Organic Chili Powder
- 5.2.2. Jarred Organic Chili Powder
- 5.3. Market Analysis, Insights and Forecast - by Region
- 5.3.1. North America
- 5.3.2. South America
- 5.3.3. Europe
- 5.3.4. Middle East & Africa
- 5.3.5. Asia Pacific
- 5.1. Market Analysis, Insights and Forecast - by Application
- 6. North America Organic Chili Powder Analysis, Insights and Forecast, 2020-2032
- 6.1. Market Analysis, Insights and Forecast - by Application
- 6.1.1. Food Processing
- 6.1.2. Catering
- 6.1.3. Household
- 6.1.4. Other
- 6.2. Market Analysis, Insights and Forecast - by Type
- 6.2.1. Bagged Organic Chili Powder
- 6.2.2. Jarred Organic Chili Powder
- 6.1. Market Analysis, Insights and Forecast - by Application
- 7. South America Organic Chili Powder Analysis, Insights and Forecast, 2020-2032
- 7.1. Market Analysis, Insights and Forecast - by Application
- 7.1.1. Food Processing
- 7.1.2. Catering
- 7.1.3. Household
- 7.1.4. Other
- 7.2. Market Analysis, Insights and Forecast - by Type
- 7.2.1. Bagged Organic Chili Powder
- 7.2.2. Jarred Organic Chili Powder
- 7.1. Market Analysis, Insights and Forecast - by Application
- 8. Europe Organic Chili Powder Analysis, Insights and Forecast, 2020-2032
- 8.1. Market Analysis, Insights and Forecast - by Application
- 8.1.1. Food Processing
- 8.1.2. Catering
- 8.1.3. Household
- 8.1.4. Other
- 8.2. Market Analysis, Insights and Forecast - by Type
- 8.2.1. Bagged Organic Chili Powder
- 8.2.2. Jarred Organic Chili Powder
- 8.1. Market Analysis, Insights and Forecast - by Application
- 9. Middle East & Africa Organic Chili Powder Analysis, Insights and Forecast, 2020-2032
- 9.1. Market Analysis, Insights and Forecast - by Application
- 9.1.1. Food Processing
- 9.1.2. Catering
- 9.1.3. Household
- 9.1.4. Other
- 9.2. Market Analysis, Insights and Forecast - by Type
- 9.2.1. Bagged Organic Chili Powder
- 9.2.2. Jarred Organic Chili Powder
- 9.1. Market Analysis, Insights and Forecast - by Application
- 10. Asia Pacific Organic Chili Powder Analysis, Insights and Forecast, 2020-2032
- 10.1. Market Analysis, Insights and Forecast - by Application
- 10.1.1. Food Processing
- 10.1.2. Catering
- 10.1.3. Household
- 10.1.4. Other
- 10.2. Market Analysis, Insights and Forecast - by Type
- 10.2.1. Bagged Organic Chili Powder
- 10.2.2. Jarred Organic Chili Powder
- 10.1. Market Analysis, Insights and Forecast - by Application
- 11. Competitive Analysis
- 11.1. Global Market Share Analysis 2025
- 11.2. Company Profiles
- 11.2.1 Simply Organic
- 11.2.1.1. Overview
- 11.2.1.2. Products
- 11.2.1.3. SWOT Analysis
- 11.2.1.4. Recent Developments
- 11.2.1.5. Financials (Based on Availability)
- 11.2.2 McCormick
- 11.2.2.1. Overview
- 11.2.2.2. Products
- 11.2.2.3. SWOT Analysis
- 11.2.2.4. Recent Developments
- 11.2.2.5. Financials (Based on Availability)
- 11.2.3 Olam International
- 11.2.3.1. Overview
- 11.2.3.2. Products
- 11.2.3.3. SWOT Analysis
- 11.2.3.4. Recent Developments
- 11.2.3.5. Financials (Based on Availability)
- 11.2.4 The Spice Lab
- 11.2.4.1. Overview
- 11.2.4.2. Products
- 11.2.4.3. SWOT Analysis
- 11.2.4.4. Recent Developments
- 11.2.4.5. Financials (Based on Availability)
- 11.2.5 Everest Foods
- 11.2.5.1. Overview
- 11.2.5.2. Products
- 11.2.5.3. SWOT Analysis
- 11.2.5.4. Recent Developments
- 11.2.5.5. Financials (Based on Availability)
- 11.2.6 Woodland Gourmet
- 11.2.6.1. Overview
- 11.2.6.2. Products
- 11.2.6.3. SWOT Analysis
- 11.2.6.4. Recent Developments
- 11.2.6.5. Financials (Based on Availability)
- 11.2.7 Oregon's Wild Harvest
- 11.2.7.1. Overview
- 11.2.7.2. Products
- 11.2.7.3. SWOT Analysis
- 11.2.7.4. Recent Developments
- 11.2.7.5. Financials (Based on Availability)
- 11.2.8 Spicely Organics
- 11.2.8.1. Overview
- 11.2.8.2. Products
- 11.2.8.3. SWOT Analysis
- 11.2.8.4. Recent Developments
- 11.2.8.5. Financials (Based on Availability)
- 11.2.9 Frontier Co-op
- 11.2.9.1. Overview
- 11.2.9.2. Products
- 11.2.9.3. SWOT Analysis
- 11.2.9.4. Recent Developments
- 11.2.9.5. Financials (Based on Availability)
- 11.2.10 The Watkins Co
- 11.2.10.1. Overview
- 11.2.10.2. Products
- 11.2.10.3. SWOT Analysis
- 11.2.10.4. Recent Developments
- 11.2.10.5. Financials (Based on Availability)
- 11.2.11 Spices
- 11.2.11.1. Overview
- 11.2.11.2. Products
- 11.2.11.3. SWOT Analysis
- 11.2.11.4. Recent Developments
- 11.2.11.5. Financials (Based on Availability)
- 11.2.12 Inc
- 11.2.12.1. Overview
- 11.2.12.2. Products
- 11.2.12.3. SWOT Analysis
- 11.2.12.4. Recent Developments
- 11.2.12.5. Financials (Based on Availability)
- 11.2.13 Mountain Rose Herbs
- 11.2.13.1. Overview
- 11.2.13.2. Products
- 11.2.13.3. SWOT Analysis
- 11.2.13.4. Recent Developments
- 11.2.13.5. Financials (Based on Availability)
- 11.2.14 Wild Harvest
- 11.2.14.1. Overview
- 11.2.14.2. Products
- 11.2.14.3. SWOT Analysis
- 11.2.14.4. Recent Developments
- 11.2.14.5. Financials (Based on Availability)
- 11.2.15 Farmer John's Herbs
- 11.2.15.1. Overview
- 11.2.15.2. Products
- 11.2.15.3. SWOT Analysis
- 11.2.15.4. Recent Developments
- 11.2.15.5. Financials (Based on Availability)
- 11.2.1 Simply Organic
List of Figures
- Figure 1: Global Organic Chili Powder Revenue Breakdown (billion, %) by Region 2025 & 2033
- Figure 2: Global Organic Chili Powder Volume Breakdown (K, %) by Region 2025 & 2033
- Figure 3: North America Organic Chili Powder Revenue (billion), by Application 2025 & 2033
- Figure 4: North America Organic Chili Powder Volume (K), by Application 2025 & 2033
- Figure 5: North America Organic Chili Powder Revenue Share (%), by Application 2025 & 2033
- Figure 6: North America Organic Chili Powder Volume Share (%), by Application 2025 & 2033
- Figure 7: North America Organic Chili Powder Revenue (billion), by Type 2025 & 2033
- Figure 8: North America Organic Chili Powder Volume (K), by Type 2025 & 2033
- Figure 9: North America Organic Chili Powder Revenue Share (%), by Type 2025 & 2033
- Figure 10: North America Organic Chili Powder Volume Share (%), by Type 2025 & 2033
- Figure 11: North America Organic Chili Powder Revenue (billion), by Country 2025 & 2033
- Figure 12: North America Organic Chili Powder Volume (K), by Country 2025 & 2033
- Figure 13: North America Organic Chili Powder Revenue Share (%), by Country 2025 & 2033
- Figure 14: North America Organic Chili Powder Volume Share (%), by Country 2025 & 2033
- Figure 15: South America Organic Chili Powder Revenue (billion), by Application 2025 & 2033
- Figure 16: South America Organic Chili Powder Volume (K), by Application 2025 & 2033
- Figure 17: South America Organic Chili Powder Revenue Share (%), by Application 2025 & 2033
- Figure 18: South America Organic Chili Powder Volume Share (%), by Application 2025 & 2033
- Figure 19: South America Organic Chili Powder Revenue (billion), by Type 2025 & 2033
- Figure 20: South America Organic Chili Powder Volume (K), by Type 2025 & 2033
- Figure 21: South America Organic Chili Powder Revenue Share (%), by Type 2025 & 2033
- Figure 22: South America Organic Chili Powder Volume Share (%), by Type 2025 & 2033
- Figure 23: South America Organic Chili Powder Revenue (billion), by Country 2025 & 2033
- Figure 24: South America Organic Chili Powder Volume (K), by Country 2025 & 2033
- Figure 25: South America Organic Chili Powder Revenue Share (%), by Country 2025 & 2033
- Figure 26: South America Organic Chili Powder Volume Share (%), by Country 2025 & 2033
- Figure 27: Europe Organic Chili Powder Revenue (billion), by Application 2025 & 2033
- Figure 28: Europe Organic Chili Powder Volume (K), by Application 2025 & 2033
- Figure 29: Europe Organic Chili Powder Revenue Share (%), by Application 2025 & 2033
- Figure 30: Europe Organic Chili Powder Volume Share (%), by Application 2025 & 2033
- Figure 31: Europe Organic Chili Powder Revenue (billion), by Type 2025 & 2033
- Figure 32: Europe Organic Chili Powder Volume (K), by Type 2025 & 2033
- Figure 33: Europe Organic Chili Powder Revenue Share (%), by Type 2025 & 2033
- Figure 34: Europe Organic Chili Powder Volume Share (%), by Type 2025 & 2033
- Figure 35: Europe Organic Chili Powder Revenue (billion), by Country 2025 & 2033
- Figure 36: Europe Organic Chili Powder Volume (K), by Country 2025 & 2033
- Figure 37: Europe Organic Chili Powder Revenue Share (%), by Country 2025 & 2033
- Figure 38: Europe Organic Chili Powder Volume Share (%), by Country 2025 & 2033
- Figure 39: Middle East & Africa Organic Chili Powder Revenue (billion), by Application 2025 & 2033
- Figure 40: Middle East & Africa Organic Chili Powder Volume (K), by Application 2025 & 2033
- Figure 41: Middle East & Africa Organic Chili Powder Revenue Share (%), by Application 2025 & 2033
- Figure 42: Middle East & Africa Organic Chili Powder Volume Share (%), by Application 2025 & 2033
- Figure 43: Middle East & Africa Organic Chili Powder Revenue (billion), by Type 2025 & 2033
- Figure 44: Middle East & Africa Organic Chili Powder Volume (K), by Type 2025 & 2033
- Figure 45: Middle East & Africa Organic Chili Powder Revenue Share (%), by Type 2025 & 2033
- Figure 46: Middle East & Africa Organic Chili Powder Volume Share (%), by Type 2025 & 2033
- Figure 47: Middle East & Africa Organic Chili Powder Revenue (billion), by Country 2025 & 2033
- Figure 48: Middle East & Africa Organic Chili Powder Volume (K), by Country 2025 & 2033
- Figure 49: Middle East & Africa Organic Chili Powder Revenue Share (%), by Country 2025 & 2033
- Figure 50: Middle East & Africa Organic Chili Powder Volume Share (%), by Country 2025 & 2033
- Figure 51: Asia Pacific Organic Chili Powder Revenue (billion), by Application 2025 & 2033
- Figure 52: Asia Pacific Organic Chili Powder Volume (K), by Application 2025 & 2033
- Figure 53: Asia Pacific Organic Chili Powder Revenue Share (%), by Application 2025 & 2033
- Figure 54: Asia Pacific Organic Chili Powder Volume Share (%), by Application 2025 & 2033
- Figure 55: Asia Pacific Organic Chili Powder Revenue (billion), by Type 2025 & 2033
- Figure 56: Asia Pacific Organic Chili Powder Volume (K), by Type 2025 & 2033
- Figure 57: Asia Pacific Organic Chili Powder Revenue Share (%), by Type 2025 & 2033
- Figure 58: Asia Pacific Organic Chili Powder Volume Share (%), by Type 2025 & 2033
- Figure 59: Asia Pacific Organic Chili Powder Revenue (billion), by Country 2025 & 2033
- Figure 60: Asia Pacific Organic Chili Powder Volume (K), by Country 2025 & 2033
- Figure 61: Asia Pacific Organic Chili Powder Revenue Share (%), by Country 2025 & 2033
- Figure 62: Asia Pacific Organic Chili Powder Volume Share (%), by Country 2025 & 2033
List of Tables
- Table 1: Global Organic Chili Powder Revenue billion Forecast, by Application 2020 & 2033
- Table 2: Global Organic Chili Powder Volume K Forecast, by Application 2020 & 2033
- Table 3: Global Organic Chili Powder Revenue billion Forecast, by Type 2020 & 2033
- Table 4: Global Organic Chili Powder Volume K Forecast, by Type 2020 & 2033
- Table 5: Global Organic Chili Powder Revenue billion Forecast, by Region 2020 & 2033
- Table 6: Global Organic Chili Powder Volume K Forecast, by Region 2020 & 2033
- Table 7: Global Organic Chili Powder Revenue billion Forecast, by Application 2020 & 2033
- Table 8: Global Organic Chili Powder Volume K Forecast, by Application 2020 & 2033
- Table 9: Global Organic Chili Powder Revenue billion Forecast, by Type 2020 & 2033
- Table 10: Global Organic Chili Powder Volume K Forecast, by Type 2020 & 2033
- Table 11: Global Organic Chili Powder Revenue billion Forecast, by Country 2020 & 2033
- Table 12: Global Organic Chili Powder Volume K Forecast, by Country 2020 & 2033
- Table 13: United States Organic Chili Powder Revenue (billion) Forecast, by Application 2020 & 2033
- Table 14: United States Organic Chili Powder Volume (K) Forecast, by Application 2020 & 2033
- Table 15: Canada Organic Chili Powder Revenue (billion) Forecast, by Application 2020 & 2033
- Table 16: Canada Organic Chili Powder Volume (K) Forecast, by Application 2020 & 2033
- Table 17: Mexico Organic Chili Powder Revenue (billion) Forecast, by Application 2020 & 2033
- Table 18: Mexico Organic Chili Powder Volume (K) Forecast, by Application 2020 & 2033
- Table 19: Global Organic Chili Powder Revenue billion Forecast, by Application 2020 & 2033
- Table 20: Global Organic Chili Powder Volume K Forecast, by Application 2020 & 2033
- Table 21: Global Organic Chili Powder Revenue billion Forecast, by Type 2020 & 2033
- Table 22: Global Organic Chili Powder Volume K Forecast, by Type 2020 & 2033
- Table 23: Global Organic Chili Powder Revenue billion Forecast, by Country 2020 & 2033
- Table 24: Global Organic Chili Powder Volume K Forecast, by Country 2020 & 2033
- Table 25: Brazil Organic Chili Powder Revenue (billion) Forecast, by Application 2020 & 2033
- Table 26: Brazil Organic Chili Powder Volume (K) Forecast, by Application 2020 & 2033
- Table 27: Argentina Organic Chili Powder Revenue (billion) Forecast, by Application 2020 & 2033
- Table 28: Argentina Organic Chili Powder Volume (K) Forecast, by Application 2020 & 2033
- Table 29: Rest of South America Organic Chili Powder Revenue (billion) Forecast, by Application 2020 & 2033
- Table 30: Rest of South America Organic Chili Powder Volume (K) Forecast, by Application 2020 & 2033
- Table 31: Global Organic Chili Powder Revenue billion Forecast, by Application 2020 & 2033
- Table 32: Global Organic Chili Powder Volume K Forecast, by Application 2020 & 2033
- Table 33: Global Organic Chili Powder Revenue billion Forecast, by Type 2020 & 2033
- Table 34: Global Organic Chili Powder Volume K Forecast, by Type 2020 & 2033
- Table 35: Global Organic Chili Powder Revenue billion Forecast, by Country 2020 & 2033
- Table 36: Global Organic Chili Powder Volume K Forecast, by Country 2020 & 2033
- Table 37: United Kingdom Organic Chili Powder Revenue (billion) Forecast, by Application 2020 & 2033
- Table 38: United Kingdom Organic Chili Powder Volume (K) Forecast, by Application 2020 & 2033
- Table 39: Germany Organic Chili Powder Revenue (billion) Forecast, by Application 2020 & 2033
- Table 40: Germany Organic Chili Powder Volume (K) Forecast, by Application 2020 & 2033
- Table 41: France Organic Chili Powder Revenue (billion) Forecast, by Application 2020 & 2033
- Table 42: France Organic Chili Powder Volume (K) Forecast, by Application 2020 & 2033
- Table 43: Italy Organic Chili Powder Revenue (billion) Forecast, by Application 2020 & 2033
- Table 44: Italy Organic Chili Powder Volume (K) Forecast, by Application 2020 & 2033
- Table 45: Spain Organic Chili Powder Revenue (billion) Forecast, by Application 2020 & 2033
- Table 46: Spain Organic Chili Powder Volume (K) Forecast, by Application 2020 & 2033
- Table 47: Russia Organic Chili Powder Revenue (billion) Forecast, by Application 2020 & 2033
- Table 48: Russia Organic Chili Powder Volume (K) Forecast, by Application 2020 & 2033
- Table 49: Benelux Organic Chili Powder Revenue (billion) Forecast, by Application 2020 & 2033
- Table 50: Benelux Organic Chili Powder Volume (K) Forecast, by Application 2020 & 2033
- Table 51: Nordics Organic Chili Powder Revenue (billion) Forecast, by Application 2020 & 2033
- Table 52: Nordics Organic Chili Powder Volume (K) Forecast, by Application 2020 & 2033
- Table 53: Rest of Europe Organic Chili Powder Revenue (billion) Forecast, by Application 2020 & 2033
- Table 54: Rest of Europe Organic Chili Powder Volume (K) Forecast, by Application 2020 & 2033
- Table 55: Global Organic Chili Powder Revenue billion Forecast, by Application 2020 & 2033
- Table 56: Global Organic Chili Powder Volume K Forecast, by Application 2020 & 2033
- Table 57: Global Organic Chili Powder Revenue billion Forecast, by Type 2020 & 2033
- Table 58: Global Organic Chili Powder Volume K Forecast, by Type 2020 & 2033
- Table 59: Global Organic Chili Powder Revenue billion Forecast, by Country 2020 & 2033
- Table 60: Global Organic Chili Powder Volume K Forecast, by Country 2020 & 2033
- Table 61: Turkey Organic Chili Powder Revenue (billion) Forecast, by Application 2020 & 2033
- Table 62: Turkey Organic Chili Powder Volume (K) Forecast, by Application 2020 & 2033
- Table 63: Israel Organic Chili Powder Revenue (billion) Forecast, by Application 2020 & 2033
- Table 64: Israel Organic Chili Powder Volume (K) Forecast, by Application 2020 & 2033
- Table 65: GCC Organic Chili Powder Revenue (billion) Forecast, by Application 2020 & 2033
- Table 66: GCC Organic Chili Powder Volume (K) Forecast, by Application 2020 & 2033
- Table 67: North Africa Organic Chili Powder Revenue (billion) Forecast, by Application 2020 & 2033
- Table 68: North Africa Organic Chili Powder Volume (K) Forecast, by Application 2020 & 2033
- Table 69: South Africa Organic Chili Powder Revenue (billion) Forecast, by Application 2020 & 2033
- Table 70: South Africa Organic Chili Powder Volume (K) Forecast, by Application 2020 & 2033
- Table 71: Rest of Middle East & Africa Organic Chili Powder Revenue (billion) Forecast, by Application 2020 & 2033
- Table 72: Rest of Middle East & Africa Organic Chili Powder Volume (K) Forecast, by Application 2020 & 2033
- Table 73: Global Organic Chili Powder Revenue billion Forecast, by Application 2020 & 2033
- Table 74: Global Organic Chili Powder Volume K Forecast, by Application 2020 & 2033
- Table 75: Global Organic Chili Powder Revenue billion Forecast, by Type 2020 & 2033
- Table 76: Global Organic Chili Powder Volume K Forecast, by Type 2020 & 2033
- Table 77: Global Organic Chili Powder Revenue billion Forecast, by Country 2020 & 2033
- Table 78: Global Organic Chili Powder Volume K Forecast, by Country 2020 & 2033
- Table 79: China Organic Chili Powder Revenue (billion) Forecast, by Application 2020 & 2033
- Table 80: China Organic Chili Powder Volume (K) Forecast, by Application 2020 & 2033
- Table 81: India Organic Chili Powder Revenue (billion) Forecast, by Application 2020 & 2033
- Table 82: India Organic Chili Powder Volume (K) Forecast, by Application 2020 & 2033
- Table 83: Japan Organic Chili Powder Revenue (billion) Forecast, by Application 2020 & 2033
- Table 84: Japan Organic Chili Powder Volume (K) Forecast, by Application 2020 & 2033
- Table 85: South Korea Organic Chili Powder Revenue (billion) Forecast, by Application 2020 & 2033
- Table 86: South Korea Organic Chili Powder Volume (K) Forecast, by Application 2020 & 2033
- Table 87: ASEAN Organic Chili Powder Revenue (billion) Forecast, by Application 2020 & 2033
- Table 88: ASEAN Organic Chili Powder Volume (K) Forecast, by Application 2020 & 2033
- Table 89: Oceania Organic Chili Powder Revenue (billion) Forecast, by Application 2020 & 2033
- Table 90: Oceania Organic Chili Powder Volume (K) Forecast, by Application 2020 & 2033
- Table 91: Rest of Asia Pacific Organic Chili Powder Revenue (billion) Forecast, by Application 2020 & 2033
- Table 92: Rest of Asia Pacific Organic Chili Powder Volume (K) Forecast, by Application 2020 & 2033
Frequently Asked Questions
1. What is the projected Compound Annual Growth Rate (CAGR) of the Organic Chili Powder?
The projected CAGR is approximately 12.3%.
2. Which companies are prominent players in the Organic Chili Powder?
Key companies in the market include Simply Organic, McCormick, Olam International, The Spice Lab, Everest Foods, Woodland Gourmet, Oregon's Wild Harvest, Spicely Organics, Frontier Co-op, The Watkins Co, Spices, Inc, Mountain Rose Herbs, Wild Harvest, Farmer John's Herbs.
3. What are the main segments of the Organic Chili Powder?
The market segments include Application, Type.
4. Can you provide details about the market size?
The market size is estimated to be USD 0.5 billion as of 2022.
5. What are some drivers contributing to market growth?
N/A
6. What are the notable trends driving market growth?
N/A
7. Are there any restraints impacting market growth?
N/A
8. Can you provide examples of recent developments in the market?
N/A
9. What pricing options are available for accessing the report?
Pricing options include single-user, multi-user, and enterprise licenses priced at USD 3950.00, USD 5925.00, and USD 7900.00 respectively.
10. Is the market size provided in terms of value or volume?
The market size is provided in terms of value, measured in billion and volume, measured in K.
11. Are there any specific market keywords associated with the report?
Yes, the market keyword associated with the report is "Organic Chili Powder," which aids in identifying and referencing the specific market segment covered.
12. How do I determine which pricing option suits my needs best?
The pricing options vary based on user requirements and access needs. Individual users may opt for single-user licenses, while businesses requiring broader access may choose multi-user or enterprise licenses for cost-effective access to the report.
13. Are there any additional resources or data provided in the Organic Chili Powder report?
While the report offers comprehensive insights, it's advisable to review the specific contents or supplementary materials provided to ascertain if additional resources or data are available.
14. How can I stay updated on further developments or reports in the Organic Chili Powder?
To stay informed about further developments, trends, and reports in the Organic Chili Powder, consider subscribing to industry newsletters, following relevant companies and organizations, or regularly checking reputable industry news sources and publications.
Methodology
Step 1 - Identification of Relevant Samples Size from Population Database


Step 2 - Approaches for Defining Global Market Size (Value, Volume* & Price*)

Note*: In applicable scenarios
Step 3 - Data Sources
Primary Research
- Web Analytics
- Survey Reports
- Research Institute
- Latest Research Reports
- Opinion Leaders
Secondary Research
- Annual Reports
- White Paper
- Latest Press Release
- Industry Association
- Paid Database
- Investor Presentations

Step 4 - Data Triangulation
Involves using different sources of information in order to increase the validity of a study
These sources are likely to be stakeholders in a program - participants, other researchers, program staff, other community members, and so on.
Then we put all data in single framework & apply various statistical tools to find out the dynamic on the market.
During the analysis stage, feedback from the stakeholder groups would be compared to determine areas of agreement as well as areas of divergence