

Key Insights
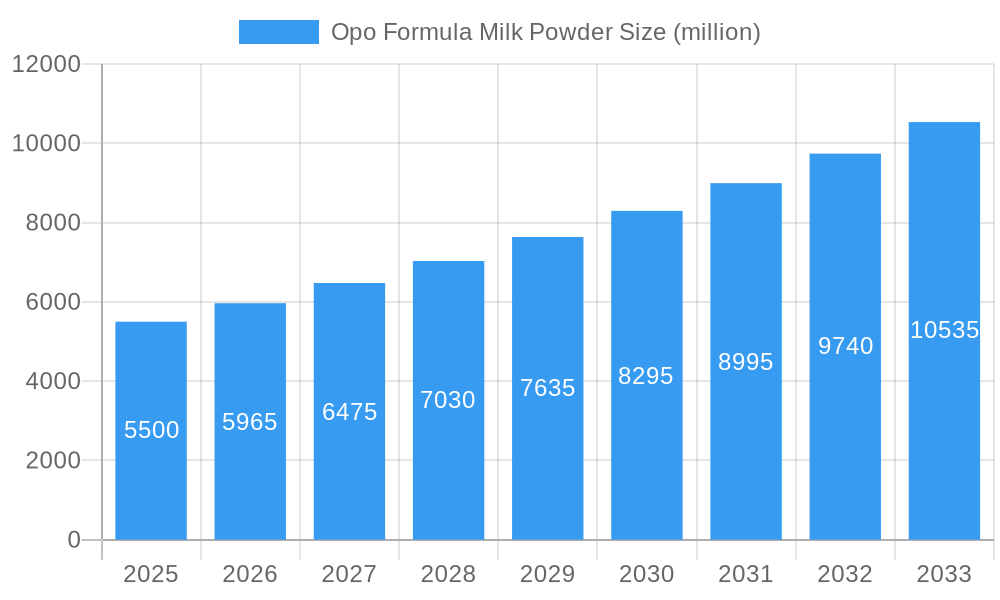
The OPO formula milk powder market is poised for significant expansion, projected to reach an estimated market size of approximately USD 5,500 million by 2025. This growth is fueled by a robust Compound Annual Growth Rate (CAGR) of around 8.5%, indicating sustained demand and innovation within the sector. The market's expansion is primarily driven by increasing parental awareness of OPO's benefits, such as improved fat absorption, calcium absorption, and reduced constipation, all crucial for infant development. This heightened understanding, coupled with rising disposable incomes in developing economies and a growing preference for premium infant nutrition products, forms the bedrock of this upward trajectory. The OPO formula milk powder market is segmented by application, with "12-36 Month" holding a dominant share due to the extended period infants and toddlers benefit from specialized nutrition, followed by "6-12 Month" and "0-6 Month" segments. By type, Cow Milk Formula remains the largest segment, though Goat Milk Formula is steadily gaining traction due to its perceived digestibility and lower allergenicity.
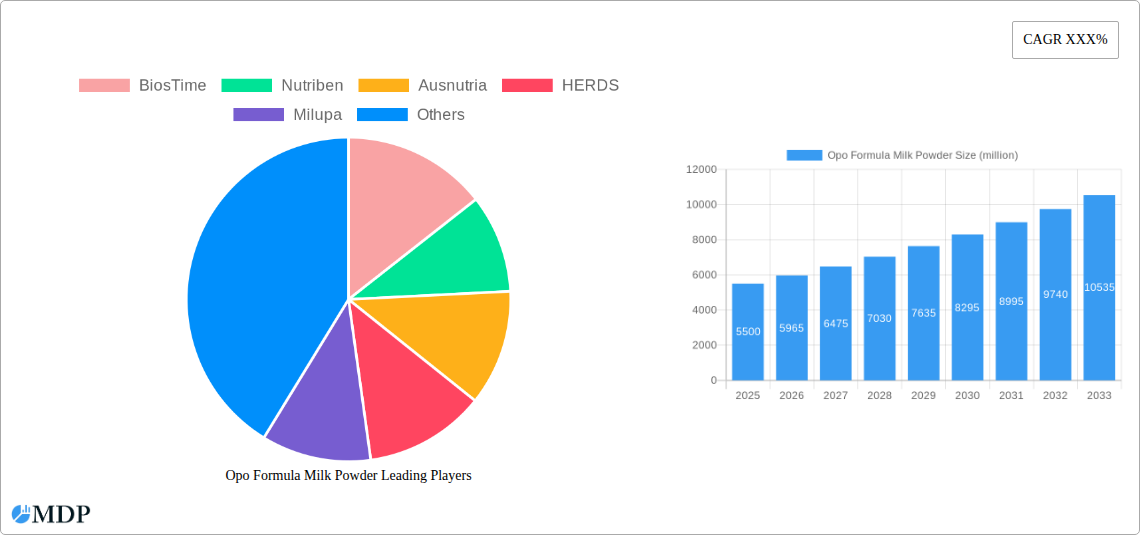
Opo Formula Milk Powder Market Size (In Billion)
Key players like Abbott, Feihe, and Wyeth Nutrition are investing heavily in research and development to enhance OPO integration and product formulations, catering to evolving consumer needs and regulatory landscapes. Emerging markets, particularly in the Asia Pacific region, are becoming pivotal growth engines, driven by a burgeoning middle class and increasing adoption of formula milk. However, challenges such as the stringent regulatory framework for infant formula and the potential for product recalls due to quality concerns could temper growth. Nonetheless, the overarching trend towards infant health and well-being, coupled with continuous product innovation and strategic market penetration by leading companies, ensures a dynamic and promising future for the OPO formula milk powder market. The study period from 2019-2033, with a base and estimated year of 2025, underscores the long-term positive outlook for this specialized segment of infant nutrition.
Opo Formula Milk Powder Company Market Share
Opo Formula Milk Powder Market Dynamics & Concentration: A Deep Dive
The Opo formula milk powder market is characterized by a moderate to high concentration, with key players like Abbott, Wyeth Nutrition, and Feihe holding significant market share. Innovation drivers are predominantly focused on enhancing nutritional profiles, incorporating prebiotics and probiotics for gut health, and developing allergen-free formulations. Regulatory frameworks, varying significantly across regions, play a crucial role in market entry and product approval. For instance, stringent infant nutrition regulations in Europe and North America necessitate extensive clinical trials and quality control measures, impacting market accessibility for new entrants. Product substitutes, primarily breast milk, remain the primary alternative, though fortified cow milk and soy-based formulas also represent indirect competition. End-user trends showcase a growing demand for premium, organic, and specialty formulas, driven by increasing parental awareness of infant health and development. Merger and acquisition (M&A) activities have been observed, though at a moderate pace, with companies seeking to expand their product portfolios and geographical reach. Historical M&A deal counts suggest an average of 5-10 significant transactions annually over the past five years. The market share distribution sees Abbott commanding approximately 15% and Wyeth Nutrition around 12% of the global Opo formula market, with Feihe demonstrating rapid growth in the Asian market.
Opo Formula Milk Powder Industry Trends & Analysis
The Opo formula milk powder industry is poised for robust growth, propelled by an escalating global birth rate and a sustained rise in disposable incomes, particularly in emerging economies. This financial uplift empowers parents to invest in premium infant nutrition products that promise enhanced health benefits and developmental support. Technological disruptions are at the forefront, with advancements in processing technologies enabling the creation of formulas that closely mimic the composition and benefits of human breast milk. The incorporation of OPO (Oleic Palmitic Oleic) triglyceride, a key structural lipid found in breast milk, is a significant trend, aimed at improving fat digestion and calcium absorption, thereby contributing to healthier bone development and reduced constipation in infants.
Consumer preferences are increasingly shifting towards products that offer perceived superior nutritional value. This includes a strong inclination towards organic, non-GMO, and hypoallergenic formulas, catering to parents who are highly invested in their child’s well-being and seeking to mitigate potential allergies. The demand for formulas enriched with essential nutrients like DHA (Docosahexaenoic acid) and ARA (Arachidonic acid) for cognitive and visual development is also substantial.
The competitive dynamics within the Opo formula milk powder sector are intensifying. Established global players are facing increasing pressure from agile local brands, particularly in rapidly growing markets such as China and India. These local brands often leverage a deep understanding of regional consumer needs and preferences, coupled with aggressive pricing strategies. Furthermore, the rise of direct-to-consumer (DTC) sales channels is reshaping the distribution landscape, allowing brands to connect more directly with consumers and build brand loyalty. The market penetration of Opo formula milk powder, while already significant in developed nations, is experiencing rapid expansion in developing regions, indicating substantial untapped potential. The Compound Annual Growth Rate (CAGR) for the Opo formula milk powder market is projected to be around 8.5% over the forecast period, driven by these evolving trends. The market size is estimated to reach approximately $25 million by 2025.
Leading Markets & Segments in Opo Formula Milk Powder
The Asia-Pacific region stands as the dominant market for Opo formula milk powder, driven by its vast population, rapidly growing middle class, and a strong cultural emphasis on infant nutrition. Within this region, China represents the single largest market, accounting for over 30% of global Opo formula consumption. The economic policies in China, including government initiatives promoting healthy child development and increased disposable incomes, have significantly fueled demand for premium infant nutrition. The country’s robust manufacturing capabilities also support a competitive landscape with leading domestic players like Feihe and Beingmate alongside international giants.
The Application: 0 - 6 Month segment is a primary driver of market growth globally. This critical developmental window necessitates specialized nutrition, and parents are increasingly seeking formulas that offer optimal benefits for newborns and young infants. Key drivers for this segment’s dominance include:
- Early-life nutrition research: Extensive scientific backing highlights the crucial role of early nutrition in long-term health outcomes.
- Parental investment: Parents prioritize investing in high-quality nutrition for their infants during this vulnerable period.
- Availability of specialized ingredients: The formulation of Opo-enriched powders specifically for this age group caters to enhanced digestive ease and nutrient absorption.
In terms of product Type, Cow Milk Formula holds the largest market share due to its widespread availability, established production infrastructure, and relatively lower cost compared to other types. However, Goat Milk Formula is experiencing a surge in popularity, particularly among consumers seeking alternatives to cow milk due to perceived digestibility benefits and lower allergenicity. Key drivers for the dominance of Cow Milk Formula include:
- Global supply chain efficiency: Well-established dairy farming and processing networks ensure consistent supply.
- Cost-effectiveness: Generally more affordable than specialty alternatives.
- Nutritional completeness: Cow milk-based formulas are extensively fortified to meet infant nutritional requirements.
The dominance of these segments is further amplified by effective marketing strategies from leading companies, widespread distribution networks, and increasing consumer awareness campaigns highlighting the specific benefits of Opo-enriched formulas for infant growth and development. The market size for the 0-6 Month segment is projected to be $15 million in 2025, with Cow Milk Formula accounting for approximately 70% of this value.
Opo Formula Milk Powder Product Developments
Product development in the Opo formula milk powder sector is heavily focused on enhancing bioavailability and mimicking breast milk's natural composition. Innovations include the precise integration of OPO into the fat globule structure to improve fat and calcium absorption, leading to softer stools and reduced risk of constipation. Companies are also investing in advanced purification and processing techniques to minimize potential allergens and ensure a clean label. Furthermore, the inclusion of synergistic ingredients like prebiotics (e.g., GOS, FOS) and probiotics is gaining traction, aiming to support infant gut health and immunity. These developments offer a competitive advantage by addressing specific parental concerns and unmet nutritional needs.
Key Drivers of Opo Formula Milk Powder Growth
The Opo formula milk powder market is propelled by several significant growth drivers. Firstly, increasing parental awareness regarding infant health and the crucial role of optimal nutrition during early development is a primary catalyst. Secondly, technological advancements in fat structure modification and nutrient fortification allow for formulas that more closely resemble breast milk, enhancing digestibility and absorption. Economic factors, including rising disposable incomes in emerging markets, enable greater affordability of premium infant nutrition. Finally, evolving regulatory landscapes, while presenting challenges, also encourage innovation and the development of safer, more effective infant formulas. The global market size is projected to increase by approximately $5 million annually.
Challenges in the Opo Formula Milk Powder Market
Despite robust growth, the Opo formula milk powder market faces considerable challenges. Stringent and fragmented regulatory frameworks across different countries can create significant hurdles for market entry and product standardization, requiring extensive compliance efforts. Fluctuations in raw material prices, particularly for milk powder and specialized ingredients, can impact production costs and profit margins. Intense competition from established brands and an increasing number of new entrants can lead to price wars and reduced profitability. Furthermore, the ongoing promotion of breastfeeding by health organizations, though beneficial for public health, represents a persistent indirect competitive pressure on the formula market.
Emerging Opportunities in Opo Formula Milk Powder
Emerging opportunities in the Opo formula milk powder market are largely driven by continued scientific research and technological innovation. The development of tailored formulas for specific infant needs, such as those with digestive sensitivities or metabolic disorders, presents a significant growth avenue. Strategic partnerships between formula manufacturers and pediatric research institutions can lead to breakthrough product formulations and clinical validation, enhancing consumer trust. Furthermore, the expansion into untapped geographical markets, particularly in developing nations with increasing purchasing power and awareness of infant nutrition, offers substantial long-term growth potential. The rise of e-commerce and digital platforms also provides new channels for direct consumer engagement and market penetration.
Leading Players in the Opo Formula Milk Powder Sector
- Abbott
- Wyeth Nutrition
- Feihe
- Brightdairy
- Yili
- Nutriben
- Ausnutria
- Kabrita
- BiosTime
- HERDS
- Milupa
- Shanxi Yatai
- Beingmate
- Deloraine
Key Milestones in Opo Formula Milk Powder Industry
- 2019: Increased research into OPO triglyceride’s benefits for infant digestion and calcium absorption gains momentum.
- 2020: Several major brands begin to prominently feature OPO on product packaging, reflecting growing consumer awareness.
- 2021: Launch of new OPO-enriched formulas targeting specific digestive concerns like constipation.
- 2022: Expansion of goat milk-based OPO formulas into new international markets.
- 2023: Regulatory bodies begin to harmonize standards for infant formula ingredients, including OPO.
- 2024: Advances in processing technology allow for more efficient and cost-effective OPO integration.
Strategic Outlook for Opo Formula Milk Powder Market
The strategic outlook for the Opo formula milk powder market remains highly optimistic, driven by continuous innovation and expanding global demand. Companies are expected to focus on further enhancing the nutritional profiles of their products, integrating advanced ingredients that support cognitive development, immune function, and gut health. Geographical expansion, particularly into emerging economies with growing disposable incomes and increasing parental health consciousness, will be a key growth accelerator. Strategic collaborations and mergers will likely continue as companies seek to consolidate market share and broaden their technological capabilities. The market is poised for sustained growth, with a projected increase of 9 million by 2033.
Opo Formula Milk Powder Segmentation
-
1. Application
- 1.1. 0 - 6 Month
- 1.2. 6 - 12 Month
- 1.3. 12 - 36 Month
-
2. Type
- 2.1. Cow Milk Formula
- 2.2. Goat Milk Formula
Opo Formula Milk Powder Segmentation By Geography
-
1. North America
- 1.1. United States
- 1.2. Canada
- 1.3. Mexico
-
2. South America
- 2.1. Brazil
- 2.2. Argentina
- 2.3. Rest of South America
-
3. Europe
- 3.1. United Kingdom
- 3.2. Germany
- 3.3. France
- 3.4. Italy
- 3.5. Spain
- 3.6. Russia
- 3.7. Benelux
- 3.8. Nordics
- 3.9. Rest of Europe
-
4. Middle East & Africa
- 4.1. Turkey
- 4.2. Israel
- 4.3. GCC
- 4.4. North Africa
- 4.5. South Africa
- 4.6. Rest of Middle East & Africa
-
5. Asia Pacific
- 5.1. China
- 5.2. India
- 5.3. Japan
- 5.4. South Korea
- 5.5. ASEAN
- 5.6. Oceania
- 5.7. Rest of Asia Pacific
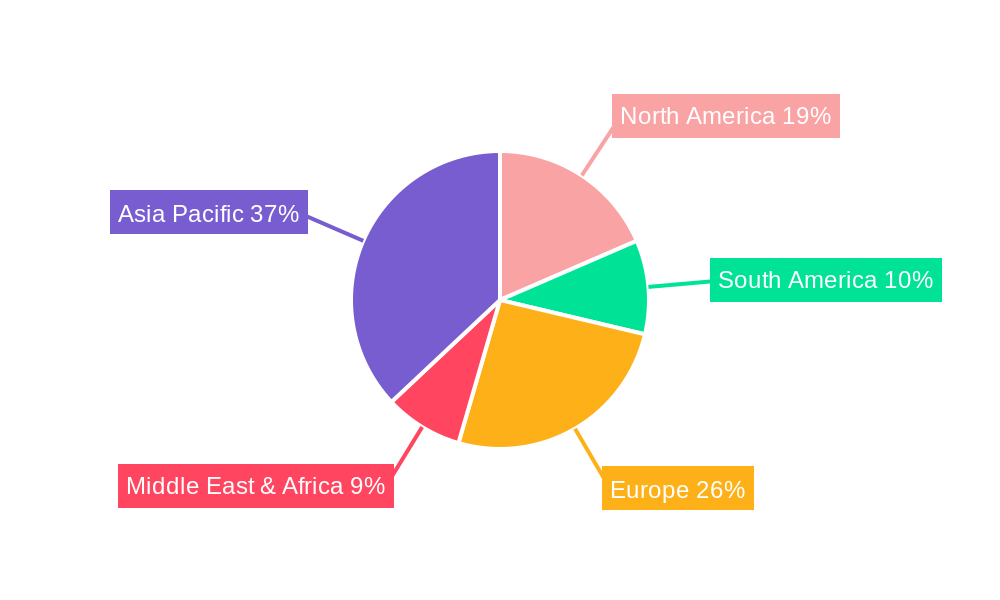
Opo Formula Milk Powder Regional Market Share
Geographic Coverage of Opo Formula Milk Powder
Opo Formula Milk Powder REPORT HIGHLIGHTS
| Aspects | Details |
|---|---|
| Study Period | 2020-2034 |
| Base Year | 2025 |
| Estimated Year | 2026 |
| Forecast Period | 2026-2034 |
| Historical Period | 2020-2025 |
| Growth Rate | CAGR of XXX% from 2020-2034 |
| Segmentation |
|
Table of Contents
- 1. Introduction
- 1.1. Research Scope
- 1.2. Market Segmentation
- 1.3. Research Methodology
- 1.4. Definitions and Assumptions
- 2. Executive Summary
- 2.1. Introduction
- 3. Market Dynamics
- 3.1. Introduction
- 3.2. Market Drivers
- 3.3. Market Restrains
- 3.4. Market Trends
- 4. Market Factor Analysis
- 4.1. Porters Five Forces
- 4.2. Supply/Value Chain
- 4.3. PESTEL analysis
- 4.4. Market Entropy
- 4.5. Patent/Trademark Analysis
- 5. Global Opo Formula Milk Powder Analysis, Insights and Forecast, 2020-2032
- 5.1. Market Analysis, Insights and Forecast - by Application
- 5.1.1. 0 - 6 Month
- 5.1.2. 6 - 12 Month
- 5.1.3. 12 - 36 Month
- 5.2. Market Analysis, Insights and Forecast - by Type
- 5.2.1. Cow Milk Formula
- 5.2.2. Goat Milk Formula
- 5.3. Market Analysis, Insights and Forecast - by Region
- 5.3.1. North America
- 5.3.2. South America
- 5.3.3. Europe
- 5.3.4. Middle East & Africa
- 5.3.5. Asia Pacific
- 5.1. Market Analysis, Insights and Forecast - by Application
- 6. North America Opo Formula Milk Powder Analysis, Insights and Forecast, 2020-2032
- 6.1. Market Analysis, Insights and Forecast - by Application
- 6.1.1. 0 - 6 Month
- 6.1.2. 6 - 12 Month
- 6.1.3. 12 - 36 Month
- 6.2. Market Analysis, Insights and Forecast - by Type
- 6.2.1. Cow Milk Formula
- 6.2.2. Goat Milk Formula
- 6.1. Market Analysis, Insights and Forecast - by Application
- 7. South America Opo Formula Milk Powder Analysis, Insights and Forecast, 2020-2032
- 7.1. Market Analysis, Insights and Forecast - by Application
- 7.1.1. 0 - 6 Month
- 7.1.2. 6 - 12 Month
- 7.1.3. 12 - 36 Month
- 7.2. Market Analysis, Insights and Forecast - by Type
- 7.2.1. Cow Milk Formula
- 7.2.2. Goat Milk Formula
- 7.1. Market Analysis, Insights and Forecast - by Application
- 8. Europe Opo Formula Milk Powder Analysis, Insights and Forecast, 2020-2032
- 8.1. Market Analysis, Insights and Forecast - by Application
- 8.1.1. 0 - 6 Month
- 8.1.2. 6 - 12 Month
- 8.1.3. 12 - 36 Month
- 8.2. Market Analysis, Insights and Forecast - by Type
- 8.2.1. Cow Milk Formula
- 8.2.2. Goat Milk Formula
- 8.1. Market Analysis, Insights and Forecast - by Application
- 9. Middle East & Africa Opo Formula Milk Powder Analysis, Insights and Forecast, 2020-2032
- 9.1. Market Analysis, Insights and Forecast - by Application
- 9.1.1. 0 - 6 Month
- 9.1.2. 6 - 12 Month
- 9.1.3. 12 - 36 Month
- 9.2. Market Analysis, Insights and Forecast - by Type
- 9.2.1. Cow Milk Formula
- 9.2.2. Goat Milk Formula
- 9.1. Market Analysis, Insights and Forecast - by Application
- 10. Asia Pacific Opo Formula Milk Powder Analysis, Insights and Forecast, 2020-2032
- 10.1. Market Analysis, Insights and Forecast - by Application
- 10.1.1. 0 - 6 Month
- 10.1.2. 6 - 12 Month
- 10.1.3. 12 - 36 Month
- 10.2. Market Analysis, Insights and Forecast - by Type
- 10.2.1. Cow Milk Formula
- 10.2.2. Goat Milk Formula
- 10.1. Market Analysis, Insights and Forecast - by Application
- 11. Competitive Analysis
- 11.1. Global Market Share Analysis 2025
- 11.2. Company Profiles
- 11.2.1 BiosTime
- 11.2.1.1. Overview
- 11.2.1.2. Products
- 11.2.1.3. SWOT Analysis
- 11.2.1.4. Recent Developments
- 11.2.1.5. Financials (Based on Availability)
- 11.2.2 Nutriben
- 11.2.2.1. Overview
- 11.2.2.2. Products
- 11.2.2.3. SWOT Analysis
- 11.2.2.4. Recent Developments
- 11.2.2.5. Financials (Based on Availability)
- 11.2.3 Ausnutria
- 11.2.3.1. Overview
- 11.2.3.2. Products
- 11.2.3.3. SWOT Analysis
- 11.2.3.4. Recent Developments
- 11.2.3.5. Financials (Based on Availability)
- 11.2.4 HERDS
- 11.2.4.1. Overview
- 11.2.4.2. Products
- 11.2.4.3. SWOT Analysis
- 11.2.4.4. Recent Developments
- 11.2.4.5. Financials (Based on Availability)
- 11.2.5 Milupa
- 11.2.5.1. Overview
- 11.2.5.2. Products
- 11.2.5.3. SWOT Analysis
- 11.2.5.4. Recent Developments
- 11.2.5.5. Financials (Based on Availability)
- 11.2.6 Shanxi Yatai
- 11.2.6.1. Overview
- 11.2.6.2. Products
- 11.2.6.3. SWOT Analysis
- 11.2.6.4. Recent Developments
- 11.2.6.5. Financials (Based on Availability)
- 11.2.7 Beingmate
- 11.2.7.1. Overview
- 11.2.7.2. Products
- 11.2.7.3. SWOT Analysis
- 11.2.7.4. Recent Developments
- 11.2.7.5. Financials (Based on Availability)
- 11.2.8 Abbott
- 11.2.8.1. Overview
- 11.2.8.2. Products
- 11.2.8.3. SWOT Analysis
- 11.2.8.4. Recent Developments
- 11.2.8.5. Financials (Based on Availability)
- 11.2.9 Brightdairy
- 11.2.9.1. Overview
- 11.2.9.2. Products
- 11.2.9.3. SWOT Analysis
- 11.2.9.4. Recent Developments
- 11.2.9.5. Financials (Based on Availability)
- 11.2.10 Feihe
- 11.2.10.1. Overview
- 11.2.10.2. Products
- 11.2.10.3. SWOT Analysis
- 11.2.10.4. Recent Developments
- 11.2.10.5. Financials (Based on Availability)
- 11.2.11 Wyeth Nutrition
- 11.2.11.1. Overview
- 11.2.11.2. Products
- 11.2.11.3. SWOT Analysis
- 11.2.11.4. Recent Developments
- 11.2.11.5. Financials (Based on Availability)
- 11.2.12 Deloraine
- 11.2.12.1. Overview
- 11.2.12.2. Products
- 11.2.12.3. SWOT Analysis
- 11.2.12.4. Recent Developments
- 11.2.12.5. Financials (Based on Availability)
- 11.2.13 Yili
- 11.2.13.1. Overview
- 11.2.13.2. Products
- 11.2.13.3. SWOT Analysis
- 11.2.13.4. Recent Developments
- 11.2.13.5. Financials (Based on Availability)
- 11.2.14 Kabrita
- 11.2.14.1. Overview
- 11.2.14.2. Products
- 11.2.14.3. SWOT Analysis
- 11.2.14.4. Recent Developments
- 11.2.14.5. Financials (Based on Availability)
- 11.2.1 BiosTime
List of Figures
- Figure 1: Global Opo Formula Milk Powder Revenue Breakdown (million, %) by Region 2025 & 2033
- Figure 2: Global Opo Formula Milk Powder Volume Breakdown (K, %) by Region 2025 & 2033
- Figure 3: North America Opo Formula Milk Powder Revenue (million), by Application 2025 & 2033
- Figure 4: North America Opo Formula Milk Powder Volume (K), by Application 2025 & 2033
- Figure 5: North America Opo Formula Milk Powder Revenue Share (%), by Application 2025 & 2033
- Figure 6: North America Opo Formula Milk Powder Volume Share (%), by Application 2025 & 2033
- Figure 7: North America Opo Formula Milk Powder Revenue (million), by Type 2025 & 2033
- Figure 8: North America Opo Formula Milk Powder Volume (K), by Type 2025 & 2033
- Figure 9: North America Opo Formula Milk Powder Revenue Share (%), by Type 2025 & 2033
- Figure 10: North America Opo Formula Milk Powder Volume Share (%), by Type 2025 & 2033
- Figure 11: North America Opo Formula Milk Powder Revenue (million), by Country 2025 & 2033
- Figure 12: North America Opo Formula Milk Powder Volume (K), by Country 2025 & 2033
- Figure 13: North America Opo Formula Milk Powder Revenue Share (%), by Country 2025 & 2033
- Figure 14: North America Opo Formula Milk Powder Volume Share (%), by Country 2025 & 2033
- Figure 15: South America Opo Formula Milk Powder Revenue (million), by Application 2025 & 2033
- Figure 16: South America Opo Formula Milk Powder Volume (K), by Application 2025 & 2033
- Figure 17: South America Opo Formula Milk Powder Revenue Share (%), by Application 2025 & 2033
- Figure 18: South America Opo Formula Milk Powder Volume Share (%), by Application 2025 & 2033
- Figure 19: South America Opo Formula Milk Powder Revenue (million), by Type 2025 & 2033
- Figure 20: South America Opo Formula Milk Powder Volume (K), by Type 2025 & 2033
- Figure 21: South America Opo Formula Milk Powder Revenue Share (%), by Type 2025 & 2033
- Figure 22: South America Opo Formula Milk Powder Volume Share (%), by Type 2025 & 2033
- Figure 23: South America Opo Formula Milk Powder Revenue (million), by Country 2025 & 2033
- Figure 24: South America Opo Formula Milk Powder Volume (K), by Country 2025 & 2033
- Figure 25: South America Opo Formula Milk Powder Revenue Share (%), by Country 2025 & 2033
- Figure 26: South America Opo Formula Milk Powder Volume Share (%), by Country 2025 & 2033
- Figure 27: Europe Opo Formula Milk Powder Revenue (million), by Application 2025 & 2033
- Figure 28: Europe Opo Formula Milk Powder Volume (K), by Application 2025 & 2033
- Figure 29: Europe Opo Formula Milk Powder Revenue Share (%), by Application 2025 & 2033
- Figure 30: Europe Opo Formula Milk Powder Volume Share (%), by Application 2025 & 2033
- Figure 31: Europe Opo Formula Milk Powder Revenue (million), by Type 2025 & 2033
- Figure 32: Europe Opo Formula Milk Powder Volume (K), by Type 2025 & 2033
- Figure 33: Europe Opo Formula Milk Powder Revenue Share (%), by Type 2025 & 2033
- Figure 34: Europe Opo Formula Milk Powder Volume Share (%), by Type 2025 & 2033
- Figure 35: Europe Opo Formula Milk Powder Revenue (million), by Country 2025 & 2033
- Figure 36: Europe Opo Formula Milk Powder Volume (K), by Country 2025 & 2033
- Figure 37: Europe Opo Formula Milk Powder Revenue Share (%), by Country 2025 & 2033
- Figure 38: Europe Opo Formula Milk Powder Volume Share (%), by Country 2025 & 2033
- Figure 39: Middle East & Africa Opo Formula Milk Powder Revenue (million), by Application 2025 & 2033
- Figure 40: Middle East & Africa Opo Formula Milk Powder Volume (K), by Application 2025 & 2033
- Figure 41: Middle East & Africa Opo Formula Milk Powder Revenue Share (%), by Application 2025 & 2033
- Figure 42: Middle East & Africa Opo Formula Milk Powder Volume Share (%), by Application 2025 & 2033
- Figure 43: Middle East & Africa Opo Formula Milk Powder Revenue (million), by Type 2025 & 2033
- Figure 44: Middle East & Africa Opo Formula Milk Powder Volume (K), by Type 2025 & 2033
- Figure 45: Middle East & Africa Opo Formula Milk Powder Revenue Share (%), by Type 2025 & 2033
- Figure 46: Middle East & Africa Opo Formula Milk Powder Volume Share (%), by Type 2025 & 2033
- Figure 47: Middle East & Africa Opo Formula Milk Powder Revenue (million), by Country 2025 & 2033
- Figure 48: Middle East & Africa Opo Formula Milk Powder Volume (K), by Country 2025 & 2033
- Figure 49: Middle East & Africa Opo Formula Milk Powder Revenue Share (%), by Country 2025 & 2033
- Figure 50: Middle East & Africa Opo Formula Milk Powder Volume Share (%), by Country 2025 & 2033
- Figure 51: Asia Pacific Opo Formula Milk Powder Revenue (million), by Application 2025 & 2033
- Figure 52: Asia Pacific Opo Formula Milk Powder Volume (K), by Application 2025 & 2033
- Figure 53: Asia Pacific Opo Formula Milk Powder Revenue Share (%), by Application 2025 & 2033
- Figure 54: Asia Pacific Opo Formula Milk Powder Volume Share (%), by Application 2025 & 2033
- Figure 55: Asia Pacific Opo Formula Milk Powder Revenue (million), by Type 2025 & 2033
- Figure 56: Asia Pacific Opo Formula Milk Powder Volume (K), by Type 2025 & 2033
- Figure 57: Asia Pacific Opo Formula Milk Powder Revenue Share (%), by Type 2025 & 2033
- Figure 58: Asia Pacific Opo Formula Milk Powder Volume Share (%), by Type 2025 & 2033
- Figure 59: Asia Pacific Opo Formula Milk Powder Revenue (million), by Country 2025 & 2033
- Figure 60: Asia Pacific Opo Formula Milk Powder Volume (K), by Country 2025 & 2033
- Figure 61: Asia Pacific Opo Formula Milk Powder Revenue Share (%), by Country 2025 & 2033
- Figure 62: Asia Pacific Opo Formula Milk Powder Volume Share (%), by Country 2025 & 2033
List of Tables
- Table 1: Global Opo Formula Milk Powder Revenue million Forecast, by Application 2020 & 2033
- Table 2: Global Opo Formula Milk Powder Volume K Forecast, by Application 2020 & 2033
- Table 3: Global Opo Formula Milk Powder Revenue million Forecast, by Type 2020 & 2033
- Table 4: Global Opo Formula Milk Powder Volume K Forecast, by Type 2020 & 2033
- Table 5: Global Opo Formula Milk Powder Revenue million Forecast, by Region 2020 & 2033
- Table 6: Global Opo Formula Milk Powder Volume K Forecast, by Region 2020 & 2033
- Table 7: Global Opo Formula Milk Powder Revenue million Forecast, by Application 2020 & 2033
- Table 8: Global Opo Formula Milk Powder Volume K Forecast, by Application 2020 & 2033
- Table 9: Global Opo Formula Milk Powder Revenue million Forecast, by Type 2020 & 2033
- Table 10: Global Opo Formula Milk Powder Volume K Forecast, by Type 2020 & 2033
- Table 11: Global Opo Formula Milk Powder Revenue million Forecast, by Country 2020 & 2033
- Table 12: Global Opo Formula Milk Powder Volume K Forecast, by Country 2020 & 2033
- Table 13: United States Opo Formula Milk Powder Revenue (million) Forecast, by Application 2020 & 2033
- Table 14: United States Opo Formula Milk Powder Volume (K) Forecast, by Application 2020 & 2033
- Table 15: Canada Opo Formula Milk Powder Revenue (million) Forecast, by Application 2020 & 2033
- Table 16: Canada Opo Formula Milk Powder Volume (K) Forecast, by Application 2020 & 2033
- Table 17: Mexico Opo Formula Milk Powder Revenue (million) Forecast, by Application 2020 & 2033
- Table 18: Mexico Opo Formula Milk Powder Volume (K) Forecast, by Application 2020 & 2033
- Table 19: Global Opo Formula Milk Powder Revenue million Forecast, by Application 2020 & 2033
- Table 20: Global Opo Formula Milk Powder Volume K Forecast, by Application 2020 & 2033
- Table 21: Global Opo Formula Milk Powder Revenue million Forecast, by Type 2020 & 2033
- Table 22: Global Opo Formula Milk Powder Volume K Forecast, by Type 2020 & 2033
- Table 23: Global Opo Formula Milk Powder Revenue million Forecast, by Country 2020 & 2033
- Table 24: Global Opo Formula Milk Powder Volume K Forecast, by Country 2020 & 2033
- Table 25: Brazil Opo Formula Milk Powder Revenue (million) Forecast, by Application 2020 & 2033
- Table 26: Brazil Opo Formula Milk Powder Volume (K) Forecast, by Application 2020 & 2033
- Table 27: Argentina Opo Formula Milk Powder Revenue (million) Forecast, by Application 2020 & 2033
- Table 28: Argentina Opo Formula Milk Powder Volume (K) Forecast, by Application 2020 & 2033
- Table 29: Rest of South America Opo Formula Milk Powder Revenue (million) Forecast, by Application 2020 & 2033
- Table 30: Rest of South America Opo Formula Milk Powder Volume (K) Forecast, by Application 2020 & 2033
- Table 31: Global Opo Formula Milk Powder Revenue million Forecast, by Application 2020 & 2033
- Table 32: Global Opo Formula Milk Powder Volume K Forecast, by Application 2020 & 2033
- Table 33: Global Opo Formula Milk Powder Revenue million Forecast, by Type 2020 & 2033
- Table 34: Global Opo Formula Milk Powder Volume K Forecast, by Type 2020 & 2033
- Table 35: Global Opo Formula Milk Powder Revenue million Forecast, by Country 2020 & 2033
- Table 36: Global Opo Formula Milk Powder Volume K Forecast, by Country 2020 & 2033
- Table 37: United Kingdom Opo Formula Milk Powder Revenue (million) Forecast, by Application 2020 & 2033
- Table 38: United Kingdom Opo Formula Milk Powder Volume (K) Forecast, by Application 2020 & 2033
- Table 39: Germany Opo Formula Milk Powder Revenue (million) Forecast, by Application 2020 & 2033
- Table 40: Germany Opo Formula Milk Powder Volume (K) Forecast, by Application 2020 & 2033
- Table 41: France Opo Formula Milk Powder Revenue (million) Forecast, by Application 2020 & 2033
- Table 42: France Opo Formula Milk Powder Volume (K) Forecast, by Application 2020 & 2033
- Table 43: Italy Opo Formula Milk Powder Revenue (million) Forecast, by Application 2020 & 2033
- Table 44: Italy Opo Formula Milk Powder Volume (K) Forecast, by Application 2020 & 2033
- Table 45: Spain Opo Formula Milk Powder Revenue (million) Forecast, by Application 2020 & 2033
- Table 46: Spain Opo Formula Milk Powder Volume (K) Forecast, by Application 2020 & 2033
- Table 47: Russia Opo Formula Milk Powder Revenue (million) Forecast, by Application 2020 & 2033
- Table 48: Russia Opo Formula Milk Powder Volume (K) Forecast, by Application 2020 & 2033
- Table 49: Benelux Opo Formula Milk Powder Revenue (million) Forecast, by Application 2020 & 2033
- Table 50: Benelux Opo Formula Milk Powder Volume (K) Forecast, by Application 2020 & 2033
- Table 51: Nordics Opo Formula Milk Powder Revenue (million) Forecast, by Application 2020 & 2033
- Table 52: Nordics Opo Formula Milk Powder Volume (K) Forecast, by Application 2020 & 2033
- Table 53: Rest of Europe Opo Formula Milk Powder Revenue (million) Forecast, by Application 2020 & 2033
- Table 54: Rest of Europe Opo Formula Milk Powder Volume (K) Forecast, by Application 2020 & 2033
- Table 55: Global Opo Formula Milk Powder Revenue million Forecast, by Application 2020 & 2033
- Table 56: Global Opo Formula Milk Powder Volume K Forecast, by Application 2020 & 2033
- Table 57: Global Opo Formula Milk Powder Revenue million Forecast, by Type 2020 & 2033
- Table 58: Global Opo Formula Milk Powder Volume K Forecast, by Type 2020 & 2033
- Table 59: Global Opo Formula Milk Powder Revenue million Forecast, by Country 2020 & 2033
- Table 60: Global Opo Formula Milk Powder Volume K Forecast, by Country 2020 & 2033
- Table 61: Turkey Opo Formula Milk Powder Revenue (million) Forecast, by Application 2020 & 2033
- Table 62: Turkey Opo Formula Milk Powder Volume (K) Forecast, by Application 2020 & 2033
- Table 63: Israel Opo Formula Milk Powder Revenue (million) Forecast, by Application 2020 & 2033
- Table 64: Israel Opo Formula Milk Powder Volume (K) Forecast, by Application 2020 & 2033
- Table 65: GCC Opo Formula Milk Powder Revenue (million) Forecast, by Application 2020 & 2033
- Table 66: GCC Opo Formula Milk Powder Volume (K) Forecast, by Application 2020 & 2033
- Table 67: North Africa Opo Formula Milk Powder Revenue (million) Forecast, by Application 2020 & 2033
- Table 68: North Africa Opo Formula Milk Powder Volume (K) Forecast, by Application 2020 & 2033
- Table 69: South Africa Opo Formula Milk Powder Revenue (million) Forecast, by Application 2020 & 2033
- Table 70: South Africa Opo Formula Milk Powder Volume (K) Forecast, by Application 2020 & 2033
- Table 71: Rest of Middle East & Africa Opo Formula Milk Powder Revenue (million) Forecast, by Application 2020 & 2033
- Table 72: Rest of Middle East & Africa Opo Formula Milk Powder Volume (K) Forecast, by Application 2020 & 2033
- Table 73: Global Opo Formula Milk Powder Revenue million Forecast, by Application 2020 & 2033
- Table 74: Global Opo Formula Milk Powder Volume K Forecast, by Application 2020 & 2033
- Table 75: Global Opo Formula Milk Powder Revenue million Forecast, by Type 2020 & 2033
- Table 76: Global Opo Formula Milk Powder Volume K Forecast, by Type 2020 & 2033
- Table 77: Global Opo Formula Milk Powder Revenue million Forecast, by Country 2020 & 2033
- Table 78: Global Opo Formula Milk Powder Volume K Forecast, by Country 2020 & 2033
- Table 79: China Opo Formula Milk Powder Revenue (million) Forecast, by Application 2020 & 2033
- Table 80: China Opo Formula Milk Powder Volume (K) Forecast, by Application 2020 & 2033
- Table 81: India Opo Formula Milk Powder Revenue (million) Forecast, by Application 2020 & 2033
- Table 82: India Opo Formula Milk Powder Volume (K) Forecast, by Application 2020 & 2033
- Table 83: Japan Opo Formula Milk Powder Revenue (million) Forecast, by Application 2020 & 2033
- Table 84: Japan Opo Formula Milk Powder Volume (K) Forecast, by Application 2020 & 2033
- Table 85: South Korea Opo Formula Milk Powder Revenue (million) Forecast, by Application 2020 & 2033
- Table 86: South Korea Opo Formula Milk Powder Volume (K) Forecast, by Application 2020 & 2033
- Table 87: ASEAN Opo Formula Milk Powder Revenue (million) Forecast, by Application 2020 & 2033
- Table 88: ASEAN Opo Formula Milk Powder Volume (K) Forecast, by Application 2020 & 2033
- Table 89: Oceania Opo Formula Milk Powder Revenue (million) Forecast, by Application 2020 & 2033
- Table 90: Oceania Opo Formula Milk Powder Volume (K) Forecast, by Application 2020 & 2033
- Table 91: Rest of Asia Pacific Opo Formula Milk Powder Revenue (million) Forecast, by Application 2020 & 2033
- Table 92: Rest of Asia Pacific Opo Formula Milk Powder Volume (K) Forecast, by Application 2020 & 2033
Frequently Asked Questions
1. What is the projected Compound Annual Growth Rate (CAGR) of the Opo Formula Milk Powder?
The projected CAGR is approximately XXX%.
2. Which companies are prominent players in the Opo Formula Milk Powder?
Key companies in the market include BiosTime, Nutriben, Ausnutria, HERDS, Milupa, Shanxi Yatai, Beingmate, Abbott, Brightdairy, Feihe, Wyeth Nutrition, Deloraine, Yili, Kabrita.
3. What are the main segments of the Opo Formula Milk Powder?
The market segments include Application, Type.
4. Can you provide details about the market size?
The market size is estimated to be USD XXX million as of 2022.
5. What are some drivers contributing to market growth?
N/A
6. What are the notable trends driving market growth?
N/A
7. Are there any restraints impacting market growth?
N/A
8. Can you provide examples of recent developments in the market?
N/A
9. What pricing options are available for accessing the report?
Pricing options include single-user, multi-user, and enterprise licenses priced at USD 3950.00, USD 5925.00, and USD 7900.00 respectively.
10. Is the market size provided in terms of value or volume?
The market size is provided in terms of value, measured in million and volume, measured in K.
11. Are there any specific market keywords associated with the report?
Yes, the market keyword associated with the report is "Opo Formula Milk Powder," which aids in identifying and referencing the specific market segment covered.
12. How do I determine which pricing option suits my needs best?
The pricing options vary based on user requirements and access needs. Individual users may opt for single-user licenses, while businesses requiring broader access may choose multi-user or enterprise licenses for cost-effective access to the report.
13. Are there any additional resources or data provided in the Opo Formula Milk Powder report?
While the report offers comprehensive insights, it's advisable to review the specific contents or supplementary materials provided to ascertain if additional resources or data are available.
14. How can I stay updated on further developments or reports in the Opo Formula Milk Powder?
To stay informed about further developments, trends, and reports in the Opo Formula Milk Powder, consider subscribing to industry newsletters, following relevant companies and organizations, or regularly checking reputable industry news sources and publications.
Methodology
Step 1 - Identification of Relevant Samples Size from Population Database


Step 2 - Approaches for Defining Global Market Size (Value, Volume* & Price*)

Note*: In applicable scenarios
Step 3 - Data Sources
Primary Research
- Web Analytics
- Survey Reports
- Research Institute
- Latest Research Reports
- Opinion Leaders
Secondary Research
- Annual Reports
- White Paper
- Latest Press Release
- Industry Association
- Paid Database
- Investor Presentations

Step 4 - Data Triangulation
Involves using different sources of information in order to increase the validity of a study
These sources are likely to be stakeholders in a program - participants, other researchers, program staff, other community members, and so on.
Then we put all data in single framework & apply various statistical tools to find out the dynamic on the market.
During the analysis stage, feedback from the stakeholder groups would be compared to determine areas of agreement as well as areas of divergence