

Key Insights
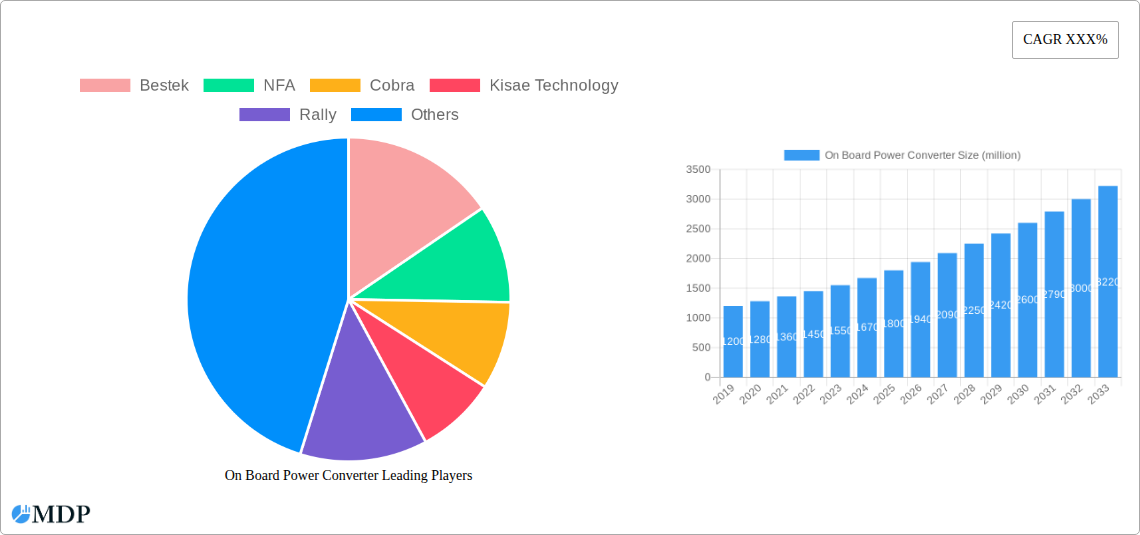
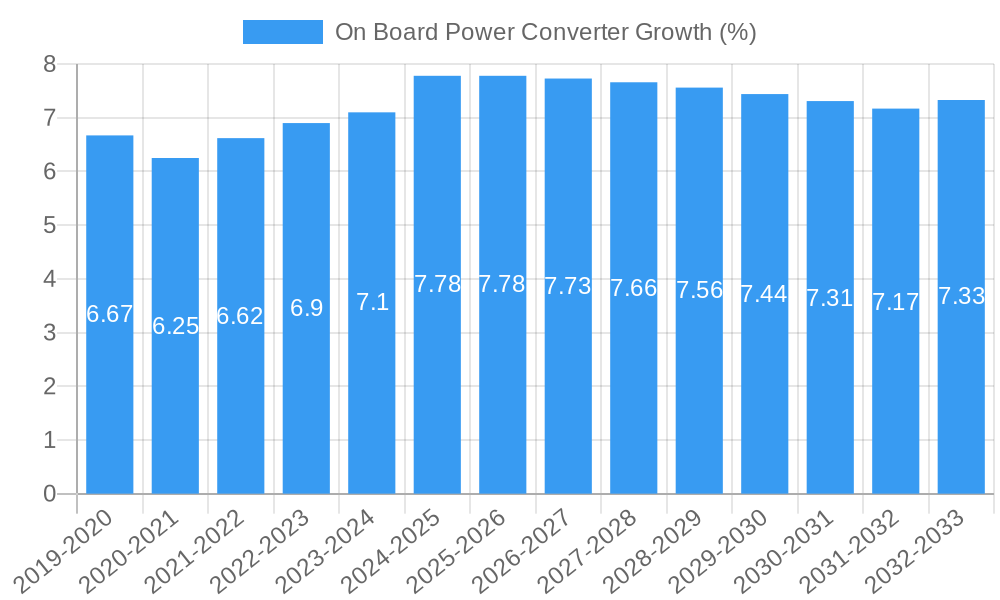
The global On-Board Power Converter market is experiencing robust expansion, projected to reach approximately $1,800 million by 2025, with a Compound Annual Growth Rate (CAGR) of around 7.5% through 2033. This significant market size and growth are fueled by the escalating demand for reliable and efficient power solutions within vehicles. The increasing adoption of passenger cars and commercial vehicles worldwide, coupled with the growing integration of advanced electronics and infotainment systems, are primary drivers. Furthermore, the proliferation of electric and hybrid vehicles, which necessitate sophisticated on-board power management, is a pivotal growth catalyst. The market is segmented by application, with passenger cars representing a dominant segment due to their sheer volume and by vehicle type, including 12V, 24V, and 48V and above systems, reflecting the diverse power requirements across the automotive spectrum.
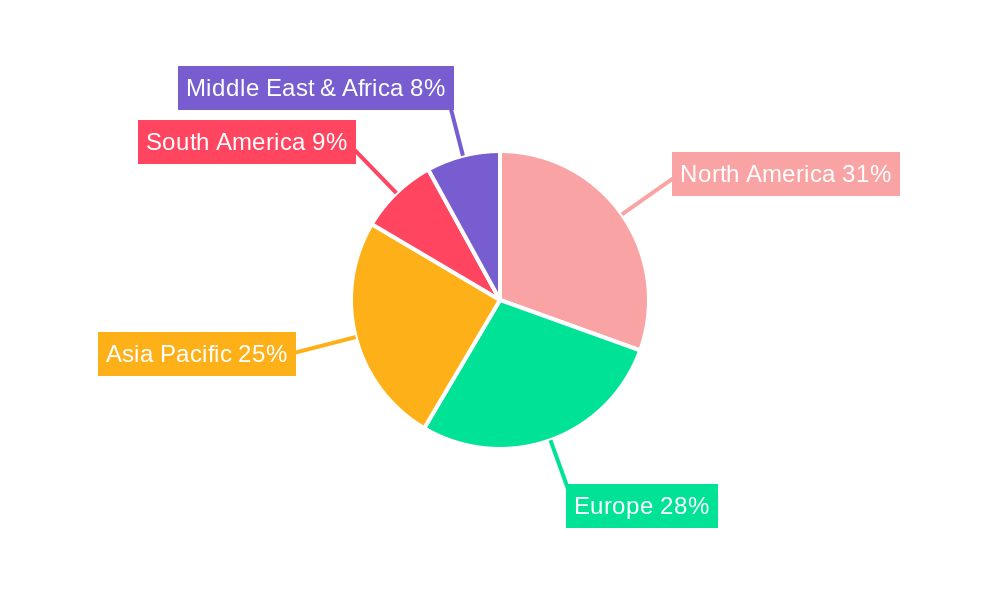
Key trends shaping the on-board power converter market include the continuous innovation in power conversion technologies, focusing on higher efficiency, miniaturization, and enhanced thermal management. The demand for compact and lightweight converters that can withstand harsh automotive environments is also on the rise. Advanced features such as smart power management, overvoltage protection, and seamless integration with vehicle networks are becoming standard expectations. However, the market also faces challenges. The high cost of advanced components and stringent regulatory standards for electromagnetic compatibility (EMC) and safety can act as restraints. Additionally, intense competition among established players and emerging manufacturers, including Bestek, NFA, Cobra, Energizer, Duracell, and Magnum Energy, necessitates a focus on product differentiation and competitive pricing. Geographically, North America and Europe currently hold significant market shares due to their mature automotive industries and early adoption of advanced vehicle technologies, while the Asia Pacific region, particularly China and India, is poised for substantial growth due to its rapidly expanding automotive production and increasing vehicle penetration.
This comprehensive report delves into the dynamic global On Board Power Converter market, offering in-depth analysis and actionable insights for industry stakeholders. Covering the period from 2019 to 2033, with a base and estimated year of 2025 and a forecast period of 2025–2033, this report is an essential resource for understanding market trajectory, competitive landscape, and future growth opportunities. Our analysis encompasses crucial segments like Passenger Cars and Commercial Vehicles, and voltage types including 12V, 24V, 48V and Above, providing a granular view of market segmentation.
On Board Power Converter Market Dynamics & Concentration
The global On Board Power Converter market is characterized by moderate concentration, with leading players like Bestek, NFA, Cobra, and Kisae Technology holding significant market shares. Innovation in power management, efficiency improvements, and integration with advanced vehicle systems are key drivers fueling market expansion. Regulatory frameworks, particularly those concerning vehicle emissions and electrical safety standards, are increasingly shaping product development and market access. Product substitutes, such as centralized power distribution units and advanced battery management systems, pose a growing competitive challenge. End-user trends point towards a rising demand for higher power density, improved thermal management, and smart connectivity features in on-board power converters. Mergers and acquisitions (M&A) activities are anticipated to accelerate as companies seek to consolidate market positions, gain access to new technologies, and expand their global footprint. M&A deal counts are projected to see a steady increase, with an estimated XX deals annually during the forecast period, contributing to market consolidation and strategic partnerships. Market share of key players is estimated to range from xx% to xx% for the top five entities.
On Board Power Converter Industry Trends & Analysis
The On Board Power Converter industry is witnessing robust growth driven by the accelerating adoption of electric and hybrid vehicles across passenger cars and commercial vehicle segments. This surge is a direct consequence of stringent emission regulations and growing consumer awareness regarding environmental sustainability. Technological disruptions, including advancements in wide-bandgap semiconductor materials like Silicon Carbide (SiC) and Gallium Nitride (GaN), are enabling the development of highly efficient, compact, and lightweight on-board power converters. These innovations translate into improved vehicle range and faster charging capabilities, directly impacting consumer preferences. The increasing complexity of in-vehicle electrical architectures, supporting advanced driver-assistance systems (ADAS), infotainment, and connectivity features, further amplifies the demand for sophisticated power conversion solutions. Competitive dynamics are intensifying, with established automotive component suppliers and emerging technology firms vying for market dominance. The market penetration of advanced on-board power converters is projected to reach xx% by 2033. The Compound Annual Growth Rate (CAGR) for the on-board power converter market is estimated at xx% over the forecast period. Key market growth drivers include the electrification of transportation fleets, the expansion of charging infrastructure, and the continuous pursuit of energy efficiency in automotive applications. Furthermore, government incentives and subsidies aimed at promoting EV adoption are providing a significant tailwind to market expansion.
Leading Markets & Segments in On Board Power Converter
The Passenger Cars segment is projected to dominate the global On Board Power Converter market, driven by the overwhelming demand for electric vehicles (EVs) and hybrid electric vehicles (HEVs) in this category. The increasing disposable income, coupled with evolving consumer preferences towards sustainable transportation, is a significant economic policy influencing this dominance. Furthermore, the rapid expansion of charging infrastructure and government initiatives promoting EV adoption in key automotive markets like North America and Europe are critical drivers. Within the Passenger Cars segment, the 12V and 24V on-board power converters are expected to witness substantial growth, catering to the diverse power needs of various automotive sub-systems. However, the 48V and Above segment is poised for exponential growth as vehicle architectures evolve to accommodate higher power demands for propulsion and auxiliary systems.
- Dominant Application Segment: Passenger Cars:
- Key Drivers: Growing EV and HEV sales, government incentives for EV adoption, and expanding charging infrastructure.
- Economic Policies: Subsidies, tax credits, and stringent emission standards.
- Consumer Preferences: Demand for longer range, faster charging, and advanced in-car technology.
- Infrastructure Development: Proliferation of charging stations facilitating wider EV adoption.
- Dominant Voltage Type Segment: 12V and 24V (with strong growth in 48V and Above):
- Key Drivers: Established use in existing vehicle systems, catering to auxiliary components, and the emerging trend of 48V mild-hybrid systems.
- Technological Advancements: Miniaturization, higher efficiency, and improved thermal management in these voltage categories.
- Market Penetration: Wide adoption across various vehicle models and price points.
On Board Power Converter Product Developments
Recent product developments in the On Board Power Converter market are focused on enhancing power density, improving energy efficiency, and integrating intelligent control features. Innovations in SiC and GaN semiconductor technology are enabling the creation of smaller, lighter, and more robust converters capable of handling higher voltages and currents. These advancements are crucial for meeting the evolving power demands of electric vehicles, from powering auxiliary systems to enabling bidirectional charging capabilities. Competitive advantages are being gained through advanced thermal management solutions, increased reliability, and seamless integration with vehicle powertrains and battery management systems.
Key Drivers of On Board Power Converter Growth
The On Board Power Converter market is primarily driven by the accelerating global shift towards electric and hybrid vehicles, spurred by stringent emission regulations and government incentives promoting sustainable transportation. The increasing adoption of advanced in-vehicle technologies, such as sophisticated infotainment systems, ADAS, and connectivity features, necessitates robust and efficient power conversion solutions. Technological advancements in semiconductor materials like SiC and GaN are enabling the development of more compact, efficient, and higher-power-density converters, directly impacting vehicle performance and range. Economic factors, including falling battery costs and rising fuel prices, further incentivize the adoption of electric powertrains, thereby boosting demand for on-board power converters.
Challenges in the On Board Power Converter Market
Despite robust growth, the On Board Power Converter market faces several challenges. High initial development costs and the need for extensive testing and validation for automotive applications can be significant barriers. Fluctuations in raw material prices, particularly for critical components like semiconductors, can impact profitability and supply chain stability. Intense competition among established players and emerging manufacturers can lead to price pressures and a need for continuous innovation to maintain market share. Furthermore, the evolving regulatory landscape, while driving adoption, can also introduce compliance complexities and require ongoing adaptation of product designs.
Emerging Opportunities in On Board Power Converter
Emerging opportunities in the On Board Power Converter market are largely driven by the continued electrification of the automotive industry and the expansion of smart vehicle functionalities. The development of highly integrated power modules that combine multiple conversion functions presents a significant growth avenue. The increasing demand for vehicle-to-grid (V2G) and vehicle-to-home (V2H) capabilities opens up new markets for bidirectional power converters. Strategic partnerships between power electronics manufacturers and automotive OEMs are crucial for co-developing next-generation solutions tailored to specific vehicle platforms. Furthermore, the expansion of the aftermarket for EV charging solutions and ancillary power systems represents a substantial untapped opportunity.
Leading Players in the On Board Power Converter Sector
- Bestek
- NFA
- Cobra
- Kisae Technology
- Rally
- Energizer
- Duracell
- Meind
- Stanley
- Exeltech
- Cotek
- Samlex
- Power Bright
- Go Power
- Wagan Tech
- Magnum Energy
- WEHO
- Erayak
Key Milestones in On Board Power Converter Industry
- 2019: Increased adoption of 48V mild-hybrid systems, driving demand for associated power converters.
- 2020: Significant advancements in SiC and GaN semiconductor technology, enabling higher efficiency and smaller form factors.
- 2021: Growing regulatory pressure for CO2 emissions reduction accelerates EV adoption and demand for advanced power electronics.
- 2022: Key automotive OEMs announce ambitious EV production targets, signaling future growth for the on-board power converter market.
- 2023: Increased investment in charging infrastructure globally, supporting the expansion of the EV market.
- 2024: Introduction of more integrated power modules combining multiple power conversion functions.
- 2025 (Estimated): Expected surge in demand for bidirectional on-board power converters for V2G and V2H applications.
Strategic Outlook for On Board Power Converter Market
The strategic outlook for the On Board Power Converter market is overwhelmingly positive, driven by the sustained trajectory of vehicle electrification and the continuous evolution of automotive technologies. Companies that focus on innovation in efficiency, miniaturization, and intelligent power management will likely gain a competitive edge. Strategic partnerships with automotive manufacturers will be crucial for securing long-term supply contracts and co-developing customized solutions. The exploration of new applications, such as auxiliary power for autonomous driving systems and advanced thermal management solutions, will further accelerate market growth. Investing in R&D for next-generation power electronics and establishing robust supply chains will be paramount for sustained success in this dynamic sector.
On Board Power Converter Segmentation
-
1. Application
- 1.1. Passenger Cars
- 1.2. Commercial Vehicles
-
2. Type
- 2.1. 12V
- 2.2. 24V
- 2.3. 48V and Above
On Board Power Converter Segmentation By Geography
-
1. North America
- 1.1. United States
- 1.2. Canada
- 1.3. Mexico
-
2. South America
- 2.1. Brazil
- 2.2. Argentina
- 2.3. Rest of South America
-
3. Europe
- 3.1. United Kingdom
- 3.2. Germany
- 3.3. France
- 3.4. Italy
- 3.5. Spain
- 3.6. Russia
- 3.7. Benelux
- 3.8. Nordics
- 3.9. Rest of Europe
-
4. Middle East & Africa
- 4.1. Turkey
- 4.2. Israel
- 4.3. GCC
- 4.4. North Africa
- 4.5. South Africa
- 4.6. Rest of Middle East & Africa
-
5. Asia Pacific
- 5.1. China
- 5.2. India
- 5.3. Japan
- 5.4. South Korea
- 5.5. ASEAN
- 5.6. Oceania
- 5.7. Rest of Asia Pacific
On Board Power Converter REPORT HIGHLIGHTS
| Aspects | Details |
|---|---|
| Study Period | 2019-2033 |
| Base Year | 2024 |
| Estimated Year | 2025 |
| Forecast Period | 2025-2033 |
| Historical Period | 2019-2024 |
| Growth Rate | CAGR of XXX% from 2019-2033 |
| Segmentation |
|
Table of Contents
- 1. Introduction
- 1.1. Research Scope
- 1.2. Market Segmentation
- 1.3. Research Methodology
- 1.4. Definitions and Assumptions
- 2. Executive Summary
- 2.1. Introduction
- 3. Market Dynamics
- 3.1. Introduction
- 3.2. Market Drivers
- 3.3. Market Restrains
- 3.4. Market Trends
- 4. Market Factor Analysis
- 4.1. Porters Five Forces
- 4.2. Supply/Value Chain
- 4.3. PESTEL analysis
- 4.4. Market Entropy
- 4.5. Patent/Trademark Analysis
- 5. Global On Board Power Converter Analysis, Insights and Forecast, 2019-2031
- 5.1. Market Analysis, Insights and Forecast - by Application
- 5.1.1. Passenger Cars
- 5.1.2. Commercial Vehicles
- 5.2. Market Analysis, Insights and Forecast - by Type
- 5.2.1. 12V
- 5.2.2. 24V
- 5.2.3. 48V and Above
- 5.3. Market Analysis, Insights and Forecast - by Region
- 5.3.1. North America
- 5.3.2. South America
- 5.3.3. Europe
- 5.3.4. Middle East & Africa
- 5.3.5. Asia Pacific
- 5.1. Market Analysis, Insights and Forecast - by Application
- 6. North America On Board Power Converter Analysis, Insights and Forecast, 2019-2031
- 6.1. Market Analysis, Insights and Forecast - by Application
- 6.1.1. Passenger Cars
- 6.1.2. Commercial Vehicles
- 6.2. Market Analysis, Insights and Forecast - by Type
- 6.2.1. 12V
- 6.2.2. 24V
- 6.2.3. 48V and Above
- 6.1. Market Analysis, Insights and Forecast - by Application
- 7. South America On Board Power Converter Analysis, Insights and Forecast, 2019-2031
- 7.1. Market Analysis, Insights and Forecast - by Application
- 7.1.1. Passenger Cars
- 7.1.2. Commercial Vehicles
- 7.2. Market Analysis, Insights and Forecast - by Type
- 7.2.1. 12V
- 7.2.2. 24V
- 7.2.3. 48V and Above
- 7.1. Market Analysis, Insights and Forecast - by Application
- 8. Europe On Board Power Converter Analysis, Insights and Forecast, 2019-2031
- 8.1. Market Analysis, Insights and Forecast - by Application
- 8.1.1. Passenger Cars
- 8.1.2. Commercial Vehicles
- 8.2. Market Analysis, Insights and Forecast - by Type
- 8.2.1. 12V
- 8.2.2. 24V
- 8.2.3. 48V and Above
- 8.1. Market Analysis, Insights and Forecast - by Application
- 9. Middle East & Africa On Board Power Converter Analysis, Insights and Forecast, 2019-2031
- 9.1. Market Analysis, Insights and Forecast - by Application
- 9.1.1. Passenger Cars
- 9.1.2. Commercial Vehicles
- 9.2. Market Analysis, Insights and Forecast - by Type
- 9.2.1. 12V
- 9.2.2. 24V
- 9.2.3. 48V and Above
- 9.1. Market Analysis, Insights and Forecast - by Application
- 10. Asia Pacific On Board Power Converter Analysis, Insights and Forecast, 2019-2031
- 10.1. Market Analysis, Insights and Forecast - by Application
- 10.1.1. Passenger Cars
- 10.1.2. Commercial Vehicles
- 10.2. Market Analysis, Insights and Forecast - by Type
- 10.2.1. 12V
- 10.2.2. 24V
- 10.2.3. 48V and Above
- 10.1. Market Analysis, Insights and Forecast - by Application
- 11. Competitive Analysis
- 11.1. Global Market Share Analysis 2024
- 11.2. Company Profiles
- 11.2.1 Bestek
- 11.2.1.1. Overview
- 11.2.1.2. Products
- 11.2.1.3. SWOT Analysis
- 11.2.1.4. Recent Developments
- 11.2.1.5. Financials (Based on Availability)
- 11.2.2 NFA
- 11.2.2.1. Overview
- 11.2.2.2. Products
- 11.2.2.3. SWOT Analysis
- 11.2.2.4. Recent Developments
- 11.2.2.5. Financials (Based on Availability)
- 11.2.3 Cobra
- 11.2.3.1. Overview
- 11.2.3.2. Products
- 11.2.3.3. SWOT Analysis
- 11.2.3.4. Recent Developments
- 11.2.3.5. Financials (Based on Availability)
- 11.2.4 Kisae Technology
- 11.2.4.1. Overview
- 11.2.4.2. Products
- 11.2.4.3. SWOT Analysis
- 11.2.4.4. Recent Developments
- 11.2.4.5. Financials (Based on Availability)
- 11.2.5 Rally
- 11.2.5.1. Overview
- 11.2.5.2. Products
- 11.2.5.3. SWOT Analysis
- 11.2.5.4. Recent Developments
- 11.2.5.5. Financials (Based on Availability)
- 11.2.6 Energizer
- 11.2.6.1. Overview
- 11.2.6.2. Products
- 11.2.6.3. SWOT Analysis
- 11.2.6.4. Recent Developments
- 11.2.6.5. Financials (Based on Availability)
- 11.2.7 Duracell
- 11.2.7.1. Overview
- 11.2.7.2. Products
- 11.2.7.3. SWOT Analysis
- 11.2.7.4. Recent Developments
- 11.2.7.5. Financials (Based on Availability)
- 11.2.8 Meind
- 11.2.8.1. Overview
- 11.2.8.2. Products
- 11.2.8.3. SWOT Analysis
- 11.2.8.4. Recent Developments
- 11.2.8.5. Financials (Based on Availability)
- 11.2.9 Stanley
- 11.2.9.1. Overview
- 11.2.9.2. Products
- 11.2.9.3. SWOT Analysis
- 11.2.9.4. Recent Developments
- 11.2.9.5. Financials (Based on Availability)
- 11.2.10 Exeltech
- 11.2.10.1. Overview
- 11.2.10.2. Products
- 11.2.10.3. SWOT Analysis
- 11.2.10.4. Recent Developments
- 11.2.10.5. Financials (Based on Availability)
- 11.2.11 Cotek
- 11.2.11.1. Overview
- 11.2.11.2. Products
- 11.2.11.3. SWOT Analysis
- 11.2.11.4. Recent Developments
- 11.2.11.5. Financials (Based on Availability)
- 11.2.12 Samlex
- 11.2.12.1. Overview
- 11.2.12.2. Products
- 11.2.12.3. SWOT Analysis
- 11.2.12.4. Recent Developments
- 11.2.12.5. Financials (Based on Availability)
- 11.2.13 Power Bright
- 11.2.13.1. Overview
- 11.2.13.2. Products
- 11.2.13.3. SWOT Analysis
- 11.2.13.4. Recent Developments
- 11.2.13.5. Financials (Based on Availability)
- 11.2.14 Go Power
- 11.2.14.1. Overview
- 11.2.14.2. Products
- 11.2.14.3. SWOT Analysis
- 11.2.14.4. Recent Developments
- 11.2.14.5. Financials (Based on Availability)
- 11.2.15 Wagan Tech
- 11.2.15.1. Overview
- 11.2.15.2. Products
- 11.2.15.3. SWOT Analysis
- 11.2.15.4. Recent Developments
- 11.2.15.5. Financials (Based on Availability)
- 11.2.16 Magnum Energy
- 11.2.16.1. Overview
- 11.2.16.2. Products
- 11.2.16.3. SWOT Analysis
- 11.2.16.4. Recent Developments
- 11.2.16.5. Financials (Based on Availability)
- 11.2.17 WEHO
- 11.2.17.1. Overview
- 11.2.17.2. Products
- 11.2.17.3. SWOT Analysis
- 11.2.17.4. Recent Developments
- 11.2.17.5. Financials (Based on Availability)
- 11.2.18 Erayak
- 11.2.18.1. Overview
- 11.2.18.2. Products
- 11.2.18.3. SWOT Analysis
- 11.2.18.4. Recent Developments
- 11.2.18.5. Financials (Based on Availability)
- 11.2.1 Bestek
List of Figures
- Figure 1: Global On Board Power Converter Revenue Breakdown (million, %) by Region 2024 & 2032
- Figure 2: Global On Board Power Converter Volume Breakdown (K, %) by Region 2024 & 2032
- Figure 3: North America On Board Power Converter Revenue (million), by Application 2024 & 2032
- Figure 4: North America On Board Power Converter Volume (K), by Application 2024 & 2032
- Figure 5: North America On Board Power Converter Revenue Share (%), by Application 2024 & 2032
- Figure 6: North America On Board Power Converter Volume Share (%), by Application 2024 & 2032
- Figure 7: North America On Board Power Converter Revenue (million), by Type 2024 & 2032
- Figure 8: North America On Board Power Converter Volume (K), by Type 2024 & 2032
- Figure 9: North America On Board Power Converter Revenue Share (%), by Type 2024 & 2032
- Figure 10: North America On Board Power Converter Volume Share (%), by Type 2024 & 2032
- Figure 11: North America On Board Power Converter Revenue (million), by Country 2024 & 2032
- Figure 12: North America On Board Power Converter Volume (K), by Country 2024 & 2032
- Figure 13: North America On Board Power Converter Revenue Share (%), by Country 2024 & 2032
- Figure 14: North America On Board Power Converter Volume Share (%), by Country 2024 & 2032
- Figure 15: South America On Board Power Converter Revenue (million), by Application 2024 & 2032
- Figure 16: South America On Board Power Converter Volume (K), by Application 2024 & 2032
- Figure 17: South America On Board Power Converter Revenue Share (%), by Application 2024 & 2032
- Figure 18: South America On Board Power Converter Volume Share (%), by Application 2024 & 2032
- Figure 19: South America On Board Power Converter Revenue (million), by Type 2024 & 2032
- Figure 20: South America On Board Power Converter Volume (K), by Type 2024 & 2032
- Figure 21: South America On Board Power Converter Revenue Share (%), by Type 2024 & 2032
- Figure 22: South America On Board Power Converter Volume Share (%), by Type 2024 & 2032
- Figure 23: South America On Board Power Converter Revenue (million), by Country 2024 & 2032
- Figure 24: South America On Board Power Converter Volume (K), by Country 2024 & 2032
- Figure 25: South America On Board Power Converter Revenue Share (%), by Country 2024 & 2032
- Figure 26: South America On Board Power Converter Volume Share (%), by Country 2024 & 2032
- Figure 27: Europe On Board Power Converter Revenue (million), by Application 2024 & 2032
- Figure 28: Europe On Board Power Converter Volume (K), by Application 2024 & 2032
- Figure 29: Europe On Board Power Converter Revenue Share (%), by Application 2024 & 2032
- Figure 30: Europe On Board Power Converter Volume Share (%), by Application 2024 & 2032
- Figure 31: Europe On Board Power Converter Revenue (million), by Type 2024 & 2032
- Figure 32: Europe On Board Power Converter Volume (K), by Type 2024 & 2032
- Figure 33: Europe On Board Power Converter Revenue Share (%), by Type 2024 & 2032
- Figure 34: Europe On Board Power Converter Volume Share (%), by Type 2024 & 2032
- Figure 35: Europe On Board Power Converter Revenue (million), by Country 2024 & 2032
- Figure 36: Europe On Board Power Converter Volume (K), by Country 2024 & 2032
- Figure 37: Europe On Board Power Converter Revenue Share (%), by Country 2024 & 2032
- Figure 38: Europe On Board Power Converter Volume Share (%), by Country 2024 & 2032
- Figure 39: Middle East & Africa On Board Power Converter Revenue (million), by Application 2024 & 2032
- Figure 40: Middle East & Africa On Board Power Converter Volume (K), by Application 2024 & 2032
- Figure 41: Middle East & Africa On Board Power Converter Revenue Share (%), by Application 2024 & 2032
- Figure 42: Middle East & Africa On Board Power Converter Volume Share (%), by Application 2024 & 2032
- Figure 43: Middle East & Africa On Board Power Converter Revenue (million), by Type 2024 & 2032
- Figure 44: Middle East & Africa On Board Power Converter Volume (K), by Type 2024 & 2032
- Figure 45: Middle East & Africa On Board Power Converter Revenue Share (%), by Type 2024 & 2032
- Figure 46: Middle East & Africa On Board Power Converter Volume Share (%), by Type 2024 & 2032
- Figure 47: Middle East & Africa On Board Power Converter Revenue (million), by Country 2024 & 2032
- Figure 48: Middle East & Africa On Board Power Converter Volume (K), by Country 2024 & 2032
- Figure 49: Middle East & Africa On Board Power Converter Revenue Share (%), by Country 2024 & 2032
- Figure 50: Middle East & Africa On Board Power Converter Volume Share (%), by Country 2024 & 2032
- Figure 51: Asia Pacific On Board Power Converter Revenue (million), by Application 2024 & 2032
- Figure 52: Asia Pacific On Board Power Converter Volume (K), by Application 2024 & 2032
- Figure 53: Asia Pacific On Board Power Converter Revenue Share (%), by Application 2024 & 2032
- Figure 54: Asia Pacific On Board Power Converter Volume Share (%), by Application 2024 & 2032
- Figure 55: Asia Pacific On Board Power Converter Revenue (million), by Type 2024 & 2032
- Figure 56: Asia Pacific On Board Power Converter Volume (K), by Type 2024 & 2032
- Figure 57: Asia Pacific On Board Power Converter Revenue Share (%), by Type 2024 & 2032
- Figure 58: Asia Pacific On Board Power Converter Volume Share (%), by Type 2024 & 2032
- Figure 59: Asia Pacific On Board Power Converter Revenue (million), by Country 2024 & 2032
- Figure 60: Asia Pacific On Board Power Converter Volume (K), by Country 2024 & 2032
- Figure 61: Asia Pacific On Board Power Converter Revenue Share (%), by Country 2024 & 2032
- Figure 62: Asia Pacific On Board Power Converter Volume Share (%), by Country 2024 & 2032
List of Tables
- Table 1: Global On Board Power Converter Revenue million Forecast, by Region 2019 & 2032
- Table 2: Global On Board Power Converter Volume K Forecast, by Region 2019 & 2032
- Table 3: Global On Board Power Converter Revenue million Forecast, by Application 2019 & 2032
- Table 4: Global On Board Power Converter Volume K Forecast, by Application 2019 & 2032
- Table 5: Global On Board Power Converter Revenue million Forecast, by Type 2019 & 2032
- Table 6: Global On Board Power Converter Volume K Forecast, by Type 2019 & 2032
- Table 7: Global On Board Power Converter Revenue million Forecast, by Region 2019 & 2032
- Table 8: Global On Board Power Converter Volume K Forecast, by Region 2019 & 2032
- Table 9: Global On Board Power Converter Revenue million Forecast, by Application 2019 & 2032
- Table 10: Global On Board Power Converter Volume K Forecast, by Application 2019 & 2032
- Table 11: Global On Board Power Converter Revenue million Forecast, by Type 2019 & 2032
- Table 12: Global On Board Power Converter Volume K Forecast, by Type 2019 & 2032
- Table 13: Global On Board Power Converter Revenue million Forecast, by Country 2019 & 2032
- Table 14: Global On Board Power Converter Volume K Forecast, by Country 2019 & 2032
- Table 15: United States On Board Power Converter Revenue (million) Forecast, by Application 2019 & 2032
- Table 16: United States On Board Power Converter Volume (K) Forecast, by Application 2019 & 2032
- Table 17: Canada On Board Power Converter Revenue (million) Forecast, by Application 2019 & 2032
- Table 18: Canada On Board Power Converter Volume (K) Forecast, by Application 2019 & 2032
- Table 19: Mexico On Board Power Converter Revenue (million) Forecast, by Application 2019 & 2032
- Table 20: Mexico On Board Power Converter Volume (K) Forecast, by Application 2019 & 2032
- Table 21: Global On Board Power Converter Revenue million Forecast, by Application 2019 & 2032
- Table 22: Global On Board Power Converter Volume K Forecast, by Application 2019 & 2032
- Table 23: Global On Board Power Converter Revenue million Forecast, by Type 2019 & 2032
- Table 24: Global On Board Power Converter Volume K Forecast, by Type 2019 & 2032
- Table 25: Global On Board Power Converter Revenue million Forecast, by Country 2019 & 2032
- Table 26: Global On Board Power Converter Volume K Forecast, by Country 2019 & 2032
- Table 27: Brazil On Board Power Converter Revenue (million) Forecast, by Application 2019 & 2032
- Table 28: Brazil On Board Power Converter Volume (K) Forecast, by Application 2019 & 2032
- Table 29: Argentina On Board Power Converter Revenue (million) Forecast, by Application 2019 & 2032
- Table 30: Argentina On Board Power Converter Volume (K) Forecast, by Application 2019 & 2032
- Table 31: Rest of South America On Board Power Converter Revenue (million) Forecast, by Application 2019 & 2032
- Table 32: Rest of South America On Board Power Converter Volume (K) Forecast, by Application 2019 & 2032
- Table 33: Global On Board Power Converter Revenue million Forecast, by Application 2019 & 2032
- Table 34: Global On Board Power Converter Volume K Forecast, by Application 2019 & 2032
- Table 35: Global On Board Power Converter Revenue million Forecast, by Type 2019 & 2032
- Table 36: Global On Board Power Converter Volume K Forecast, by Type 2019 & 2032
- Table 37: Global On Board Power Converter Revenue million Forecast, by Country 2019 & 2032
- Table 38: Global On Board Power Converter Volume K Forecast, by Country 2019 & 2032
- Table 39: United Kingdom On Board Power Converter Revenue (million) Forecast, by Application 2019 & 2032
- Table 40: United Kingdom On Board Power Converter Volume (K) Forecast, by Application 2019 & 2032
- Table 41: Germany On Board Power Converter Revenue (million) Forecast, by Application 2019 & 2032
- Table 42: Germany On Board Power Converter Volume (K) Forecast, by Application 2019 & 2032
- Table 43: France On Board Power Converter Revenue (million) Forecast, by Application 2019 & 2032
- Table 44: France On Board Power Converter Volume (K) Forecast, by Application 2019 & 2032
- Table 45: Italy On Board Power Converter Revenue (million) Forecast, by Application 2019 & 2032
- Table 46: Italy On Board Power Converter Volume (K) Forecast, by Application 2019 & 2032
- Table 47: Spain On Board Power Converter Revenue (million) Forecast, by Application 2019 & 2032
- Table 48: Spain On Board Power Converter Volume (K) Forecast, by Application 2019 & 2032
- Table 49: Russia On Board Power Converter Revenue (million) Forecast, by Application 2019 & 2032
- Table 50: Russia On Board Power Converter Volume (K) Forecast, by Application 2019 & 2032
- Table 51: Benelux On Board Power Converter Revenue (million) Forecast, by Application 2019 & 2032
- Table 52: Benelux On Board Power Converter Volume (K) Forecast, by Application 2019 & 2032
- Table 53: Nordics On Board Power Converter Revenue (million) Forecast, by Application 2019 & 2032
- Table 54: Nordics On Board Power Converter Volume (K) Forecast, by Application 2019 & 2032
- Table 55: Rest of Europe On Board Power Converter Revenue (million) Forecast, by Application 2019 & 2032
- Table 56: Rest of Europe On Board Power Converter Volume (K) Forecast, by Application 2019 & 2032
- Table 57: Global On Board Power Converter Revenue million Forecast, by Application 2019 & 2032
- Table 58: Global On Board Power Converter Volume K Forecast, by Application 2019 & 2032
- Table 59: Global On Board Power Converter Revenue million Forecast, by Type 2019 & 2032
- Table 60: Global On Board Power Converter Volume K Forecast, by Type 2019 & 2032
- Table 61: Global On Board Power Converter Revenue million Forecast, by Country 2019 & 2032
- Table 62: Global On Board Power Converter Volume K Forecast, by Country 2019 & 2032
- Table 63: Turkey On Board Power Converter Revenue (million) Forecast, by Application 2019 & 2032
- Table 64: Turkey On Board Power Converter Volume (K) Forecast, by Application 2019 & 2032
- Table 65: Israel On Board Power Converter Revenue (million) Forecast, by Application 2019 & 2032
- Table 66: Israel On Board Power Converter Volume (K) Forecast, by Application 2019 & 2032
- Table 67: GCC On Board Power Converter Revenue (million) Forecast, by Application 2019 & 2032
- Table 68: GCC On Board Power Converter Volume (K) Forecast, by Application 2019 & 2032
- Table 69: North Africa On Board Power Converter Revenue (million) Forecast, by Application 2019 & 2032
- Table 70: North Africa On Board Power Converter Volume (K) Forecast, by Application 2019 & 2032
- Table 71: South Africa On Board Power Converter Revenue (million) Forecast, by Application 2019 & 2032
- Table 72: South Africa On Board Power Converter Volume (K) Forecast, by Application 2019 & 2032
- Table 73: Rest of Middle East & Africa On Board Power Converter Revenue (million) Forecast, by Application 2019 & 2032
- Table 74: Rest of Middle East & Africa On Board Power Converter Volume (K) Forecast, by Application 2019 & 2032
- Table 75: Global On Board Power Converter Revenue million Forecast, by Application 2019 & 2032
- Table 76: Global On Board Power Converter Volume K Forecast, by Application 2019 & 2032
- Table 77: Global On Board Power Converter Revenue million Forecast, by Type 2019 & 2032
- Table 78: Global On Board Power Converter Volume K Forecast, by Type 2019 & 2032
- Table 79: Global On Board Power Converter Revenue million Forecast, by Country 2019 & 2032
- Table 80: Global On Board Power Converter Volume K Forecast, by Country 2019 & 2032
- Table 81: China On Board Power Converter Revenue (million) Forecast, by Application 2019 & 2032
- Table 82: China On Board Power Converter Volume (K) Forecast, by Application 2019 & 2032
- Table 83: India On Board Power Converter Revenue (million) Forecast, by Application 2019 & 2032
- Table 84: India On Board Power Converter Volume (K) Forecast, by Application 2019 & 2032
- Table 85: Japan On Board Power Converter Revenue (million) Forecast, by Application 2019 & 2032
- Table 86: Japan On Board Power Converter Volume (K) Forecast, by Application 2019 & 2032
- Table 87: South Korea On Board Power Converter Revenue (million) Forecast, by Application 2019 & 2032
- Table 88: South Korea On Board Power Converter Volume (K) Forecast, by Application 2019 & 2032
- Table 89: ASEAN On Board Power Converter Revenue (million) Forecast, by Application 2019 & 2032
- Table 90: ASEAN On Board Power Converter Volume (K) Forecast, by Application 2019 & 2032
- Table 91: Oceania On Board Power Converter Revenue (million) Forecast, by Application 2019 & 2032
- Table 92: Oceania On Board Power Converter Volume (K) Forecast, by Application 2019 & 2032
- Table 93: Rest of Asia Pacific On Board Power Converter Revenue (million) Forecast, by Application 2019 & 2032
- Table 94: Rest of Asia Pacific On Board Power Converter Volume (K) Forecast, by Application 2019 & 2032
Frequently Asked Questions
1. What is the projected Compound Annual Growth Rate (CAGR) of the On Board Power Converter?
The projected CAGR is approximately XXX%.
2. Which companies are prominent players in the On Board Power Converter?
Key companies in the market include Bestek, NFA, Cobra, Kisae Technology, Rally, Energizer, Duracell, Meind, Stanley, Exeltech, Cotek, Samlex, Power Bright, Go Power, Wagan Tech, Magnum Energy, WEHO, Erayak.
3. What are the main segments of the On Board Power Converter?
The market segments include Application, Type.
4. Can you provide details about the market size?
The market size is estimated to be USD XXX million as of 2022.
5. What are some drivers contributing to market growth?
N/A
6. What are the notable trends driving market growth?
N/A
7. Are there any restraints impacting market growth?
N/A
8. Can you provide examples of recent developments in the market?
N/A
9. What pricing options are available for accessing the report?
Pricing options include single-user, multi-user, and enterprise licenses priced at USD 3950.00, USD 5925.00, and USD 7900.00 respectively.
10. Is the market size provided in terms of value or volume?
The market size is provided in terms of value, measured in million and volume, measured in K.
11. Are there any specific market keywords associated with the report?
Yes, the market keyword associated with the report is "On Board Power Converter," which aids in identifying and referencing the specific market segment covered.
12. How do I determine which pricing option suits my needs best?
The pricing options vary based on user requirements and access needs. Individual users may opt for single-user licenses, while businesses requiring broader access may choose multi-user or enterprise licenses for cost-effective access to the report.
13. Are there any additional resources or data provided in the On Board Power Converter report?
While the report offers comprehensive insights, it's advisable to review the specific contents or supplementary materials provided to ascertain if additional resources or data are available.
14. How can I stay updated on further developments or reports in the On Board Power Converter?
To stay informed about further developments, trends, and reports in the On Board Power Converter, consider subscribing to industry newsletters, following relevant companies and organizations, or regularly checking reputable industry news sources and publications.
Methodology
Step 1 - Identification of Relevant Samples Size from Population Database


Step 2 - Approaches for Defining Global Market Size (Value, Volume* & Price*)

Note*: In applicable scenarios
Step 3 - Data Sources
Primary Research
- Web Analytics
- Survey Reports
- Research Institute
- Latest Research Reports
- Opinion Leaders
Secondary Research
- Annual Reports
- White Paper
- Latest Press Release
- Industry Association
- Paid Database
- Investor Presentations

Step 4 - Data Triangulation
Involves using different sources of information in order to increase the validity of a study
These sources are likely to be stakeholders in a program - participants, other researchers, program staff, other community members, and so on.
Then we put all data in single framework & apply various statistical tools to find out the dynamic on the market.
During the analysis stage, feedback from the stakeholder groups would be compared to determine areas of agreement as well as areas of divergence
