

Key Insights
The non-invasive aesthetic treatments market is experiencing robust growth, driven by increasing consumer demand for minimally invasive procedures with quick recovery times. A CAGR of 12% from 2019-2033 signifies a substantial expansion, fueled by factors such as rising disposable incomes, increased awareness of aesthetic procedures through social media, and advancements in technology leading to safer and more effective treatments. The market is segmented by procedure type, with injectable treatments (like Botox and fillers), skin rejuvenation (laser treatments, microdermabrasion), non-surgical fat removal (e.g., cryolipolysis), and sclerotherapy leading the way. End-users include hospitals, clinics, and medical spas, each contributing differently to the overall market share, with clinics and medical spas likely experiencing faster growth due to their accessibility and focus on non-invasive options. North America and Europe currently dominate the market due to high adoption rates and advanced medical infrastructure; however, Asia Pacific is projected to witness significant growth in the coming years due to rising awareness and increasing disposable incomes in developing economies within the region. Competition is intense, with major players like Syneron Candela, Hologic Inc, Lumenis, and others vying for market share through technological innovation and strategic partnerships.
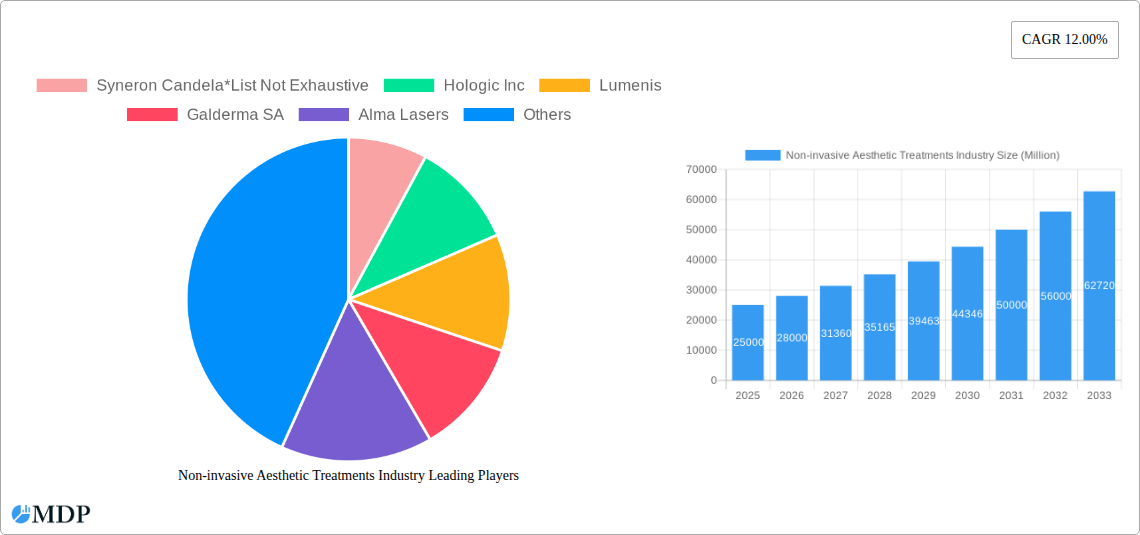
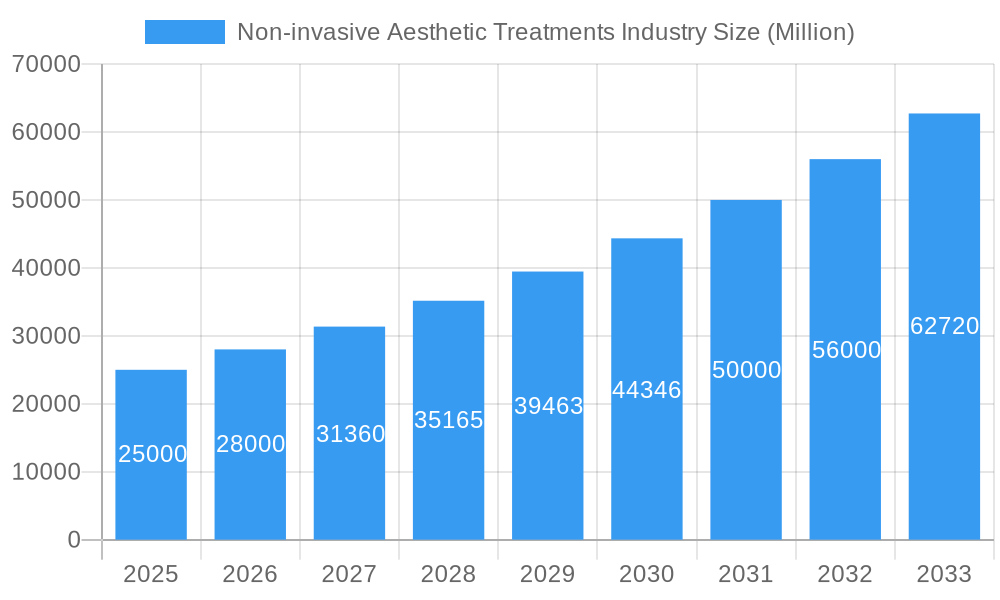
Non-invasive Aesthetic Treatments Industry Market Size (In Billion)
The forecast period (2025-2033) indicates continued expansion, driven by the introduction of innovative technologies, increasing demand for personalized treatments, and a shift towards preventative aesthetic care. Growth will likely be further propelled by an aging global population increasingly seeking to maintain a youthful appearance. While certain restraints, such as regulatory hurdles and potential side effects of certain treatments, may exist, the overall market trajectory remains positive. The market's segmentation offers opportunities for specialized players to focus on niche treatments and cater to specific demographics. The continued evolution of technology, coupled with escalating consumer awareness and demand, positions the non-invasive aesthetic treatments market for significant and sustained future growth.
Non-invasive Aesthetic Treatments Industry Company Market Share
Non-Invasive Aesthetic Treatments Industry Market Report: 2019-2033
This comprehensive report provides a detailed analysis of the non-invasive aesthetic treatments industry, covering market dynamics, trends, leading players, and future growth prospects. The study period spans from 2019 to 2033, with 2025 serving as the base and estimated year. The forecast period extends from 2025 to 2033, while the historical period encompasses 2019-2024. The market is valued at xx Million in 2025 and is projected to reach xx Million by 2033, exhibiting a CAGR of xx% during the forecast period. This report is an indispensable resource for industry stakeholders, investors, and market entrants seeking a clear understanding of this dynamic and rapidly evolving sector.
Non-invasive Aesthetic Treatments Industry Market Dynamics & Concentration
The non-invasive aesthetic treatments market is characterized by moderate concentration, with several key players holding significant market share. Syneron Candela, Hologic Inc, Lumenis, Galderma SA, Alma Lasers, Johnson & Johnson, AbbVie Inc (Allergen Inc), Bausch Health Companies Inc, and Merz Pharma are among the leading companies, although the market also includes numerous smaller players and new entrants. Market share data for 2024 shows Syneron Candela holding approximately xx% market share, followed by Galderma SA with xx%, and Johnson & Johnson with xx%. The remaining share is distributed amongst other players.
Innovation plays a crucial role, driven by the demand for advanced, minimally invasive procedures. Stringent regulatory frameworks, particularly from agencies like the FDA, influence product approvals and market entry. The industry witnesses constant development of product substitutes, leading to competitive pricing and innovation pressure. End-user preferences are shifting towards non-surgical options, fueling market growth. Mergers and acquisitions (M&A) activity in the industry has been moderate, with approximately xx M&A deals recorded between 2019 and 2024, primarily focused on expanding product portfolios and geographical reach.
Non-invasive Aesthetic Treatments Industry Industry Trends & Analysis
The non-invasive aesthetic treatments market is experiencing robust growth, driven by several key factors. Rising disposable incomes, increased awareness of aesthetic procedures, and advancements in technology are contributing significantly to market expansion. Technological disruptions, particularly in radiofrequency, laser, and ultrasound technologies, are enhancing procedure efficacy and safety, further boosting adoption. Consumer preferences are shifting towards personalized treatments with minimal downtime, which is stimulating innovation in minimally invasive procedures. The competitive landscape is characterized by intense competition, with companies focusing on product differentiation, technological advancements, and strategic partnerships to maintain market share. The market penetration of non-invasive procedures is increasing steadily, especially amongst younger demographics.
Leading Markets & Segments in Non-invasive Aesthetic Treatments Industry
North America currently dominates the global non-invasive aesthetic treatments market, followed by Europe and Asia Pacific. Within North America, the United States represents the largest market, driven by high disposable incomes, advanced medical infrastructure, and high consumer awareness. Key drivers in this region include favorable economic policies supporting the healthcare sector and a well-established network of medical spas and clinics.
By Procedures:
- Injectable Treatments: This segment holds the largest market share due to the high demand for wrinkle fillers and facial volumizers.
- Skin Rejuvenation: This segment is experiencing significant growth due to increasing concerns about aging and skin imperfections.
- Non-surgical Fat Removal: Advancements in technologies like cryolipolysis and ultrasound cavitation are driving growth in this segment.
- Sclerotherapy: This segment enjoys consistent demand, albeit smaller than the other major segments.
- Other Procedures: This category includes a diverse range of treatments, with varying growth trajectories.
By End Users:
- Medical Spas: This segment is expanding rapidly due to increased accessibility and affordability.
- Clinics: Clinics remain a significant market segment due to their specialized expertise and comprehensive treatment options.
- Hospitals: Hospitals represent a smaller portion of the market but play a crucial role in providing advanced procedures.
Non-invasive Aesthetic Treatments Industry Product Developments
Recent product innovations focus on enhanced efficacy, reduced downtime, and improved patient comfort. Companies are developing devices with advanced features like real-time imaging and personalized treatment settings. The market is witnessing a surge in minimally invasive procedures and combination treatments that offer comprehensive aesthetic solutions. Technological trends such as artificial intelligence (AI) and machine learning are being integrated to personalize treatment plans and optimize outcomes. New products are strategically designed to target specific market segments and address unmet needs.
Key Drivers of Non-invasive Aesthetic Treatments Industry Growth
Technological advancements in energy-based devices and injectables are key growth drivers. Rising disposable incomes and increased consumer awareness of aesthetic procedures are also fueling market expansion. Favorable regulatory environments and supportive healthcare policies in several regions further stimulate growth. The increasing preference for non-invasive alternatives to surgical procedures also contributes significantly.
Challenges in the Non-invasive Aesthetic Treatments Industry Market
Stringent regulatory requirements for product approvals pose a significant challenge. Supply chain disruptions can impact the availability of raw materials and devices. The high cost of advanced technologies can limit access for some consumers. Intense competition from established players and new entrants creates price pressure and necessitates continuous innovation. The xx Million market size for non-invasive procedures in 2025 is influenced by these factors.
Emerging Opportunities in Non-invasive Aesthetic Treatments Industry
Technological breakthroughs in areas such as AI-powered diagnostics and personalized treatments present significant opportunities. Strategic partnerships between device manufacturers and aesthetic clinics can expand market reach and accessibility. Expansion into emerging markets with growing middle-class populations and rising disposable incomes presents lucrative potential for long-term growth.
Leading Players in the Non-invasive Aesthetic Treatments Industry Sector
- Syneron Candela
- Hologic Inc
- Lumenis
- Galderma SA
- Alma Lasers
- Johnson & Johnson
- AbbVie Inc (Allergen Inc)
- Bausch Health Companies Inc
- Merz Pharma
Key Milestones in Non-invasive Aesthetic Treatments Industry Industry
- July 2020: Solta Medical launched the Thermage FLX system, a radiofrequency device for non-invasive skin tightening. This launch expanded treatment options and increased competition in the skin rejuvenation segment.
- May 2020: The FDA approved Galderma's Restylane Kysse, a hyaluronic acid-based filler for lip augmentation and perioral rhytids. This approval broadened the range of available injectable treatments.
Strategic Outlook for Non-invasive Aesthetic Treatments Industry Market
The non-invasive aesthetic treatments market is poised for substantial growth in the coming years, driven by continuous technological innovations, increasing consumer demand, and expansion into new markets. Strategic partnerships, investments in R&D, and targeted marketing initiatives will play a pivotal role in shaping the future of the industry. Companies focusing on personalized treatments, minimally invasive techniques, and enhanced patient experience will have a competitive edge. The market exhibits strong potential for expansion and presents attractive opportunities for both established players and new entrants.
Non-invasive Aesthetic Treatments Industry Segmentation
-
1. Procedures
- 1.1. Injectable
- 1.2. Skin Rejuvanation
- 1.3. Non-surgical Fat Removal
- 1.4. Sclerotherapy
- 1.5. Other Procedures
-
2. End Users
- 2.1. Hospitals
- 2.2. Clinics
- 2.3. Medical Spa
Non-invasive Aesthetic Treatments Industry Segmentation By Geography
-
1. North America
- 1.1. United States
- 1.2. Canada
- 1.3. Mexico
-
2. Europe
- 2.1. Germany
- 2.2. United Kingdom
- 2.3. France
- 2.4. Italy
- 2.5. Spain
- 2.6. Rest of Europe
-
3. Asia Pacific
- 3.1. China
- 3.2. Japan
- 3.3. India
- 3.4. Australia
- 3.5. South Korea
- 3.6. Rest of Asia Pacific
-
4. Middle East and Africa
- 4.1. GCC
- 4.2. South Africa
- 4.3. Rest of Middle East and Africa
-
5. South America
- 5.1. Brazil
- 5.2. Argentina
- 5.3. Rest of South America
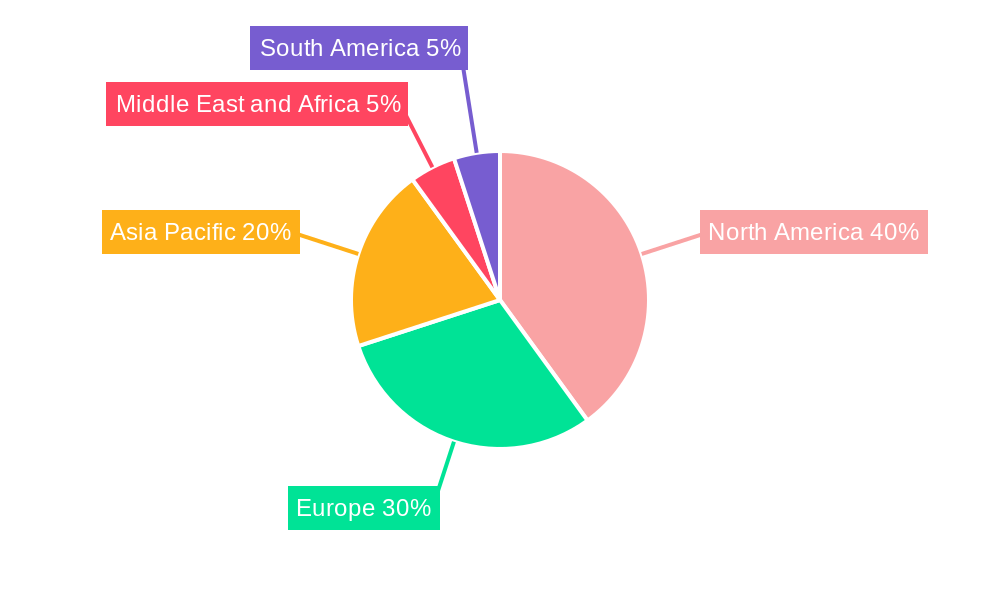
Non-invasive Aesthetic Treatments Industry Regional Market Share
Geographic Coverage of Non-invasive Aesthetic Treatments Industry
Non-invasive Aesthetic Treatments Industry REPORT HIGHLIGHTS
| Aspects | Details |
|---|---|
| Study Period | 2020-2034 |
| Base Year | 2025 |
| Estimated Year | 2026 |
| Forecast Period | 2026-2034 |
| Historical Period | 2020-2025 |
| Growth Rate | CAGR of 12.00% from 2020-2034 |
| Segmentation |
|
Table of Contents
- 1. Introduction
- 1.1. Research Scope
- 1.2. Market Segmentation
- 1.3. Research Objective
- 1.4. Definitions and Assumptions
- 2. Executive Summary
- 2.1. Market Snapshot
- 3. Market Dynamics
- 3.1. Market Drivers
- 3.2. Market Restrains
- 3.3. Market Trends
- 3.4. Market Opportunities
- 4. Market Factor Analysis
- 4.1. Porters Five Forces
- 4.1.1. Bargaining Power of Suppliers
- 4.1.2. Bargaining Power of Buyers
- 4.1.3. Threat of New Entrants
- 4.1.4. Threat of Substitutes
- 4.1.5. Competitive Rivalry
- 4.2. PESTEL analysis
- 4.3. BCG Analysis
- 4.3.1. Stars (High Growth, High Market Share)
- 4.3.2. Cash Cows (Low Growth, High Market Share)
- 4.3.3. Question Mark (High Growth, Low Market Share)
- 4.3.4. Dogs (Low Growth, Low Market Share)
- 4.4. Ansoff Matrix Analysis
- 4.5. Supply Chain Analysis
- 4.6. Regulatory Landscape
- 4.7. Current Market Potential and Opportunity Assessment (TAM–SAM–SOM Framework)
- 4.8. MDP Analyst Note
- 4.1. Porters Five Forces
- 5. Market Analysis, Insights and Forecast 2021-2033
- 5.1. Market Analysis, Insights and Forecast - by Procedures
- 5.1.1. Injectable
- 5.1.2. Skin Rejuvanation
- 5.1.3. Non-surgical Fat Removal
- 5.1.4. Sclerotherapy
- 5.1.5. Other Procedures
- 5.2. Market Analysis, Insights and Forecast - by End Users
- 5.2.1. Hospitals
- 5.2.2. Clinics
- 5.2.3. Medical Spa
- 5.3. Market Analysis, Insights and Forecast - by Region
- 5.3.1. North America
- 5.3.2. Europe
- 5.3.3. Asia Pacific
- 5.3.4. Middle East and Africa
- 5.3.5. South America
- 5.1. Market Analysis, Insights and Forecast - by Procedures
- 6. Global Non-invasive Aesthetic Treatments Industry Analysis, Insights and Forecast, 2021-2033
- 6.1. Market Analysis, Insights and Forecast - by Procedures
- 6.1.1. Injectable
- 6.1.2. Skin Rejuvanation
- 6.1.3. Non-surgical Fat Removal
- 6.1.4. Sclerotherapy
- 6.1.5. Other Procedures
- 6.2. Market Analysis, Insights and Forecast - by End Users
- 6.2.1. Hospitals
- 6.2.2. Clinics
- 6.2.3. Medical Spa
- 6.1. Market Analysis, Insights and Forecast - by Procedures
- 7. North America Non-invasive Aesthetic Treatments Industry Analysis, Insights and Forecast, 2020-2032
- 7.1. Market Analysis, Insights and Forecast - by Procedures
- 7.1.1. Injectable
- 7.1.2. Skin Rejuvanation
- 7.1.3. Non-surgical Fat Removal
- 7.1.4. Sclerotherapy
- 7.1.5. Other Procedures
- 7.2. Market Analysis, Insights and Forecast - by End Users
- 7.2.1. Hospitals
- 7.2.2. Clinics
- 7.2.3. Medical Spa
- 7.1. Market Analysis, Insights and Forecast - by Procedures
- 8. Europe Non-invasive Aesthetic Treatments Industry Analysis, Insights and Forecast, 2020-2032
- 8.1. Market Analysis, Insights and Forecast - by Procedures
- 8.1.1. Injectable
- 8.1.2. Skin Rejuvanation
- 8.1.3. Non-surgical Fat Removal
- 8.1.4. Sclerotherapy
- 8.1.5. Other Procedures
- 8.2. Market Analysis, Insights and Forecast - by End Users
- 8.2.1. Hospitals
- 8.2.2. Clinics
- 8.2.3. Medical Spa
- 8.1. Market Analysis, Insights and Forecast - by Procedures
- 9. Asia Pacific Non-invasive Aesthetic Treatments Industry Analysis, Insights and Forecast, 2020-2032
- 9.1. Market Analysis, Insights and Forecast - by Procedures
- 9.1.1. Injectable
- 9.1.2. Skin Rejuvanation
- 9.1.3. Non-surgical Fat Removal
- 9.1.4. Sclerotherapy
- 9.1.5. Other Procedures
- 9.2. Market Analysis, Insights and Forecast - by End Users
- 9.2.1. Hospitals
- 9.2.2. Clinics
- 9.2.3. Medical Spa
- 9.1. Market Analysis, Insights and Forecast - by Procedures
- 10. Middle East and Africa Non-invasive Aesthetic Treatments Industry Analysis, Insights and Forecast, 2020-2032
- 10.1. Market Analysis, Insights and Forecast - by Procedures
- 10.1.1. Injectable
- 10.1.2. Skin Rejuvanation
- 10.1.3. Non-surgical Fat Removal
- 10.1.4. Sclerotherapy
- 10.1.5. Other Procedures
- 10.2. Market Analysis, Insights and Forecast - by End Users
- 10.2.1. Hospitals
- 10.2.2. Clinics
- 10.2.3. Medical Spa
- 10.1. Market Analysis, Insights and Forecast - by Procedures
- 11. South America Non-invasive Aesthetic Treatments Industry Analysis, Insights and Forecast, 2020-2032
- 11.1. Market Analysis, Insights and Forecast - by Procedures
- 11.1.1. Injectable
- 11.1.2. Skin Rejuvanation
- 11.1.3. Non-surgical Fat Removal
- 11.1.4. Sclerotherapy
- 11.1.5. Other Procedures
- 11.2. Market Analysis, Insights and Forecast - by End Users
- 11.2.1. Hospitals
- 11.2.2. Clinics
- 11.2.3. Medical Spa
- 11.1. Market Analysis, Insights and Forecast - by Procedures
- 12. Competitive Analysis
- 12.1. Company Profiles
- 12.1.1 Syneron Candela*List Not Exhaustive
- 12.1.1.1. Company Overview
- 12.1.1.2. Products
- 12.1.1.3. Company Financials
- 12.1.1.4. SWOT Analysis
- 12.1.2 Hologic Inc
- 12.1.2.1. Company Overview
- 12.1.2.2. Products
- 12.1.2.3. Company Financials
- 12.1.2.4. SWOT Analysis
- 12.1.3 Lumenis
- 12.1.3.1. Company Overview
- 12.1.3.2. Products
- 12.1.3.3. Company Financials
- 12.1.3.4. SWOT Analysis
- 12.1.4 Galderma SA
- 12.1.4.1. Company Overview
- 12.1.4.2. Products
- 12.1.4.3. Company Financials
- 12.1.4.4. SWOT Analysis
- 12.1.5 Alma Lasers
- 12.1.5.1. Company Overview
- 12.1.5.2. Products
- 12.1.5.3. Company Financials
- 12.1.5.4. SWOT Analysis
- 12.1.6 Johnson & Johnson
- 12.1.6.1. Company Overview
- 12.1.6.2. Products
- 12.1.6.3. Company Financials
- 12.1.6.4. SWOT Analysis
- 12.1.7 AbbVie Inc (Allergen Inc )
- 12.1.7.1. Company Overview
- 12.1.7.2. Products
- 12.1.7.3. Company Financials
- 12.1.7.4. SWOT Analysis
- 12.1.8 Bausch Health Companies Inc
- 12.1.8.1. Company Overview
- 12.1.8.2. Products
- 12.1.8.3. Company Financials
- 12.1.8.4. SWOT Analysis
- 12.1.9 Merz Pharma
- 12.1.9.1. Company Overview
- 12.1.9.2. Products
- 12.1.9.3. Company Financials
- 12.1.9.4. SWOT Analysis
- 12.1.1 Syneron Candela*List Not Exhaustive
- 12.2. Market Entropy
- 12.2.1 Company's Key Areas Served
- 12.2.2 Recent Developments
- 12.3. Company Market Share Analysis 2025
- 12.3.1 Top 5 Companies Market Share Analysis
- 12.3.2 Top 3 Companies Market Share Analysis
- 12.4. List of Potential Customers
- 13. Research Methodology
List of Figures
- Figure 1: Global Non-invasive Aesthetic Treatments Industry Revenue Breakdown (Million, %) by Region 2025 & 2033
- Figure 2: North America Non-invasive Aesthetic Treatments Industry Revenue (Million), by Procedures 2025 & 2033
- Figure 3: North America Non-invasive Aesthetic Treatments Industry Revenue Share (%), by Procedures 2025 & 2033
- Figure 4: North America Non-invasive Aesthetic Treatments Industry Revenue (Million), by End Users 2025 & 2033
- Figure 5: North America Non-invasive Aesthetic Treatments Industry Revenue Share (%), by End Users 2025 & 2033
- Figure 6: North America Non-invasive Aesthetic Treatments Industry Revenue (Million), by Country 2025 & 2033
- Figure 7: North America Non-invasive Aesthetic Treatments Industry Revenue Share (%), by Country 2025 & 2033
- Figure 8: Europe Non-invasive Aesthetic Treatments Industry Revenue (Million), by Procedures 2025 & 2033
- Figure 9: Europe Non-invasive Aesthetic Treatments Industry Revenue Share (%), by Procedures 2025 & 2033
- Figure 10: Europe Non-invasive Aesthetic Treatments Industry Revenue (Million), by End Users 2025 & 2033
- Figure 11: Europe Non-invasive Aesthetic Treatments Industry Revenue Share (%), by End Users 2025 & 2033
- Figure 12: Europe Non-invasive Aesthetic Treatments Industry Revenue (Million), by Country 2025 & 2033
- Figure 13: Europe Non-invasive Aesthetic Treatments Industry Revenue Share (%), by Country 2025 & 2033
- Figure 14: Asia Pacific Non-invasive Aesthetic Treatments Industry Revenue (Million), by Procedures 2025 & 2033
- Figure 15: Asia Pacific Non-invasive Aesthetic Treatments Industry Revenue Share (%), by Procedures 2025 & 2033
- Figure 16: Asia Pacific Non-invasive Aesthetic Treatments Industry Revenue (Million), by End Users 2025 & 2033
- Figure 17: Asia Pacific Non-invasive Aesthetic Treatments Industry Revenue Share (%), by End Users 2025 & 2033
- Figure 18: Asia Pacific Non-invasive Aesthetic Treatments Industry Revenue (Million), by Country 2025 & 2033
- Figure 19: Asia Pacific Non-invasive Aesthetic Treatments Industry Revenue Share (%), by Country 2025 & 2033
- Figure 20: Middle East and Africa Non-invasive Aesthetic Treatments Industry Revenue (Million), by Procedures 2025 & 2033
- Figure 21: Middle East and Africa Non-invasive Aesthetic Treatments Industry Revenue Share (%), by Procedures 2025 & 2033
- Figure 22: Middle East and Africa Non-invasive Aesthetic Treatments Industry Revenue (Million), by End Users 2025 & 2033
- Figure 23: Middle East and Africa Non-invasive Aesthetic Treatments Industry Revenue Share (%), by End Users 2025 & 2033
- Figure 24: Middle East and Africa Non-invasive Aesthetic Treatments Industry Revenue (Million), by Country 2025 & 2033
- Figure 25: Middle East and Africa Non-invasive Aesthetic Treatments Industry Revenue Share (%), by Country 2025 & 2033
- Figure 26: South America Non-invasive Aesthetic Treatments Industry Revenue (Million), by Procedures 2025 & 2033
- Figure 27: South America Non-invasive Aesthetic Treatments Industry Revenue Share (%), by Procedures 2025 & 2033
- Figure 28: South America Non-invasive Aesthetic Treatments Industry Revenue (Million), by End Users 2025 & 2033
- Figure 29: South America Non-invasive Aesthetic Treatments Industry Revenue Share (%), by End Users 2025 & 2033
- Figure 30: South America Non-invasive Aesthetic Treatments Industry Revenue (Million), by Country 2025 & 2033
- Figure 31: South America Non-invasive Aesthetic Treatments Industry Revenue Share (%), by Country 2025 & 2033
List of Tables
- Table 1: Global Non-invasive Aesthetic Treatments Industry Revenue Million Forecast, by Procedures 2020 & 2033
- Table 2: Global Non-invasive Aesthetic Treatments Industry Revenue Million Forecast, by End Users 2020 & 2033
- Table 3: Global Non-invasive Aesthetic Treatments Industry Revenue Million Forecast, by Region 2020 & 2033
- Table 4: Global Non-invasive Aesthetic Treatments Industry Revenue Million Forecast, by Procedures 2020 & 2033
- Table 5: Global Non-invasive Aesthetic Treatments Industry Revenue Million Forecast, by End Users 2020 & 2033
- Table 6: Global Non-invasive Aesthetic Treatments Industry Revenue Million Forecast, by Country 2020 & 2033
- Table 7: United States Non-invasive Aesthetic Treatments Industry Revenue (Million) Forecast, by Application 2020 & 2033
- Table 8: Canada Non-invasive Aesthetic Treatments Industry Revenue (Million) Forecast, by Application 2020 & 2033
- Table 9: Mexico Non-invasive Aesthetic Treatments Industry Revenue (Million) Forecast, by Application 2020 & 2033
- Table 10: Global Non-invasive Aesthetic Treatments Industry Revenue Million Forecast, by Procedures 2020 & 2033
- Table 11: Global Non-invasive Aesthetic Treatments Industry Revenue Million Forecast, by End Users 2020 & 2033
- Table 12: Global Non-invasive Aesthetic Treatments Industry Revenue Million Forecast, by Country 2020 & 2033
- Table 13: Germany Non-invasive Aesthetic Treatments Industry Revenue (Million) Forecast, by Application 2020 & 2033
- Table 14: United Kingdom Non-invasive Aesthetic Treatments Industry Revenue (Million) Forecast, by Application 2020 & 2033
- Table 15: France Non-invasive Aesthetic Treatments Industry Revenue (Million) Forecast, by Application 2020 & 2033
- Table 16: Italy Non-invasive Aesthetic Treatments Industry Revenue (Million) Forecast, by Application 2020 & 2033
- Table 17: Spain Non-invasive Aesthetic Treatments Industry Revenue (Million) Forecast, by Application 2020 & 2033
- Table 18: Rest of Europe Non-invasive Aesthetic Treatments Industry Revenue (Million) Forecast, by Application 2020 & 2033
- Table 19: Global Non-invasive Aesthetic Treatments Industry Revenue Million Forecast, by Procedures 2020 & 2033
- Table 20: Global Non-invasive Aesthetic Treatments Industry Revenue Million Forecast, by End Users 2020 & 2033
- Table 21: Global Non-invasive Aesthetic Treatments Industry Revenue Million Forecast, by Country 2020 & 2033
- Table 22: China Non-invasive Aesthetic Treatments Industry Revenue (Million) Forecast, by Application 2020 & 2033
- Table 23: Japan Non-invasive Aesthetic Treatments Industry Revenue (Million) Forecast, by Application 2020 & 2033
- Table 24: India Non-invasive Aesthetic Treatments Industry Revenue (Million) Forecast, by Application 2020 & 2033
- Table 25: Australia Non-invasive Aesthetic Treatments Industry Revenue (Million) Forecast, by Application 2020 & 2033
- Table 26: South Korea Non-invasive Aesthetic Treatments Industry Revenue (Million) Forecast, by Application 2020 & 2033
- Table 27: Rest of Asia Pacific Non-invasive Aesthetic Treatments Industry Revenue (Million) Forecast, by Application 2020 & 2033
- Table 28: Global Non-invasive Aesthetic Treatments Industry Revenue Million Forecast, by Procedures 2020 & 2033
- Table 29: Global Non-invasive Aesthetic Treatments Industry Revenue Million Forecast, by End Users 2020 & 2033
- Table 30: Global Non-invasive Aesthetic Treatments Industry Revenue Million Forecast, by Country 2020 & 2033
- Table 31: GCC Non-invasive Aesthetic Treatments Industry Revenue (Million) Forecast, by Application 2020 & 2033
- Table 32: South Africa Non-invasive Aesthetic Treatments Industry Revenue (Million) Forecast, by Application 2020 & 2033
- Table 33: Rest of Middle East and Africa Non-invasive Aesthetic Treatments Industry Revenue (Million) Forecast, by Application 2020 & 2033
- Table 34: Global Non-invasive Aesthetic Treatments Industry Revenue Million Forecast, by Procedures 2020 & 2033
- Table 35: Global Non-invasive Aesthetic Treatments Industry Revenue Million Forecast, by End Users 2020 & 2033
- Table 36: Global Non-invasive Aesthetic Treatments Industry Revenue Million Forecast, by Country 2020 & 2033
- Table 37: Brazil Non-invasive Aesthetic Treatments Industry Revenue (Million) Forecast, by Application 2020 & 2033
- Table 38: Argentina Non-invasive Aesthetic Treatments Industry Revenue (Million) Forecast, by Application 2020 & 2033
- Table 39: Rest of South America Non-invasive Aesthetic Treatments Industry Revenue (Million) Forecast, by Application 2020 & 2033
Frequently Asked Questions
1. What is the projected Compound Annual Growth Rate (CAGR) of the Non-invasive Aesthetic Treatments Industry?
The projected CAGR is approximately 12.00%.
2. Which companies are prominent players in the Non-invasive Aesthetic Treatments Industry?
Key companies in the market include Syneron Candela*List Not Exhaustive, Hologic Inc, Lumenis, Galderma SA, Alma Lasers, Johnson & Johnson, AbbVie Inc (Allergen Inc ), Bausch Health Companies Inc, Merz Pharma.
3. What are the main segments of the Non-invasive Aesthetic Treatments Industry?
The market segments include Procedures, End Users.
4. Can you provide details about the market size?
The market size is estimated to be USD XX Million as of 2022.
5. What are some drivers contributing to market growth?
Rise in Demand for Non-invasive Aesthetic Treatment Procedures; Technological Advancements.
6. What are the notable trends driving market growth?
Injectable Segment is Expected to Occupy a Significant Market Share Over the Forecast Period.
7. Are there any restraints impacting market growth?
Availability of Other Low Cost Beauty Product; Associated Complications and Clinical Risks.
8. Can you provide examples of recent developments in the market?
In July 2020, Solta Medical launched a new radiofrequency device for skin tightening non-invasively. The device is called the Thermage FLX system.
9. What pricing options are available for accessing the report?
Pricing options include single-user, multi-user, and enterprise licenses priced at USD 4750, USD 5250, and USD 8750 respectively.
10. Is the market size provided in terms of value or volume?
The market size is provided in terms of value, measured in Million.
11. Are there any specific market keywords associated with the report?
Yes, the market keyword associated with the report is "Non-invasive Aesthetic Treatments Industry," which aids in identifying and referencing the specific market segment covered.
12. How do I determine which pricing option suits my needs best?
The pricing options vary based on user requirements and access needs. Individual users may opt for single-user licenses, while businesses requiring broader access may choose multi-user or enterprise licenses for cost-effective access to the report.
13. Are there any additional resources or data provided in the Non-invasive Aesthetic Treatments Industry report?
While the report offers comprehensive insights, it's advisable to review the specific contents or supplementary materials provided to ascertain if additional resources or data are available.
14. How can I stay updated on further developments or reports in the Non-invasive Aesthetic Treatments Industry?
To stay informed about further developments, trends, and reports in the Non-invasive Aesthetic Treatments Industry, consider subscribing to industry newsletters, following relevant companies and organizations, or regularly checking reputable industry news sources and publications.
Methodology
Step 1 - Identification of Relevant Samples Size from Population Database


Step 2 - Approaches for Defining Global Market Size (Value, Volume* & Price*)

Note*: In applicable scenarios
Step 3 - Data Sources
Primary Research
- Web Analytics
- Survey Reports
- Research Institute
- Latest Research Reports
- Opinion Leaders
Secondary Research
- Annual Reports
- White Paper
- Latest Press Release
- Industry Association
- Paid Database
- Investor Presentations

Step 4 - Data Triangulation
Involves using different sources of information in order to increase the validity of a study
These sources are likely to be stakeholders in a program - participants, other researchers, program staff, other community members, and so on.
Then we put all data in single framework & apply various statistical tools to find out the dynamic on the market.
During the analysis stage, feedback from the stakeholder groups would be compared to determine areas of agreement as well as areas of divergence