

Key Insights
The New Chinese Tea Drinks market is poised for substantial expansion, projected to reach $2471.5 million by 2024, with a Compound Annual Growth Rate (CAGR) of 7.6% through 2033. This growth is propelled by shifting consumer demand towards healthier, premium beverage choices beyond traditional tea, featuring innovative flavors and high-quality ingredients. Key drivers include the popularity of milk and fruit tea, amplified by social media and influencer marketing. Enhanced accessibility through online sales channels, efficient delivery, and digital marketing further fuels market reach. Leading brands like Heytea, CoCo Fresh Tea & Juice, and Mixue Bingcheng are driving product innovation and geographic expansion. Increased disposable income in developing economies and the global adoption of modern tea culture also contribute to this market's dynamism.
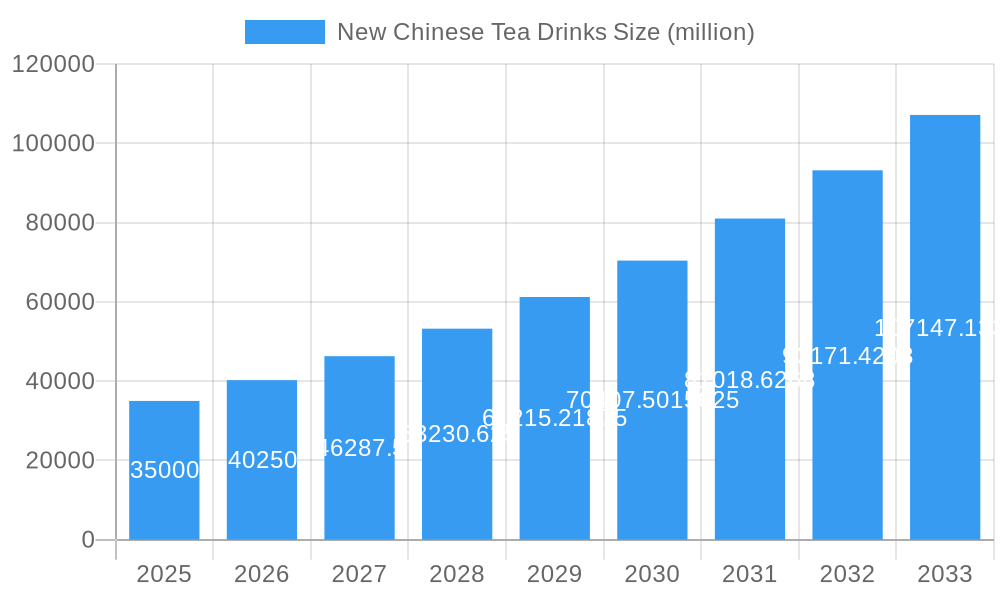
New Chinese Tea Drinks Market Size (In Billion)
Despite its growth trajectory, the market faces challenges including intense competition, potentially impacting profit margins, and the necessity of maintaining product quality across extensive distribution networks. Growing consumer awareness of sugar content and artificial ingredients requires a focus on healthier alternatives and ingredient transparency. The Asia Pacific region, led by China, remains the primary market due to its established tea culture and early adoption of new trends. However, North America and Europe present significant growth opportunities as they increasingly embrace New Chinese Tea Drinks, solidifying their global appeal.
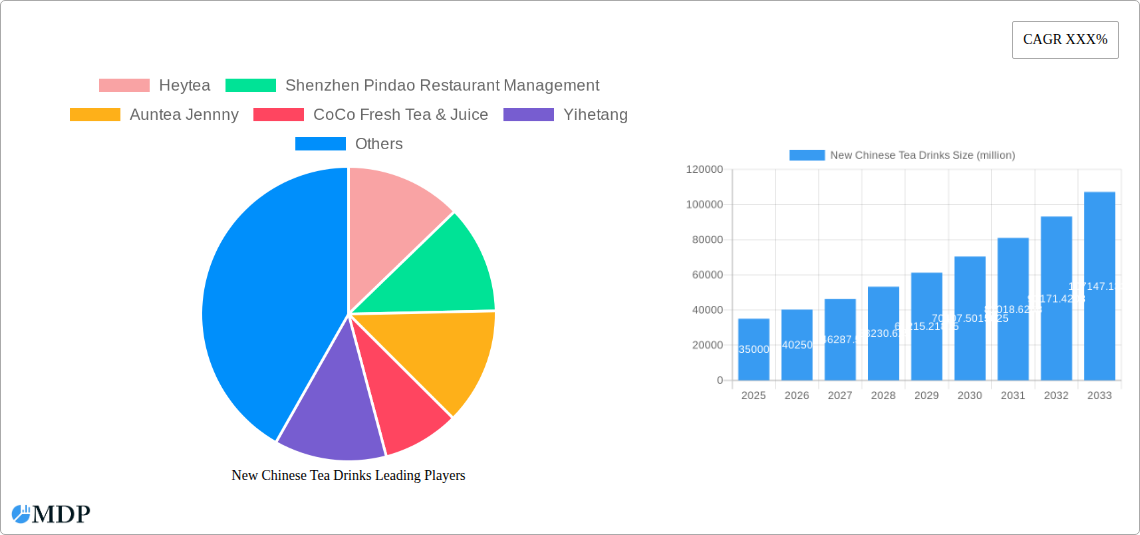
New Chinese Tea Drinks Company Market Share
New Chinese Tea Drinks: Market Dynamics, Trends, and Strategic Outlook 2019–2033
This comprehensive report delves into the burgeoning New Chinese Tea Drinks market, offering unparalleled insights for industry stakeholders. Analyzing a dynamic landscape shaped by innovation, evolving consumer preferences, and robust market growth, this report provides a detailed exploration of market dynamics, industry trends, leading segments, product developments, growth drivers, challenges, emerging opportunities, key players, historical milestones, and a strategic outlook for the forecast period 2025–2033. Our study encompasses the historical period of 2019–2024, with 2025 serving as the base and estimated year.
New Chinese Tea Drinks Market Dynamics & Concentration
The New Chinese Tea Drinks market exhibits a moderate to high concentration, with key players like Heytea, Shenzhen Pindao Restaurant Management, and Chabaidao dominating significant market share, estimated to be in the hundreds of millions in revenue. Innovation remains a primary driver, with brands continuously introducing novel flavors, ingredients, and store concepts to capture consumer attention. Regulatory frameworks, while evolving, generally favor market expansion, with a focus on food safety and quality standards. Product substitutes, such as traditional coffee beverages and other ready-to-drink options, pose a constant competitive threat, necessitating continuous differentiation. End-user trends are heavily influenced by a desire for premium ingredients, unique flavor profiles, and visually appealing products, often shared on social media platforms. Mergers and acquisitions (M&A) activity is anticipated to increase as larger entities seek to consolidate their market position and acquire innovative smaller brands. The number of M&A deals is projected to rise by over 50% within the forecast period, reflecting strategic consolidation.
New Chinese Tea Drinks Industry Trends & Analysis
The New Chinese Tea Drinks industry is experiencing a remarkable growth trajectory, driven by a confluence of factors. The market size is projected to reach several hundred million dollars by 2033, with a Compound Annual Growth Rate (CAGR) of approximately 15% during the forecast period. This expansion is fueled by a growing middle class in China and across Asia, with increasing disposable incomes leading to higher spending on premium beverages. Technological disruptions are playing a pivotal role, with advancements in brewing techniques, ingredient sourcing, and online ordering platforms significantly enhancing the consumer experience. The integration of AI in personalized drink recommendations and efficient supply chain management is becoming increasingly prevalent. Consumer preferences are shifting towards healthier options, with a demand for reduced sugar, natural ingredients, and functional additives like probiotics and vitamins. This has led to the rise of fruit teas and teas with herbal infusions. The competitive landscape is characterized by intense rivalry, with both established brands and new entrants vying for market share through aggressive marketing campaigns, product innovation, and strategic partnerships. Market penetration is expected to deepen significantly in emerging economies, extending beyond urban centers to tier-2 and tier-3 cities. The adoption of sustainable sourcing practices and eco-friendly packaging is also gaining traction, resonating with environmentally conscious consumers. Furthermore, the influence of social media trends and influencer marketing continues to shape product popularity and brand perception, with many new tea drink concepts going viral overnight. The overall industry is characterized by a dynamic and adaptive approach to meeting evolving consumer demands.
Leading Markets & Segments in New Chinese Tea Drinks
Offline Sales currently dominate the New Chinese Tea Drinks market, accounting for an estimated 80% of the total market value, reaching hundreds of millions of dollars. This dominance is underpinned by the experiential nature of these beverage outlets, offering consumers a social gathering space and a visually appealing environment. Key drivers for offline sales include:
- High Foot Traffic in Urban Centers: Major cities across China and Southeast Asia boast high population density and a thriving café culture, creating a constant stream of potential customers.
- Brand Experience and Ambiance: Companies like Heytea and CoCo Fresh Tea & Juice invest heavily in store design and customer service to create an immersive brand experience that encourages repeat visits.
- Impulse Purchases: The widespread availability of physical stores in high-traffic areas like shopping malls, transit hubs, and commercial districts facilitates impulse purchases.
However, Online Sales are experiencing rapid growth, projected to capture a substantial market share of over 20% by 2033. This segment is expected to grow at a CAGR exceeding 20%, driven by:
- Convenience and Accessibility: Delivery platforms offer unparalleled convenience, allowing consumers to enjoy their favorite tea drinks from the comfort of their homes or offices.
- Digital Marketing and Targeted Promotions: Online channels enable brands to reach a wider audience through targeted advertising, personalized offers, and loyalty programs.
- Expansion into Less Populated Areas: Online sales can overcome geographical limitations, reaching consumers in areas with fewer physical store locations.
In terms of Type, Milk Tea remains the leading segment, representing an estimated 60% of the market value, in the hundreds of millions of dollars. This enduring popularity is attributed to its comforting taste profile and wide range of flavor variations.
- Classic Flavors and Customization: Consumers are loyal to traditional milk tea flavors, and brands offer extensive customization options for sweetness, ice levels, and toppings.
- Nostalgia and Familiarity: Milk tea evokes a sense of nostalgia for many consumers, contributing to its consistent demand.
Fruit Tea is the fastest-growing segment, projected to grow at a CAGR of over 25% and capture an increasing market share by 2033. This growth is fueled by:
- Health Consciousness: The increasing demand for healthier beverage options, with lower sugar content and natural fruit flavors, has propelled fruit tea to the forefront.
- Innovation in Flavor Combinations: Brands are constantly experimenting with unique fruit pairings and seasonal offerings to attract new customers.
- Visual Appeal and Social Media Shareability: Vibrant colors and fresh fruit toppings make fruit teas highly Instagrammable, driving organic promotion.
New Chinese Tea Drinks Product Developments
Product innovation in the New Chinese Tea Drinks sector is relentless, focusing on premium ingredients, unique flavor fusions, and functional benefits. Companies are experimenting with diverse tea bases, exotic fruits, and artisanal toppings, moving beyond traditional milk and tapioca pearls. Technological advancements in cold-brewing techniques and flavor extraction are enhancing product quality and consistency. Competitive advantages are built through distinctive branding, visually appealing offerings, and a focus on health-conscious formulations. The market is witnessing a surge in probiotic-infused teas and teas incorporating adaptogens for wellness.
Key Drivers of New Chinese Tea Drinks Growth
The growth of the New Chinese Tea Drinks market is propelled by several key drivers. Technological advancements in beverage preparation and online delivery systems enhance accessibility and convenience. Economic growth in Asia, coupled with rising disposable incomes, fuels consumer spending on premium beverages. Evolving consumer preferences for healthier, innovative, and visually appealing drinks directly contribute to market expansion. Furthermore, favorable regulatory environments in many regions support industry growth by ensuring food safety and encouraging innovation. The increasing adoption of digitalization and e-commerce platforms allows for wider reach and more personalized marketing efforts.
Challenges in the New Chinese Tea Drinks Market
Despite its robust growth, the New Chinese Tea Drinks market faces several challenges. Intense competition from a multitude of brands, both established and emerging, leads to price pressures and necessitates continuous innovation to maintain market share. Fluctuations in raw material prices, particularly for tea leaves and fruits, can impact profit margins. Stringent food safety regulations and evolving compliance standards require significant investment in quality control and supply chain management. The increasing cost of real estate in prime urban locations poses a significant barrier for new store openings. Supply chain disruptions, as witnessed in recent global events, can affect ingredient availability and delivery times, impacting consumer satisfaction.
Emerging Opportunities in New Chinese Tea Drinks
Emerging opportunities in the New Chinese Tea Drinks market lie in several key areas. Technological breakthroughs in sustainable ingredient sourcing and advanced flavor encapsulation offer avenues for product differentiation. Strategic partnerships with food delivery platforms and complementary lifestyle brands can expand customer reach and brand visibility. Market expansion into untapped geographical regions, particularly in Southeast Asia and emerging economies, presents significant growth potential. The development of functional beverages catering to specific health needs, such as stress relief or improved digestion, represents a growing niche. Furthermore, leveraging AI for personalized recommendations and loyalty programs can foster deeper customer engagement and retention.
Leading Players in the New Chinese Tea Drinks Sector
- Heytea
- Shenzhen Pindao Restaurant Management
- Auntea Jennny
- CoCo Fresh Tea & Juice
- Yihetang
- Chabaidao
- Shuyisxc
- Zhengzhou Mixue Bingcheng
- DAKASI
- Alittle-tea
- Sexytea
- Peachful
Key Milestones in New Chinese Tea Drinks Industry
- 2019: Heytea pioneers the concept of premium cheese-topped tea, significantly influencing the market.
- 2020: CoCo Fresh Tea & Juice expands its international presence, establishing hundreds of new outlets globally.
- 2021: Shenzhen Pindao Restaurant Management introduces innovative fruit-infused tea blends, attracting a younger demographic.
- 2022: Chabaidao focuses on a diversified product portfolio, including healthy alternatives and limited-edition flavors, driving sales growth.
- 2023: Auntea Jennny launches a successful online campaign highlighting its artisanal tea sourcing and sustainable practices.
- 2024: Yihetang introduces smart vending machines in high-traffic areas, increasing accessibility and convenience.
- Ongoing: Continued investment in R&D for novel flavors and ingredients by all major players.
- Ongoing: Increasing adoption of eco-friendly packaging solutions across the industry.
Strategic Outlook for New Chinese Tea Drinks Market
The strategic outlook for the New Chinese Tea Drinks market remains exceptionally positive. Growth accelerators include the sustained demand for innovative and customizable beverage experiences, driven by a young and affluent consumer base. The increasing penetration of online sales channels, coupled with advancements in delivery logistics, will further broaden market reach. Brands that prioritize health-conscious formulations, embrace sustainable practices, and leverage digital marketing effectively are poised for significant success. Strategic investments in market diversification, product innovation, and building strong brand loyalty will be crucial for navigating the competitive landscape and capitalizing on the vast opportunities within this dynamic sector.
New Chinese Tea Drinks Segmentation
-
1. Application
- 1.1. Online Sales
- 1.2. Offline Sales
-
2. Type
- 2.1. Milk Tea
- 2.2. Fruit Tea
New Chinese Tea Drinks Segmentation By Geography
-
1. North America
- 1.1. United States
- 1.2. Canada
- 1.3. Mexico
-
2. South America
- 2.1. Brazil
- 2.2. Argentina
- 2.3. Rest of South America
-
3. Europe
- 3.1. United Kingdom
- 3.2. Germany
- 3.3. France
- 3.4. Italy
- 3.5. Spain
- 3.6. Russia
- 3.7. Benelux
- 3.8. Nordics
- 3.9. Rest of Europe
-
4. Middle East & Africa
- 4.1. Turkey
- 4.2. Israel
- 4.3. GCC
- 4.4. North Africa
- 4.5. South Africa
- 4.6. Rest of Middle East & Africa
-
5. Asia Pacific
- 5.1. China
- 5.2. India
- 5.3. Japan
- 5.4. South Korea
- 5.5. ASEAN
- 5.6. Oceania
- 5.7. Rest of Asia Pacific
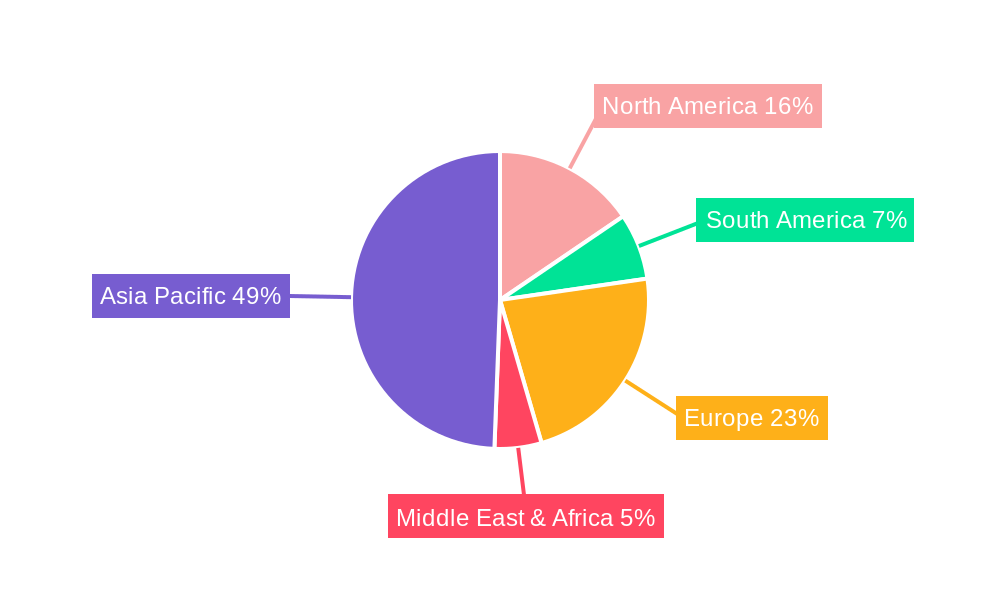
New Chinese Tea Drinks Regional Market Share
Geographic Coverage of New Chinese Tea Drinks
New Chinese Tea Drinks REPORT HIGHLIGHTS
| Aspects | Details |
|---|---|
| Study Period | 2020-2034 |
| Base Year | 2025 |
| Estimated Year | 2026 |
| Forecast Period | 2026-2034 |
| Historical Period | 2020-2025 |
| Growth Rate | CAGR of 7.6% from 2020-2034 |
| Segmentation |
|
Table of Contents
- 1. Introduction
- 1.1. Research Scope
- 1.2. Market Segmentation
- 1.3. Research Methodology
- 1.4. Definitions and Assumptions
- 2. Executive Summary
- 2.1. Introduction
- 3. Market Dynamics
- 3.1. Introduction
- 3.2. Market Drivers
- 3.3. Market Restrains
- 3.4. Market Trends
- 4. Market Factor Analysis
- 4.1. Porters Five Forces
- 4.2. Supply/Value Chain
- 4.3. PESTEL analysis
- 4.4. Market Entropy
- 4.5. Patent/Trademark Analysis
- 5. Global New Chinese Tea Drinks Analysis, Insights and Forecast, 2020-2032
- 5.1. Market Analysis, Insights and Forecast - by Application
- 5.1.1. Online Sales
- 5.1.2. Offline Sales
- 5.2. Market Analysis, Insights and Forecast - by Type
- 5.2.1. Milk Tea
- 5.2.2. Fruit Tea
- 5.3. Market Analysis, Insights and Forecast - by Region
- 5.3.1. North America
- 5.3.2. South America
- 5.3.3. Europe
- 5.3.4. Middle East & Africa
- 5.3.5. Asia Pacific
- 5.1. Market Analysis, Insights and Forecast - by Application
- 6. North America New Chinese Tea Drinks Analysis, Insights and Forecast, 2020-2032
- 6.1. Market Analysis, Insights and Forecast - by Application
- 6.1.1. Online Sales
- 6.1.2. Offline Sales
- 6.2. Market Analysis, Insights and Forecast - by Type
- 6.2.1. Milk Tea
- 6.2.2. Fruit Tea
- 6.1. Market Analysis, Insights and Forecast - by Application
- 7. South America New Chinese Tea Drinks Analysis, Insights and Forecast, 2020-2032
- 7.1. Market Analysis, Insights and Forecast - by Application
- 7.1.1. Online Sales
- 7.1.2. Offline Sales
- 7.2. Market Analysis, Insights and Forecast - by Type
- 7.2.1. Milk Tea
- 7.2.2. Fruit Tea
- 7.1. Market Analysis, Insights and Forecast - by Application
- 8. Europe New Chinese Tea Drinks Analysis, Insights and Forecast, 2020-2032
- 8.1. Market Analysis, Insights and Forecast - by Application
- 8.1.1. Online Sales
- 8.1.2. Offline Sales
- 8.2. Market Analysis, Insights and Forecast - by Type
- 8.2.1. Milk Tea
- 8.2.2. Fruit Tea
- 8.1. Market Analysis, Insights and Forecast - by Application
- 9. Middle East & Africa New Chinese Tea Drinks Analysis, Insights and Forecast, 2020-2032
- 9.1. Market Analysis, Insights and Forecast - by Application
- 9.1.1. Online Sales
- 9.1.2. Offline Sales
- 9.2. Market Analysis, Insights and Forecast - by Type
- 9.2.1. Milk Tea
- 9.2.2. Fruit Tea
- 9.1. Market Analysis, Insights and Forecast - by Application
- 10. Asia Pacific New Chinese Tea Drinks Analysis, Insights and Forecast, 2020-2032
- 10.1. Market Analysis, Insights and Forecast - by Application
- 10.1.1. Online Sales
- 10.1.2. Offline Sales
- 10.2. Market Analysis, Insights and Forecast - by Type
- 10.2.1. Milk Tea
- 10.2.2. Fruit Tea
- 10.1. Market Analysis, Insights and Forecast - by Application
- 11. Competitive Analysis
- 11.1. Global Market Share Analysis 2025
- 11.2. Company Profiles
- 11.2.1 Heytea
- 11.2.1.1. Overview
- 11.2.1.2. Products
- 11.2.1.3. SWOT Analysis
- 11.2.1.4. Recent Developments
- 11.2.1.5. Financials (Based on Availability)
- 11.2.2 Shenzhen Pindao Restaurant Management
- 11.2.2.1. Overview
- 11.2.2.2. Products
- 11.2.2.3. SWOT Analysis
- 11.2.2.4. Recent Developments
- 11.2.2.5. Financials (Based on Availability)
- 11.2.3 Auntea Jennny
- 11.2.3.1. Overview
- 11.2.3.2. Products
- 11.2.3.3. SWOT Analysis
- 11.2.3.4. Recent Developments
- 11.2.3.5. Financials (Based on Availability)
- 11.2.4 CoCo Fresh Tea & Juice
- 11.2.4.1. Overview
- 11.2.4.2. Products
- 11.2.4.3. SWOT Analysis
- 11.2.4.4. Recent Developments
- 11.2.4.5. Financials (Based on Availability)
- 11.2.5 Yihetang
- 11.2.5.1. Overview
- 11.2.5.2. Products
- 11.2.5.3. SWOT Analysis
- 11.2.5.4. Recent Developments
- 11.2.5.5. Financials (Based on Availability)
- 11.2.6 Chabaidao
- 11.2.6.1. Overview
- 11.2.6.2. Products
- 11.2.6.3. SWOT Analysis
- 11.2.6.4. Recent Developments
- 11.2.6.5. Financials (Based on Availability)
- 11.2.7 Shuyisxc
- 11.2.7.1. Overview
- 11.2.7.2. Products
- 11.2.7.3. SWOT Analysis
- 11.2.7.4. Recent Developments
- 11.2.7.5. Financials (Based on Availability)
- 11.2.8 Zhengzhou Mixue Bingcheng
- 11.2.8.1. Overview
- 11.2.8.2. Products
- 11.2.8.3. SWOT Analysis
- 11.2.8.4. Recent Developments
- 11.2.8.5. Financials (Based on Availability)
- 11.2.9 DAKASI
- 11.2.9.1. Overview
- 11.2.9.2. Products
- 11.2.9.3. SWOT Analysis
- 11.2.9.4. Recent Developments
- 11.2.9.5. Financials (Based on Availability)
- 11.2.10 Alittle-tea
- 11.2.10.1. Overview
- 11.2.10.2. Products
- 11.2.10.3. SWOT Analysis
- 11.2.10.4. Recent Developments
- 11.2.10.5. Financials (Based on Availability)
- 11.2.11 Sexytea
- 11.2.11.1. Overview
- 11.2.11.2. Products
- 11.2.11.3. SWOT Analysis
- 11.2.11.4. Recent Developments
- 11.2.11.5. Financials (Based on Availability)
- 11.2.12 Peachful
- 11.2.12.1. Overview
- 11.2.12.2. Products
- 11.2.12.3. SWOT Analysis
- 11.2.12.4. Recent Developments
- 11.2.12.5. Financials (Based on Availability)
- 11.2.1 Heytea
List of Figures
- Figure 1: Global New Chinese Tea Drinks Revenue Breakdown (million, %) by Region 2025 & 2033
- Figure 2: Global New Chinese Tea Drinks Volume Breakdown (K, %) by Region 2025 & 2033
- Figure 3: North America New Chinese Tea Drinks Revenue (million), by Application 2025 & 2033
- Figure 4: North America New Chinese Tea Drinks Volume (K), by Application 2025 & 2033
- Figure 5: North America New Chinese Tea Drinks Revenue Share (%), by Application 2025 & 2033
- Figure 6: North America New Chinese Tea Drinks Volume Share (%), by Application 2025 & 2033
- Figure 7: North America New Chinese Tea Drinks Revenue (million), by Type 2025 & 2033
- Figure 8: North America New Chinese Tea Drinks Volume (K), by Type 2025 & 2033
- Figure 9: North America New Chinese Tea Drinks Revenue Share (%), by Type 2025 & 2033
- Figure 10: North America New Chinese Tea Drinks Volume Share (%), by Type 2025 & 2033
- Figure 11: North America New Chinese Tea Drinks Revenue (million), by Country 2025 & 2033
- Figure 12: North America New Chinese Tea Drinks Volume (K), by Country 2025 & 2033
- Figure 13: North America New Chinese Tea Drinks Revenue Share (%), by Country 2025 & 2033
- Figure 14: North America New Chinese Tea Drinks Volume Share (%), by Country 2025 & 2033
- Figure 15: South America New Chinese Tea Drinks Revenue (million), by Application 2025 & 2033
- Figure 16: South America New Chinese Tea Drinks Volume (K), by Application 2025 & 2033
- Figure 17: South America New Chinese Tea Drinks Revenue Share (%), by Application 2025 & 2033
- Figure 18: South America New Chinese Tea Drinks Volume Share (%), by Application 2025 & 2033
- Figure 19: South America New Chinese Tea Drinks Revenue (million), by Type 2025 & 2033
- Figure 20: South America New Chinese Tea Drinks Volume (K), by Type 2025 & 2033
- Figure 21: South America New Chinese Tea Drinks Revenue Share (%), by Type 2025 & 2033
- Figure 22: South America New Chinese Tea Drinks Volume Share (%), by Type 2025 & 2033
- Figure 23: South America New Chinese Tea Drinks Revenue (million), by Country 2025 & 2033
- Figure 24: South America New Chinese Tea Drinks Volume (K), by Country 2025 & 2033
- Figure 25: South America New Chinese Tea Drinks Revenue Share (%), by Country 2025 & 2033
- Figure 26: South America New Chinese Tea Drinks Volume Share (%), by Country 2025 & 2033
- Figure 27: Europe New Chinese Tea Drinks Revenue (million), by Application 2025 & 2033
- Figure 28: Europe New Chinese Tea Drinks Volume (K), by Application 2025 & 2033
- Figure 29: Europe New Chinese Tea Drinks Revenue Share (%), by Application 2025 & 2033
- Figure 30: Europe New Chinese Tea Drinks Volume Share (%), by Application 2025 & 2033
- Figure 31: Europe New Chinese Tea Drinks Revenue (million), by Type 2025 & 2033
- Figure 32: Europe New Chinese Tea Drinks Volume (K), by Type 2025 & 2033
- Figure 33: Europe New Chinese Tea Drinks Revenue Share (%), by Type 2025 & 2033
- Figure 34: Europe New Chinese Tea Drinks Volume Share (%), by Type 2025 & 2033
- Figure 35: Europe New Chinese Tea Drinks Revenue (million), by Country 2025 & 2033
- Figure 36: Europe New Chinese Tea Drinks Volume (K), by Country 2025 & 2033
- Figure 37: Europe New Chinese Tea Drinks Revenue Share (%), by Country 2025 & 2033
- Figure 38: Europe New Chinese Tea Drinks Volume Share (%), by Country 2025 & 2033
- Figure 39: Middle East & Africa New Chinese Tea Drinks Revenue (million), by Application 2025 & 2033
- Figure 40: Middle East & Africa New Chinese Tea Drinks Volume (K), by Application 2025 & 2033
- Figure 41: Middle East & Africa New Chinese Tea Drinks Revenue Share (%), by Application 2025 & 2033
- Figure 42: Middle East & Africa New Chinese Tea Drinks Volume Share (%), by Application 2025 & 2033
- Figure 43: Middle East & Africa New Chinese Tea Drinks Revenue (million), by Type 2025 & 2033
- Figure 44: Middle East & Africa New Chinese Tea Drinks Volume (K), by Type 2025 & 2033
- Figure 45: Middle East & Africa New Chinese Tea Drinks Revenue Share (%), by Type 2025 & 2033
- Figure 46: Middle East & Africa New Chinese Tea Drinks Volume Share (%), by Type 2025 & 2033
- Figure 47: Middle East & Africa New Chinese Tea Drinks Revenue (million), by Country 2025 & 2033
- Figure 48: Middle East & Africa New Chinese Tea Drinks Volume (K), by Country 2025 & 2033
- Figure 49: Middle East & Africa New Chinese Tea Drinks Revenue Share (%), by Country 2025 & 2033
- Figure 50: Middle East & Africa New Chinese Tea Drinks Volume Share (%), by Country 2025 & 2033
- Figure 51: Asia Pacific New Chinese Tea Drinks Revenue (million), by Application 2025 & 2033
- Figure 52: Asia Pacific New Chinese Tea Drinks Volume (K), by Application 2025 & 2033
- Figure 53: Asia Pacific New Chinese Tea Drinks Revenue Share (%), by Application 2025 & 2033
- Figure 54: Asia Pacific New Chinese Tea Drinks Volume Share (%), by Application 2025 & 2033
- Figure 55: Asia Pacific New Chinese Tea Drinks Revenue (million), by Type 2025 & 2033
- Figure 56: Asia Pacific New Chinese Tea Drinks Volume (K), by Type 2025 & 2033
- Figure 57: Asia Pacific New Chinese Tea Drinks Revenue Share (%), by Type 2025 & 2033
- Figure 58: Asia Pacific New Chinese Tea Drinks Volume Share (%), by Type 2025 & 2033
- Figure 59: Asia Pacific New Chinese Tea Drinks Revenue (million), by Country 2025 & 2033
- Figure 60: Asia Pacific New Chinese Tea Drinks Volume (K), by Country 2025 & 2033
- Figure 61: Asia Pacific New Chinese Tea Drinks Revenue Share (%), by Country 2025 & 2033
- Figure 62: Asia Pacific New Chinese Tea Drinks Volume Share (%), by Country 2025 & 2033
List of Tables
- Table 1: Global New Chinese Tea Drinks Revenue million Forecast, by Application 2020 & 2033
- Table 2: Global New Chinese Tea Drinks Volume K Forecast, by Application 2020 & 2033
- Table 3: Global New Chinese Tea Drinks Revenue million Forecast, by Type 2020 & 2033
- Table 4: Global New Chinese Tea Drinks Volume K Forecast, by Type 2020 & 2033
- Table 5: Global New Chinese Tea Drinks Revenue million Forecast, by Region 2020 & 2033
- Table 6: Global New Chinese Tea Drinks Volume K Forecast, by Region 2020 & 2033
- Table 7: Global New Chinese Tea Drinks Revenue million Forecast, by Application 2020 & 2033
- Table 8: Global New Chinese Tea Drinks Volume K Forecast, by Application 2020 & 2033
- Table 9: Global New Chinese Tea Drinks Revenue million Forecast, by Type 2020 & 2033
- Table 10: Global New Chinese Tea Drinks Volume K Forecast, by Type 2020 & 2033
- Table 11: Global New Chinese Tea Drinks Revenue million Forecast, by Country 2020 & 2033
- Table 12: Global New Chinese Tea Drinks Volume K Forecast, by Country 2020 & 2033
- Table 13: United States New Chinese Tea Drinks Revenue (million) Forecast, by Application 2020 & 2033
- Table 14: United States New Chinese Tea Drinks Volume (K) Forecast, by Application 2020 & 2033
- Table 15: Canada New Chinese Tea Drinks Revenue (million) Forecast, by Application 2020 & 2033
- Table 16: Canada New Chinese Tea Drinks Volume (K) Forecast, by Application 2020 & 2033
- Table 17: Mexico New Chinese Tea Drinks Revenue (million) Forecast, by Application 2020 & 2033
- Table 18: Mexico New Chinese Tea Drinks Volume (K) Forecast, by Application 2020 & 2033
- Table 19: Global New Chinese Tea Drinks Revenue million Forecast, by Application 2020 & 2033
- Table 20: Global New Chinese Tea Drinks Volume K Forecast, by Application 2020 & 2033
- Table 21: Global New Chinese Tea Drinks Revenue million Forecast, by Type 2020 & 2033
- Table 22: Global New Chinese Tea Drinks Volume K Forecast, by Type 2020 & 2033
- Table 23: Global New Chinese Tea Drinks Revenue million Forecast, by Country 2020 & 2033
- Table 24: Global New Chinese Tea Drinks Volume K Forecast, by Country 2020 & 2033
- Table 25: Brazil New Chinese Tea Drinks Revenue (million) Forecast, by Application 2020 & 2033
- Table 26: Brazil New Chinese Tea Drinks Volume (K) Forecast, by Application 2020 & 2033
- Table 27: Argentina New Chinese Tea Drinks Revenue (million) Forecast, by Application 2020 & 2033
- Table 28: Argentina New Chinese Tea Drinks Volume (K) Forecast, by Application 2020 & 2033
- Table 29: Rest of South America New Chinese Tea Drinks Revenue (million) Forecast, by Application 2020 & 2033
- Table 30: Rest of South America New Chinese Tea Drinks Volume (K) Forecast, by Application 2020 & 2033
- Table 31: Global New Chinese Tea Drinks Revenue million Forecast, by Application 2020 & 2033
- Table 32: Global New Chinese Tea Drinks Volume K Forecast, by Application 2020 & 2033
- Table 33: Global New Chinese Tea Drinks Revenue million Forecast, by Type 2020 & 2033
- Table 34: Global New Chinese Tea Drinks Volume K Forecast, by Type 2020 & 2033
- Table 35: Global New Chinese Tea Drinks Revenue million Forecast, by Country 2020 & 2033
- Table 36: Global New Chinese Tea Drinks Volume K Forecast, by Country 2020 & 2033
- Table 37: United Kingdom New Chinese Tea Drinks Revenue (million) Forecast, by Application 2020 & 2033
- Table 38: United Kingdom New Chinese Tea Drinks Volume (K) Forecast, by Application 2020 & 2033
- Table 39: Germany New Chinese Tea Drinks Revenue (million) Forecast, by Application 2020 & 2033
- Table 40: Germany New Chinese Tea Drinks Volume (K) Forecast, by Application 2020 & 2033
- Table 41: France New Chinese Tea Drinks Revenue (million) Forecast, by Application 2020 & 2033
- Table 42: France New Chinese Tea Drinks Volume (K) Forecast, by Application 2020 & 2033
- Table 43: Italy New Chinese Tea Drinks Revenue (million) Forecast, by Application 2020 & 2033
- Table 44: Italy New Chinese Tea Drinks Volume (K) Forecast, by Application 2020 & 2033
- Table 45: Spain New Chinese Tea Drinks Revenue (million) Forecast, by Application 2020 & 2033
- Table 46: Spain New Chinese Tea Drinks Volume (K) Forecast, by Application 2020 & 2033
- Table 47: Russia New Chinese Tea Drinks Revenue (million) Forecast, by Application 2020 & 2033
- Table 48: Russia New Chinese Tea Drinks Volume (K) Forecast, by Application 2020 & 2033
- Table 49: Benelux New Chinese Tea Drinks Revenue (million) Forecast, by Application 2020 & 2033
- Table 50: Benelux New Chinese Tea Drinks Volume (K) Forecast, by Application 2020 & 2033
- Table 51: Nordics New Chinese Tea Drinks Revenue (million) Forecast, by Application 2020 & 2033
- Table 52: Nordics New Chinese Tea Drinks Volume (K) Forecast, by Application 2020 & 2033
- Table 53: Rest of Europe New Chinese Tea Drinks Revenue (million) Forecast, by Application 2020 & 2033
- Table 54: Rest of Europe New Chinese Tea Drinks Volume (K) Forecast, by Application 2020 & 2033
- Table 55: Global New Chinese Tea Drinks Revenue million Forecast, by Application 2020 & 2033
- Table 56: Global New Chinese Tea Drinks Volume K Forecast, by Application 2020 & 2033
- Table 57: Global New Chinese Tea Drinks Revenue million Forecast, by Type 2020 & 2033
- Table 58: Global New Chinese Tea Drinks Volume K Forecast, by Type 2020 & 2033
- Table 59: Global New Chinese Tea Drinks Revenue million Forecast, by Country 2020 & 2033
- Table 60: Global New Chinese Tea Drinks Volume K Forecast, by Country 2020 & 2033
- Table 61: Turkey New Chinese Tea Drinks Revenue (million) Forecast, by Application 2020 & 2033
- Table 62: Turkey New Chinese Tea Drinks Volume (K) Forecast, by Application 2020 & 2033
- Table 63: Israel New Chinese Tea Drinks Revenue (million) Forecast, by Application 2020 & 2033
- Table 64: Israel New Chinese Tea Drinks Volume (K) Forecast, by Application 2020 & 2033
- Table 65: GCC New Chinese Tea Drinks Revenue (million) Forecast, by Application 2020 & 2033
- Table 66: GCC New Chinese Tea Drinks Volume (K) Forecast, by Application 2020 & 2033
- Table 67: North Africa New Chinese Tea Drinks Revenue (million) Forecast, by Application 2020 & 2033
- Table 68: North Africa New Chinese Tea Drinks Volume (K) Forecast, by Application 2020 & 2033
- Table 69: South Africa New Chinese Tea Drinks Revenue (million) Forecast, by Application 2020 & 2033
- Table 70: South Africa New Chinese Tea Drinks Volume (K) Forecast, by Application 2020 & 2033
- Table 71: Rest of Middle East & Africa New Chinese Tea Drinks Revenue (million) Forecast, by Application 2020 & 2033
- Table 72: Rest of Middle East & Africa New Chinese Tea Drinks Volume (K) Forecast, by Application 2020 & 2033
- Table 73: Global New Chinese Tea Drinks Revenue million Forecast, by Application 2020 & 2033
- Table 74: Global New Chinese Tea Drinks Volume K Forecast, by Application 2020 & 2033
- Table 75: Global New Chinese Tea Drinks Revenue million Forecast, by Type 2020 & 2033
- Table 76: Global New Chinese Tea Drinks Volume K Forecast, by Type 2020 & 2033
- Table 77: Global New Chinese Tea Drinks Revenue million Forecast, by Country 2020 & 2033
- Table 78: Global New Chinese Tea Drinks Volume K Forecast, by Country 2020 & 2033
- Table 79: China New Chinese Tea Drinks Revenue (million) Forecast, by Application 2020 & 2033
- Table 80: China New Chinese Tea Drinks Volume (K) Forecast, by Application 2020 & 2033
- Table 81: India New Chinese Tea Drinks Revenue (million) Forecast, by Application 2020 & 2033
- Table 82: India New Chinese Tea Drinks Volume (K) Forecast, by Application 2020 & 2033
- Table 83: Japan New Chinese Tea Drinks Revenue (million) Forecast, by Application 2020 & 2033
- Table 84: Japan New Chinese Tea Drinks Volume (K) Forecast, by Application 2020 & 2033
- Table 85: South Korea New Chinese Tea Drinks Revenue (million) Forecast, by Application 2020 & 2033
- Table 86: South Korea New Chinese Tea Drinks Volume (K) Forecast, by Application 2020 & 2033
- Table 87: ASEAN New Chinese Tea Drinks Revenue (million) Forecast, by Application 2020 & 2033
- Table 88: ASEAN New Chinese Tea Drinks Volume (K) Forecast, by Application 2020 & 2033
- Table 89: Oceania New Chinese Tea Drinks Revenue (million) Forecast, by Application 2020 & 2033
- Table 90: Oceania New Chinese Tea Drinks Volume (K) Forecast, by Application 2020 & 2033
- Table 91: Rest of Asia Pacific New Chinese Tea Drinks Revenue (million) Forecast, by Application 2020 & 2033
- Table 92: Rest of Asia Pacific New Chinese Tea Drinks Volume (K) Forecast, by Application 2020 & 2033
Frequently Asked Questions
1. What is the projected Compound Annual Growth Rate (CAGR) of the New Chinese Tea Drinks?
The projected CAGR is approximately 7.6%.
2. Which companies are prominent players in the New Chinese Tea Drinks?
Key companies in the market include Heytea, Shenzhen Pindao Restaurant Management, Auntea Jennny, CoCo Fresh Tea & Juice, Yihetang, Chabaidao, Shuyisxc, Zhengzhou Mixue Bingcheng, DAKASI, Alittle-tea, Sexytea, Peachful.
3. What are the main segments of the New Chinese Tea Drinks?
The market segments include Application, Type.
4. Can you provide details about the market size?
The market size is estimated to be USD 2471.5 million as of 2022.
5. What are some drivers contributing to market growth?
N/A
6. What are the notable trends driving market growth?
N/A
7. Are there any restraints impacting market growth?
N/A
8. Can you provide examples of recent developments in the market?
N/A
9. What pricing options are available for accessing the report?
Pricing options include single-user, multi-user, and enterprise licenses priced at USD 3950.00, USD 5925.00, and USD 7900.00 respectively.
10. Is the market size provided in terms of value or volume?
The market size is provided in terms of value, measured in million and volume, measured in K.
11. Are there any specific market keywords associated with the report?
Yes, the market keyword associated with the report is "New Chinese Tea Drinks," which aids in identifying and referencing the specific market segment covered.
12. How do I determine which pricing option suits my needs best?
The pricing options vary based on user requirements and access needs. Individual users may opt for single-user licenses, while businesses requiring broader access may choose multi-user or enterprise licenses for cost-effective access to the report.
13. Are there any additional resources or data provided in the New Chinese Tea Drinks report?
While the report offers comprehensive insights, it's advisable to review the specific contents or supplementary materials provided to ascertain if additional resources or data are available.
14. How can I stay updated on further developments or reports in the New Chinese Tea Drinks?
To stay informed about further developments, trends, and reports in the New Chinese Tea Drinks, consider subscribing to industry newsletters, following relevant companies and organizations, or regularly checking reputable industry news sources and publications.
Methodology
Step 1 - Identification of Relevant Samples Size from Population Database


Step 2 - Approaches for Defining Global Market Size (Value, Volume* & Price*)

Note*: In applicable scenarios
Step 3 - Data Sources
Primary Research
- Web Analytics
- Survey Reports
- Research Institute
- Latest Research Reports
- Opinion Leaders
Secondary Research
- Annual Reports
- White Paper
- Latest Press Release
- Industry Association
- Paid Database
- Investor Presentations

Step 4 - Data Triangulation
Involves using different sources of information in order to increase the validity of a study
These sources are likely to be stakeholders in a program - participants, other researchers, program staff, other community members, and so on.
Then we put all data in single framework & apply various statistical tools to find out the dynamic on the market.
During the analysis stage, feedback from the stakeholder groups would be compared to determine areas of agreement as well as areas of divergence